Data tables in Excel provide a powerful way to analyze multiple scenarios by automatically calculating different outcomes based on varying inputs. Whether you’re calculating loan payments, forecasting sales, or performing sensitivity analysis, data tables eliminate the need for manual recalculations. This tutorial will guide you through creating and managing data tables to enhance your spreadsheet analysis.
How to Create a One-Variable Data Table in Excel
One-variable data tables help you analyze how changing a single input affects your formula’s results. Let’s walk through the process step by step.
Step 1: Set Up Your Initial Formula
- Open a new worksheet
- Enter your base formula in a cell
- Identify the input cell that will vary
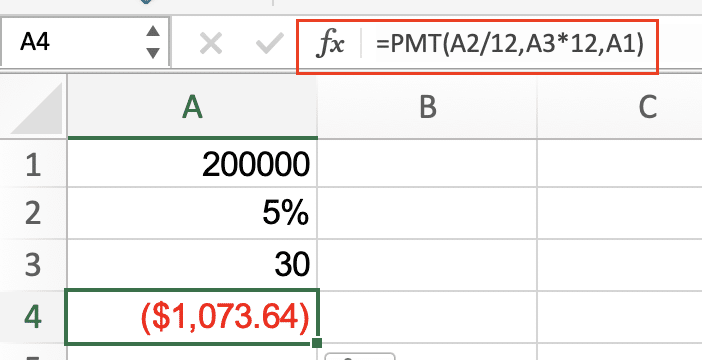
Example: Let’s calculate monthly payments for a $200,000 loan with different interest rates.
|
Cell |
Formula/Value |
Description |
|---|---|---|
|
A1 |
200000 |
Loan amount |
|
A2 |
5% |
Interest rate (base) |
|
A3 |
30 |
Loan term (years) |
|
A4 |
=PMT(A2/12,A3*12,A1) |
Monthly payment |

Step 2: Create the Input Range
- Select a column below your formula
- Enter the different values you want to analyze
- Leave one cell empty at the top of your range
Example:
|
Interest Rate |
Monthly Payment |
|---|---|
[blank cell]
=PMT(A2/12,A3*12,A1)
3%
4%
5%
6%

Step 3: Apply the Data Table Command
- Select the entire range including the blank cell and formula
- Navigate to Data > What-If Analysis > Data Table

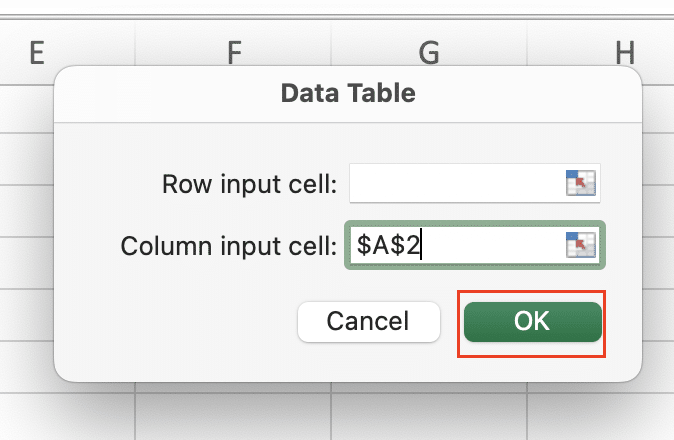
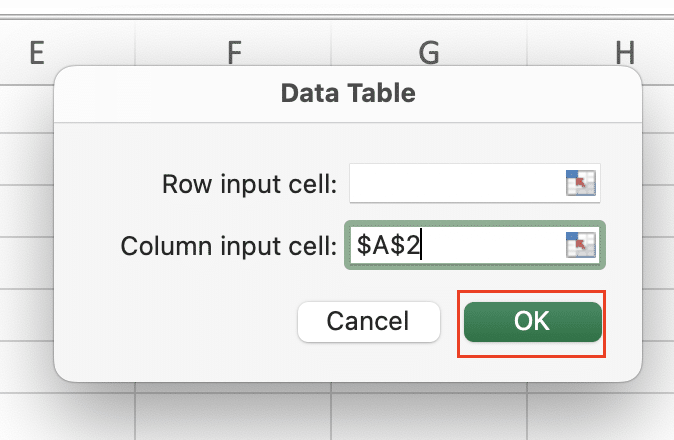
- Leave Row input cell blank
- Enter the cell reference for your variable (A2 in our example) in the Column input cell

- Click OK
Creating Two-Variable Data Tables for Complex Analysis
Two-variable data tables allow you to analyze how changes in two inputs affect your results.
Step 1: Structure Your Data
- Place your formula in the top-left corner of your range
- Enter row variables along the top row
- Enter column variables down the first column
Example: Analyzing profit with different prices and sales volumes
|
Profit 
Try the Free Spreadsheet Extension Over 500,000 Pros Are Raving About
Stop exporting data manually. Sync data from your business systems into Google Sheets or Excel with Coefficient and set it on a refresh schedule. Get Started |
100 units |
200 units |
300 units |
|---|---|---|---|
|
$10 |
=($B1*A2)-Fixed_Costs | ||
|
$15 | |||
|
$20 |
Step 2: Create the Two-Variable Table
- Select the entire range including variables and formula
- Navigate to Data > What-If Analysis > Data Table

- Enter the row input cell reference (units sold)
- Enter the column input cell reference (price)
- Click OK

How to Format and Manage Excel Data Tables
Applying Professional Formatting
- Select your data table range
- Click Format as Table in the Home tab

- Choose a style template
- Enable or disable header row as needed
Adding Calculated Columns
Example: Adding a profit margin column to a sales data table
=[@Revenue]-[@Costs])/[@Revenue]
Creating Dynamic Named Ranges
- Select your data table
- Click Formulas > Define Name

- Enter a name (e.g., “SalesData”)
- Use this formula for dynamic sizing:
=OFFSET(Sheet1!$A$1,0,0,COUNTA(Sheet1!$A:$A),COUNTA(Sheet1!$1:$1))
Automating Data Table Updates
To keep your data tables current:
- Link to external data sources:
=VLOOKUP([@ID],ExternalData,2,FALSE)
- Create refresh triggers:
Application.OnTime Now + TimeValue(“00:15:00”), “RefreshData”
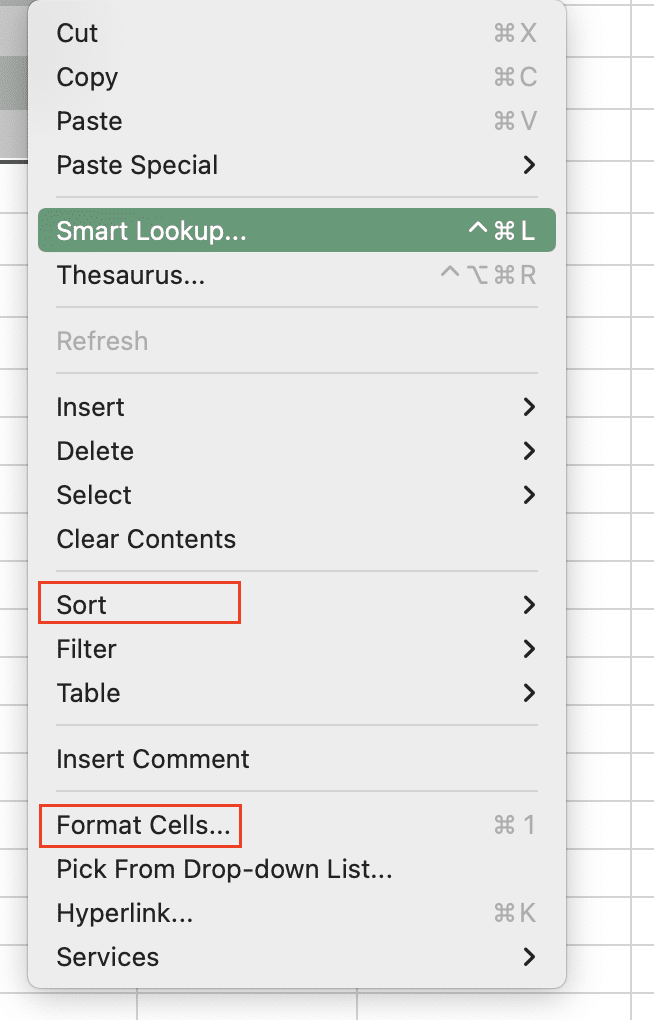
- Protect table structure:
- Right-click table
- Select Protect Sheet
- Check “Format cells” and “Sort“

- Enter password (optional)
Taking Your Analysis Further
Data tables transform static spreadsheets into dynamic analysis tools. By mastering these techniques, you can create sophisticated financial models and business scenarios with ease. Remember to regularly validate your calculations and keep your data sources updated for accurate results.
Ready to take your spreadsheet analysis to the next level? Try Coefficient to automatically sync real-time data from your business systems directly into your Excel data tables. Get started with Coefficient today and eliminate manual data updates forever.

