Clean your data to ensure consistency before starting aggregation
Use Excel’s built-in aggregation functions like SUM, AVERAGE, COUNT, or the powerful AGGREGATE function
Apply SUMIFS or array formulas for aggregating data based on multiple criteria
Create Pivot Tables for quick data rearrangement and different views of aggregated information
Visualize your aggregated results using Excel’s various chart types
Data aggregation is essential for making sense of large datasets in Excel. It allows you to summarize and analyze information quickly, uncovering valuable insights. This guide covers everything you need to know about aggregating data in Excel, from basic functions to advanced techniques.
Using the AGGREGATE Function in Excel
Introduction to the AGGREGATE Function
The AGGREGATE function is a powerful tool for data aggregation in Excel. Its syntax is:
=AGGREGATE(function_num, options, array, [k])
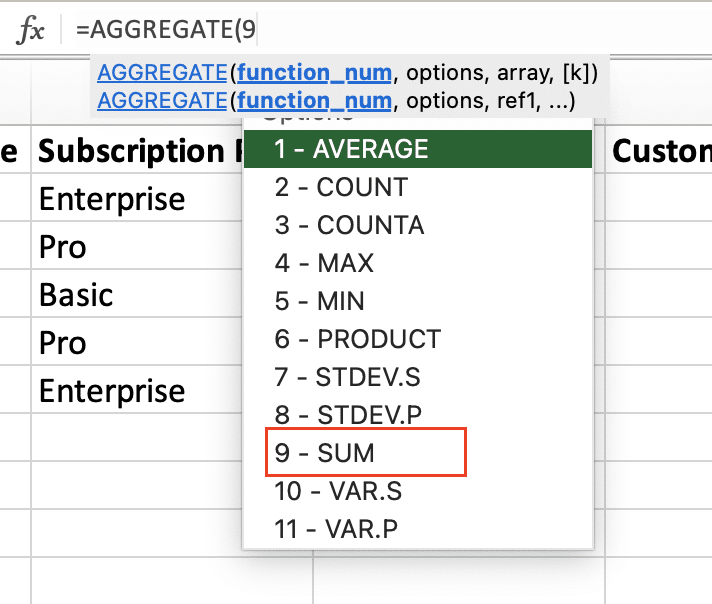
- function_num: Specifies which aggregation to perform (e.g., 1 for AVERAGE, 9 for SUM)
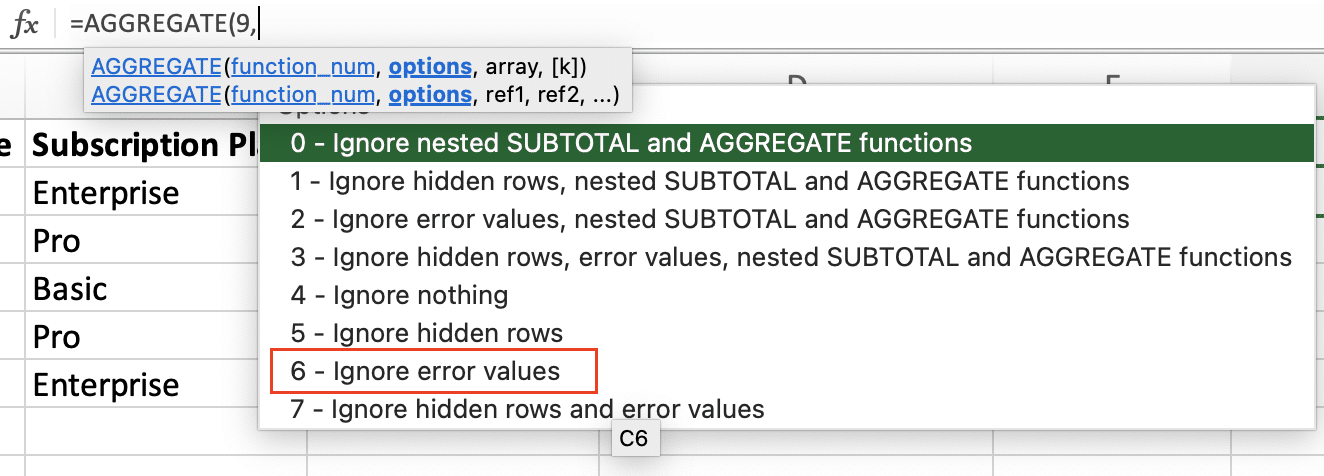
- options: Determines how to handle errors or hidden rows
- array: The range of cells to aggregate
- [k]: Optional parameter used with certain function numbers
AGGREGATE offers advantages over other functions:
- It can ignore errors and hidden rows automatically
- It provides access to functions not available through other means
- It allows for more complex calculations in a single formula
Step-by-Step Guide to Using AGGREGATE
Let’s walk through an example of using the AGGREGATE function:
- Open your Excel spreadsheet containing the data to aggregate
- Click on the cell where you want the result to appear
- Type “=AGGREGATE(” to start the function

- Choose a function number (e.g., 9 for SUM)

- Select an options number (e.g., 6 to ignore errors and hidden rows)

- Specify the range of cells to aggregate

- Close the parentheses and press Enter
Example:
=AGGREGATE(9, 6, A2:A100)
This formula sums the values in cells A2 through A100, ignoring any errors or hidden rows.
Advanced Data Aggregation Techniques
Aggregating Data from Multiple Columns
To aggregate data across multiple columns, you can use array formulas or the SUMPRODUCT function.
Array formula example:
=SUM(IF(A2:A100=”Category 1″, B2:B100*C2:C100))
This formula multiplies values in columns B and C, but only for rows where column A contains “Category 1”.

SUMPRODUCT example:
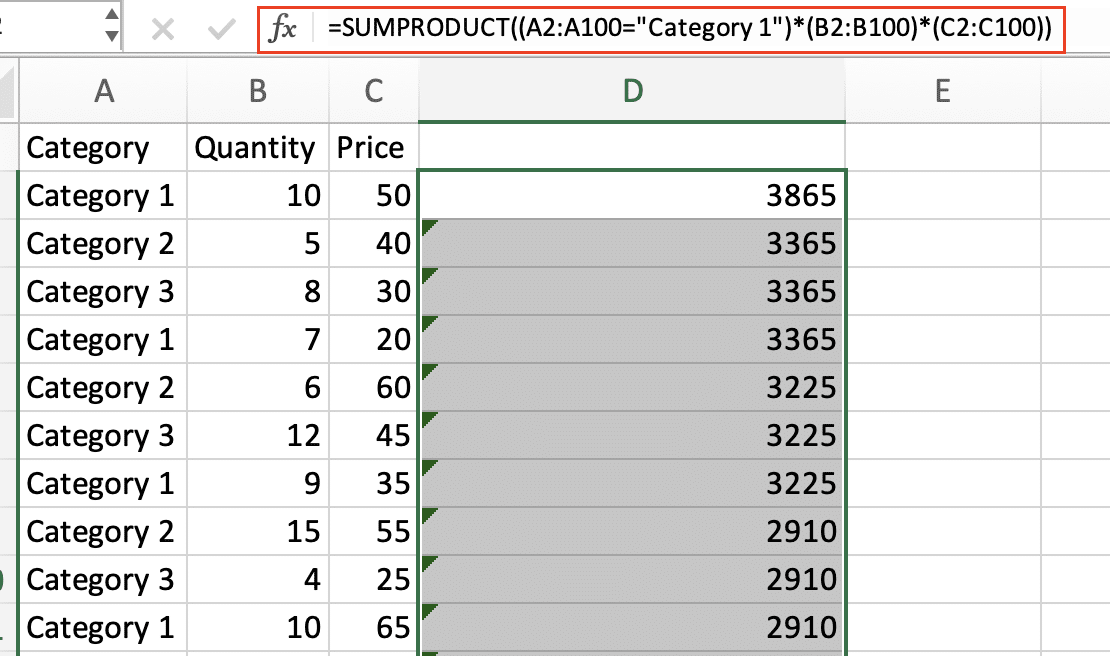
=SUMPRODUCT((A2:A100=”Category 1″)*(B2:B100)*(C2:C100))
This achieves the same result as the array formula but may be faster for large datasets.

Conditional Aggregation with SUMIF and SUMIFS
SUMIF and SUMIFS allow you to aggregate data based on one or more conditions.
SUMIF syntax:
=SUMIF(range, criteria, [sum_range])
SUMIFS syntax:
=SUMIFS(sum_range, criteria_range1, criteria1, [criteria_range2, criteria2, …])
Example using SUMIFS:
=SUMIFS(D2:D100, A2:A100, “Region 1”, B2:B100, “Product A”)

This formula sums values in column D where column A contains “Region 1” and column B contains “Product A”.
Visualizing Aggregated Data in Excel
Creating Pivot Tables for Data Aggregation
Pivot Tables are a powerful tool for aggregating and visualizing data in Excel:
- Select your data range
- Go to Insert > Pivot Table

- Choose where to place the Pivot Table and click ‘OK’

- Drag fields into the Rows, Columns, and Values areas

- Select the desired aggregation method (e.g., Sum, Average, Count)
Pivot Tables allow for quick rearrangement of data and easy creation of different views of your aggregated information.

Stop exporting data manually. Sync data from your business systems into Google Sheets or Excel with Coefficient and set it on a refresh schedule.
Get Started
Data Visualization Techniques
Excel offers various chart types for visualizing aggregated data:
- Bar charts: Compare values across categories
- Line charts: Show trends over time
- Pie charts: Display proportions of a whole
- Scatter plots: Reveal relationships between variables
To create an effective data visualization:
- Choose the appropriate chart type for your data
- Keep it simple and avoid cluttering the chart
- Use clear labels and a descriptive title
- Consider using color to highlight important information
Best Practices for Data Aggregation in Excel
Data Preparation and Cleaning
Clean, consistent data is crucial for accurate aggregation. Follow these steps:
- Remove duplicate entries
- Standardize data formats (e.g., dates, currency)
- Check for and correct spelling errors
- Fill in missing values or decide how to handle them
- Use data validation to prevent future errors
Performance Optimization
When working with large datasets:
- Use Excel’s data model for improved performance
- Avoid volatile functions (e.g., NOW(), TODAY()) in large formulas
- Consider using Power Query for data preparation and aggregation
- Break complex calculations into smaller steps
- Use named ranges to make formulas more readable and efficient
Understanding Data Aggregation in Excel
What is Data Aggregation?
Data aggregation is the process of combining multiple data points into a single, summarized value. In Excel, this often means calculating totals, averages, or counts from raw data. Aggregation helps simplify complex datasets, making them easier to analyze and visualize.
Common uses for data aggregation in Excel include:
- Calculating sales totals by region or product category
- Finding average customer ratings for different services
- Counting the number of transactions per day or month
- Summarizing survey responses across multiple questions
Excel Functions for Data Aggregation
Excel offers several built-in functions for data aggregation. Here’s an overview of the most commonly used ones:
| Function | Purpose | Syntax |
| SUM | Adds up a range of cells | =SUM(range) |
| AVERAGE | Calculates the arithmetic mean | =AVERAGE(range) |
| COUNT | Counts the number of cells with numbers | =COUNT(range) |
| AGGREGATE | Performs various aggregation operations | =AGGREGATE(function_num, options, range) |
When to use each function:
FAQ: Common Questions About Data Aggregation in Excel
How do I aggregate data in Excel based on multiple columns?
Use the SUMIFS function or array formulas to aggregate data based on multiple criteria. For example:
=SUMIFS(D2:D100, A2:A100, “Criteria1”, B2:B100, “Criteria2”)
This formula sums values in column D where column A meets “Criteria1” and column B meets “Criteria2”.
What is the aggregate formula in Excel?
The AGGREGATE function in Excel allows for various aggregation operations. Its syntax is:
=AGGREGATE(function_num, options, array, [k])
Function numbers determine the type of aggregation (e.g., 1 for AVERAGE, 9 for SUM), while options control how to handle errors or hidden rows.
How can I aggregate data from different sheets in Excel?
To aggregate data from multiple sheets:
- Use the ‘3D reference’ syntax: =SUM(Sheet1:Sheet3!A1)
- Create a summary sheet with formulas referencing other sheets
- Use Power Query to combine and aggregate data from multiple sheets
Can I use the AGGREGATE function in Excel graphs or charts?
Yes, you can use the AGGREGATE function in Excel charts. Create a column with AGGREGATE formulas, then use that column as the data source for your chart.
How does Coefficient improve data aggregation compared to Excel’s built-in functions?
Coefficient enhances Excel’s data aggregation capabilities by:
- Connecting to multiple data sources for real-time updates
- Providing advanced filtering and aggregation options
- Improving performance when working with large datasets
- Offering automated data refresh and report distribution
Data aggregation is a crucial skill for Excel users. By mastering functions like AGGREGATE, SUMIFS, and Pivot Tables, you can efficiently analyze large datasets and uncover valuable insights. For even more powerful data aggregation capabilities, consider using tools like Coefficient to streamline your workflow and enhance your Excel experience.
Ready to take your data aggregation to the next level? Get started with Coefficient today and discover how it can transform your Excel data analysis.


