The MODE function in Excel helps you identify the most frequently occurring values in your dataset, making it invaluable for analyzing trends and patterns in numerical data. Whether you’re analyzing sales figures, survey responses, or performance metrics, understanding how to use MODE effectively can streamline your data analysis process.
How to Use the MODE Function in Excel
The MODE function comes in two primary variations: MODE.SNGL for finding single most frequent values and MODE.MULT for identifying multiple modes. Let’s explore how to use each version effectively.
Finding Single Mode Values with MODE.SNGL
MODE.SNGL returns the most frequently occurring value in a dataset. If multiple values tie for the highest frequency, it returns the lowest value.
Basic Syntax:
=MODE.SNGL(number1,[number2],…)
Step-by-Step Example:
- Create a sample dataset:
|
Sales Amounts |
|---|
|
100 |
|
200 |
|
100 |
|
300 |
|
100 |
|
200 |
- Enter the formula:
=MODE.SNGL(A2:A7) - Result: 100 (appears three times)

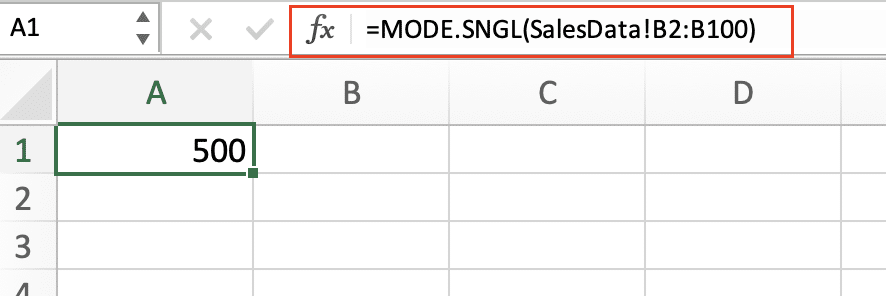
Real-World Example:
=MODE.SNGL(SalesData!B2:B100)
To use this formula, follow these steps:
- Create a new sheet named SalesData.
- Enter the dataset in columns A and B of the SalesData sheet.
- On another sheet (or in the same sheet), use the formula
This formula finds the most common sale amount in your dataset.
Calculating Multiple Modes with MODE.MULT
MODE.MULT returns an array of all values that appear most frequently in a dataset.
Basic Syntax:
=MODE.MULT(number1,[number2],…)
Important: MODE.MULT requires array entry (Ctrl+Shift+Enter in older Excel versions).
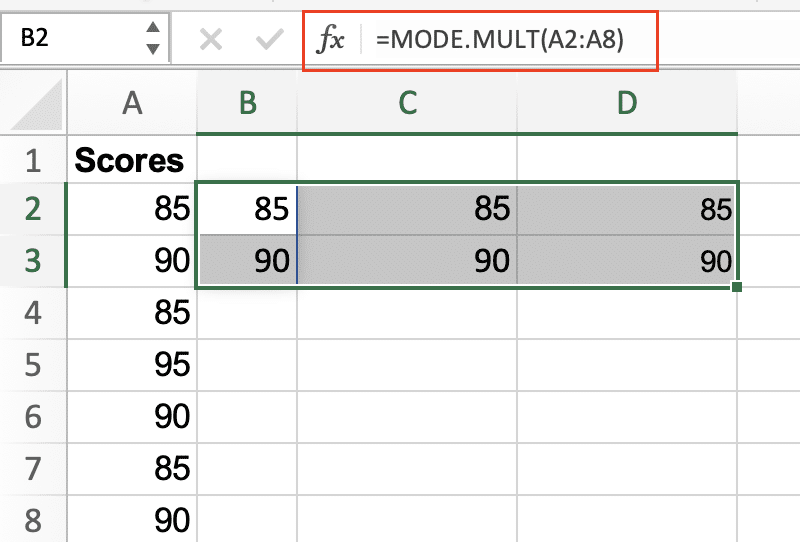
Step-by-Step Example:
- Create a dataset:
|
Scores |
|---|
|
85 |
|
90 |
|
85 |
|
95 |
|
90 |
|
85 |
|
90 
Try the Free Spreadsheet Extension Over 500,000 Pros Are Raving About
Stop exporting data manually. Sync data from your business systems into Google Sheets or Excel with Coefficient and set it on a refresh schedule. Get Started |
- Select multiple cells for output
- Enter the formula:
=MODE.MULT(A2:A8) - Results: 85, 90 (both appear three times)
Real-World Applications of MODE in Excel
Analyzing Sales Frequencies
Example 1: Finding Most Common Order Value
=MODE.SNGL(OrderValues)
Example 2: Multiple Price Points Analysis
=MODE.MULT(PricePoints)
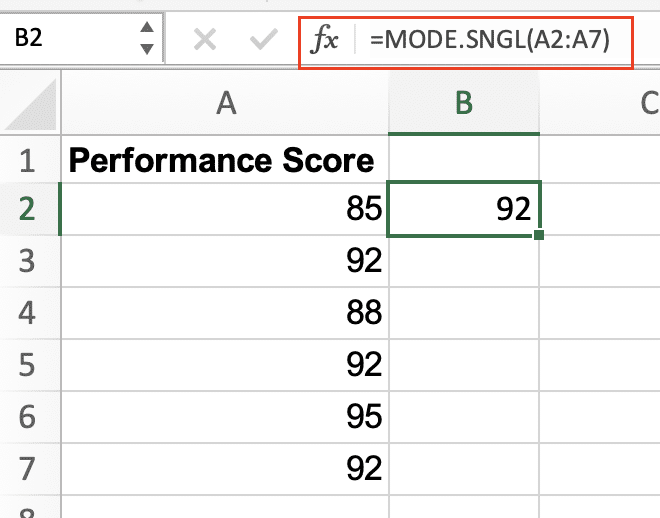
Peak Performance Metrics
Step-by-Step Implementation:
- Collect performance data:
|
Performance Score |
|---|
|
85 |
|
92 |
|
88 |
|
92 |
|
95 |
|
92 |
- Find most common score using the formula:
=MODE.SNGL(A2:A7)
Combining MODE with Other Functions
MODE with IF Statements
Example: Conditional Mode Calculation
=MODE.SNGL(IF(Region=”North”,Sales,””))
Array Formulas with MODE
Complex Example:
=MODE.MULT(IF(Region=”North”,IF(Sales>1000,Sales,””)))
Essential MODE Function Tips
Handling Special Cases
- Blank Cells:
- MODE ignores empty cells
- Text values are ignored
- Zero values are included
- Large Datasets:
- Use named ranges for cleaner formulas
- Consider performance impact with MODE.MULT
- Filter data before applying MODE
Format Considerations
- Number formatting:
- Keep consistent decimal places
- Use appropriate number formats
- Consider rounding when necessary
MODE Function Best Practices
- Data Preparation:
- Clean data before analysis
- Remove outliers if necessary
- Verify data types are consistent
- Error Handling:
- Use IFERROR for robust formulas
- Validate input ranges
- Document assumptions
Next Steps
Now that you understand how to leverage Excel’s MODE functions, you can apply these techniques to your own data analysis tasks. For more advanced data analysis capabilities, consider upgrading your Excel workflow with Coefficient’s real-time data integration.
Ready to supercharge your Excel data analysis? Get started with Coefficient to connect your spreadsheets directly to your business systems and ensure your MODE calculations always use the most up-to-date data.


