The CHOOSECOLS function in Excel provides a streamlined way to extract specific columns from a dataset. Whether you’re analyzing sales data or preparing financial reports, this function helps you select and reorganize columns without complex formulas. Let’s explore how to use CHOOSECOLS effectively in your daily Excel tasks.
How to Extract Specific Columns Using CHOOSECOLS
The CHOOSECOLS function follows a straightforward syntax that makes column selection intuitive. Let’s break down the process step by step.
Basic Syntax
=CHOOSECOLS(array, column1, [column2], …)
Where:
- array: The range of data you want to extract columns from
- column1: The first column number you want to select
- column2 (optional): Additional column numbers to select
Let’s walk through a practical example:
- Prepare Your Data Create a sample dataset with multiple columns:
|
Employee |
Department |
Salary |
Start Date |
Location |
|---|---|---|---|---|
|
John |
Sales |
50000 |
1/1/2024 |
New York |
|
Sarah |
Marketing |
55000 |
2/1/2024 |
Chicago |
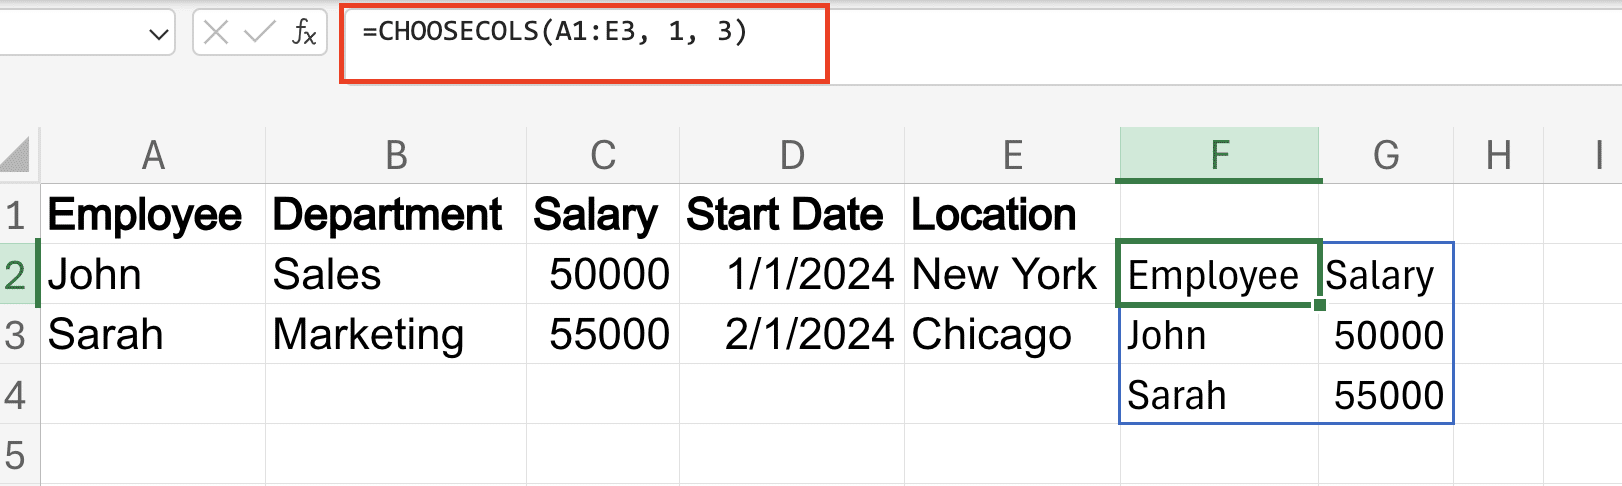
- Apply CHOOSECOLS
=CHOOSECOLS(A1:E3, 1, 3)
This formula extracts the Employee and Salary columns.
- Review Results
|
Employee |
Salary |
|---|---|
|
John |
50000 |
|
Sarah |
55000 |
Select Multiple Columns from a Dataset
Working with non-consecutive columns requires careful attention to column numbering. Here’s how to master it:
- Identify Column Numbers Count columns from left to right, starting with 1
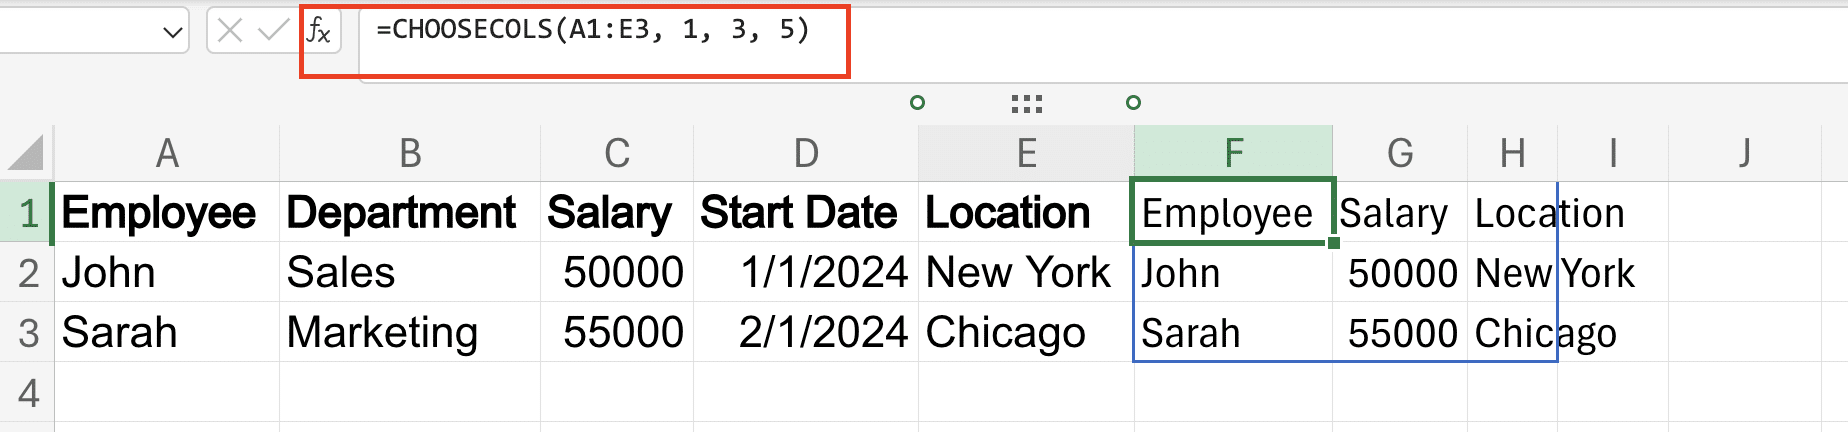
- Create Your Formula To select Employee, Salary, and Location:
=CHOOSECOLS(A1:E3, 1, 3, 5)

Stop exporting data manually. Sync data from your business systems into Google Sheets or Excel with Coefficient and set it on a refresh schedule.
Get Started
- Reorder Columns Change the order by rearranging numbers:
=CHOOSECOLS(A1:E3, 5, 1, 3)
This places Location first, followed by Employee and Salary.

Combine CHOOSECOLS with Other Array Functions
CHOOSECOLS becomes more powerful when combined with other functions. Here’s how to create advanced data transformations:
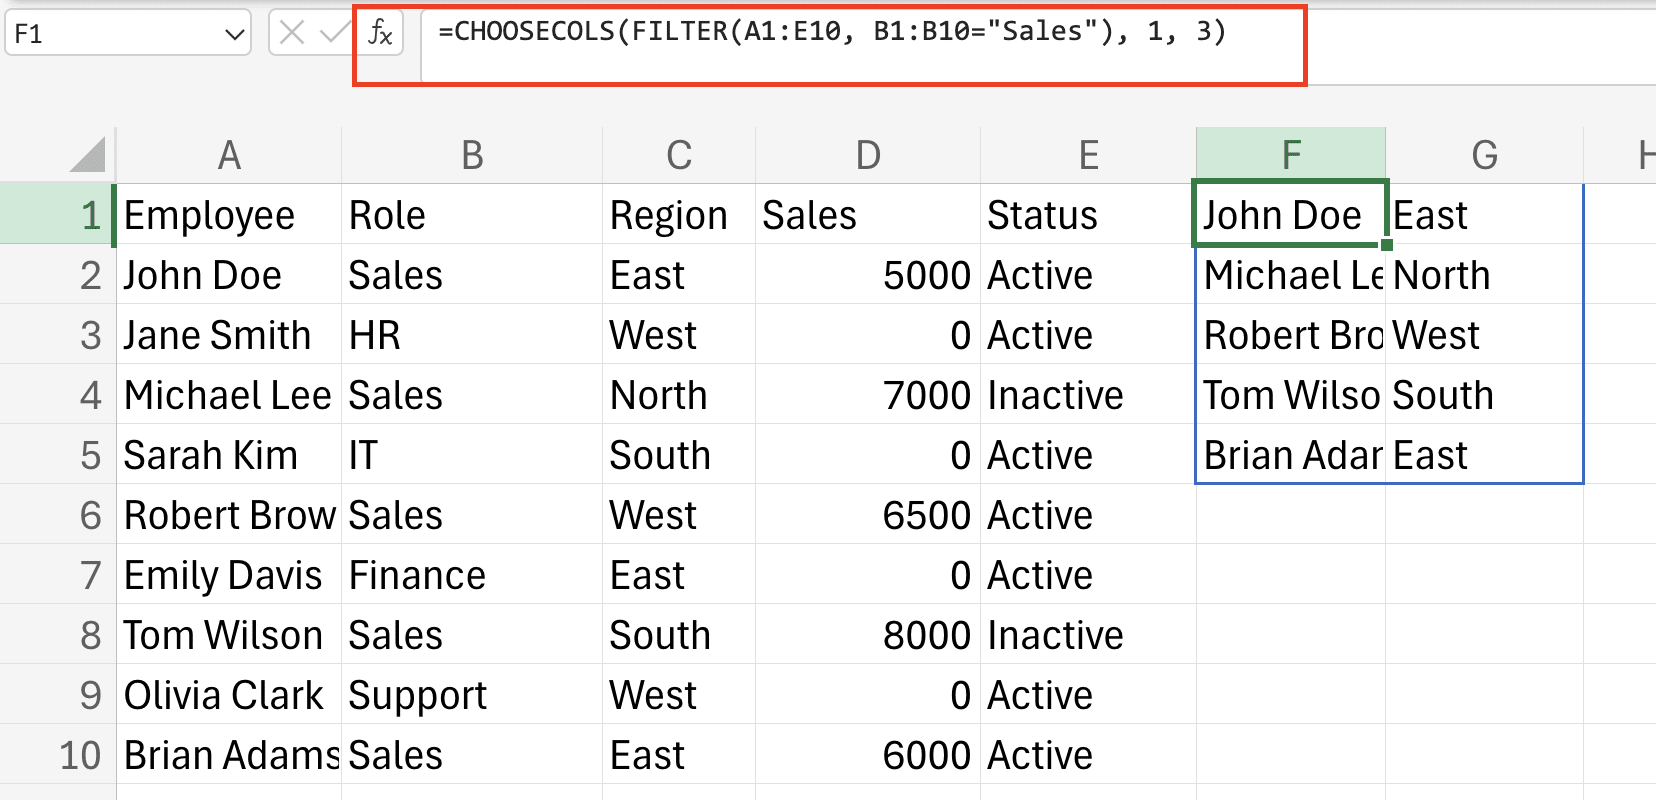
Integration with FILTER
=CHOOSECOLS(FILTER(A1:E10, B1:B10=”Sales”), 1, 3)
This extracts Employee and Salary columns for Sales department only.
Using with SORT
=CHOOSECOLS(SORT(A1:E10, 3, 1), 1, 3, 5)
This sorts by Salary while selecting specific columns.

Real-World Applications for CHOOSECOLS
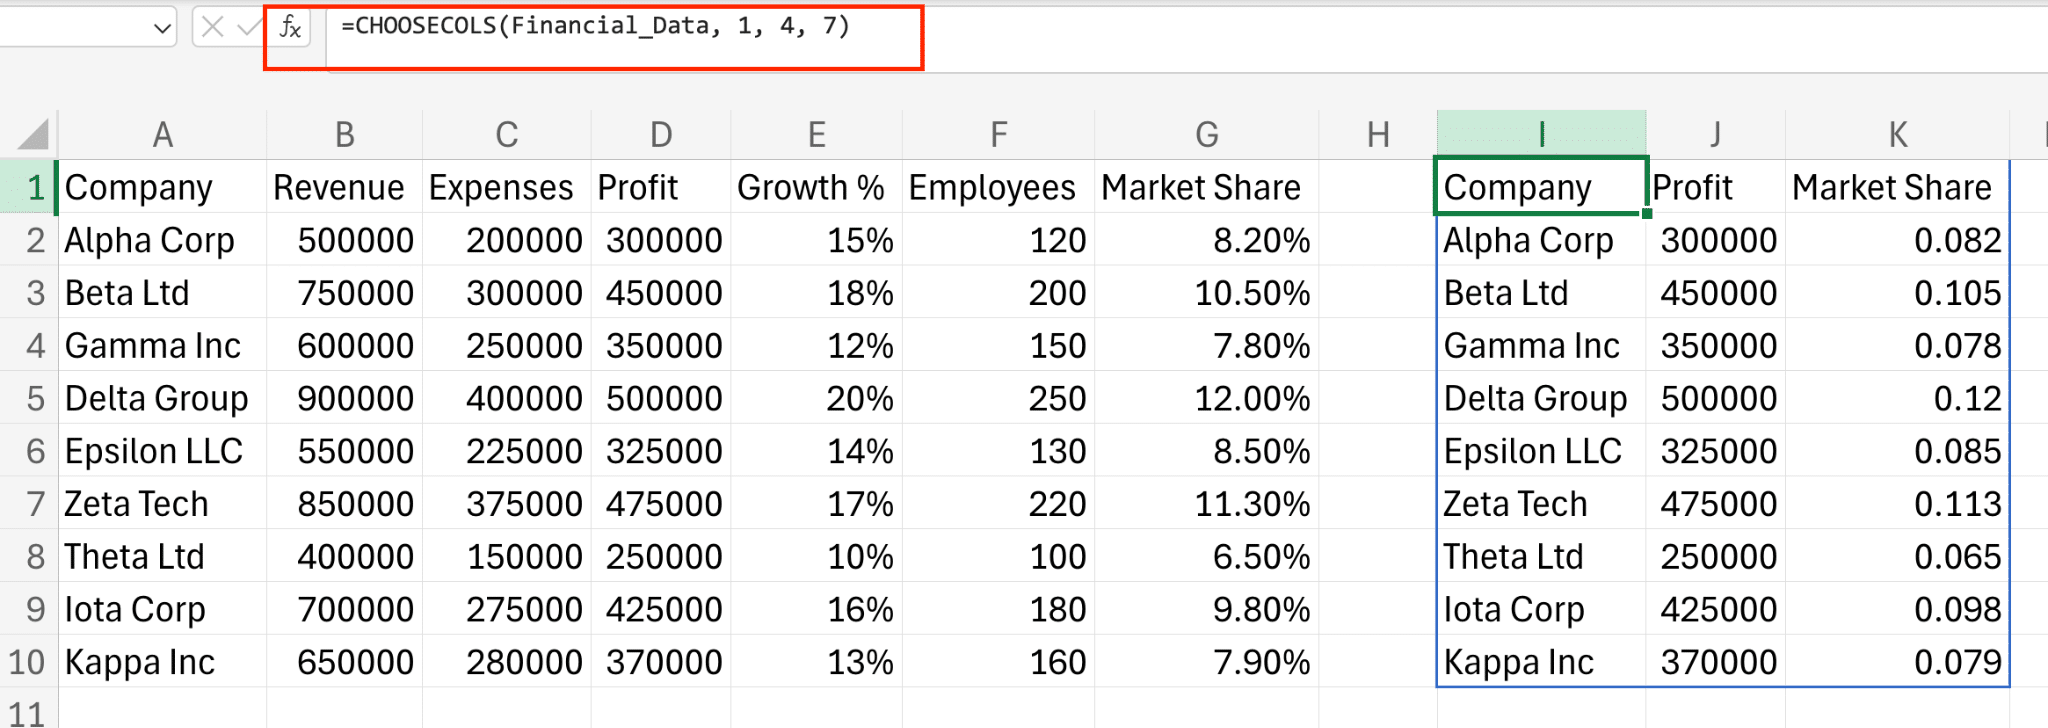
Financial Reporting Example
- Create Monthly Revenue Report
=CHOOSECOLS(Financial_Data, 1, 4, 7)
Extracts Date, Revenue, and Profit columns
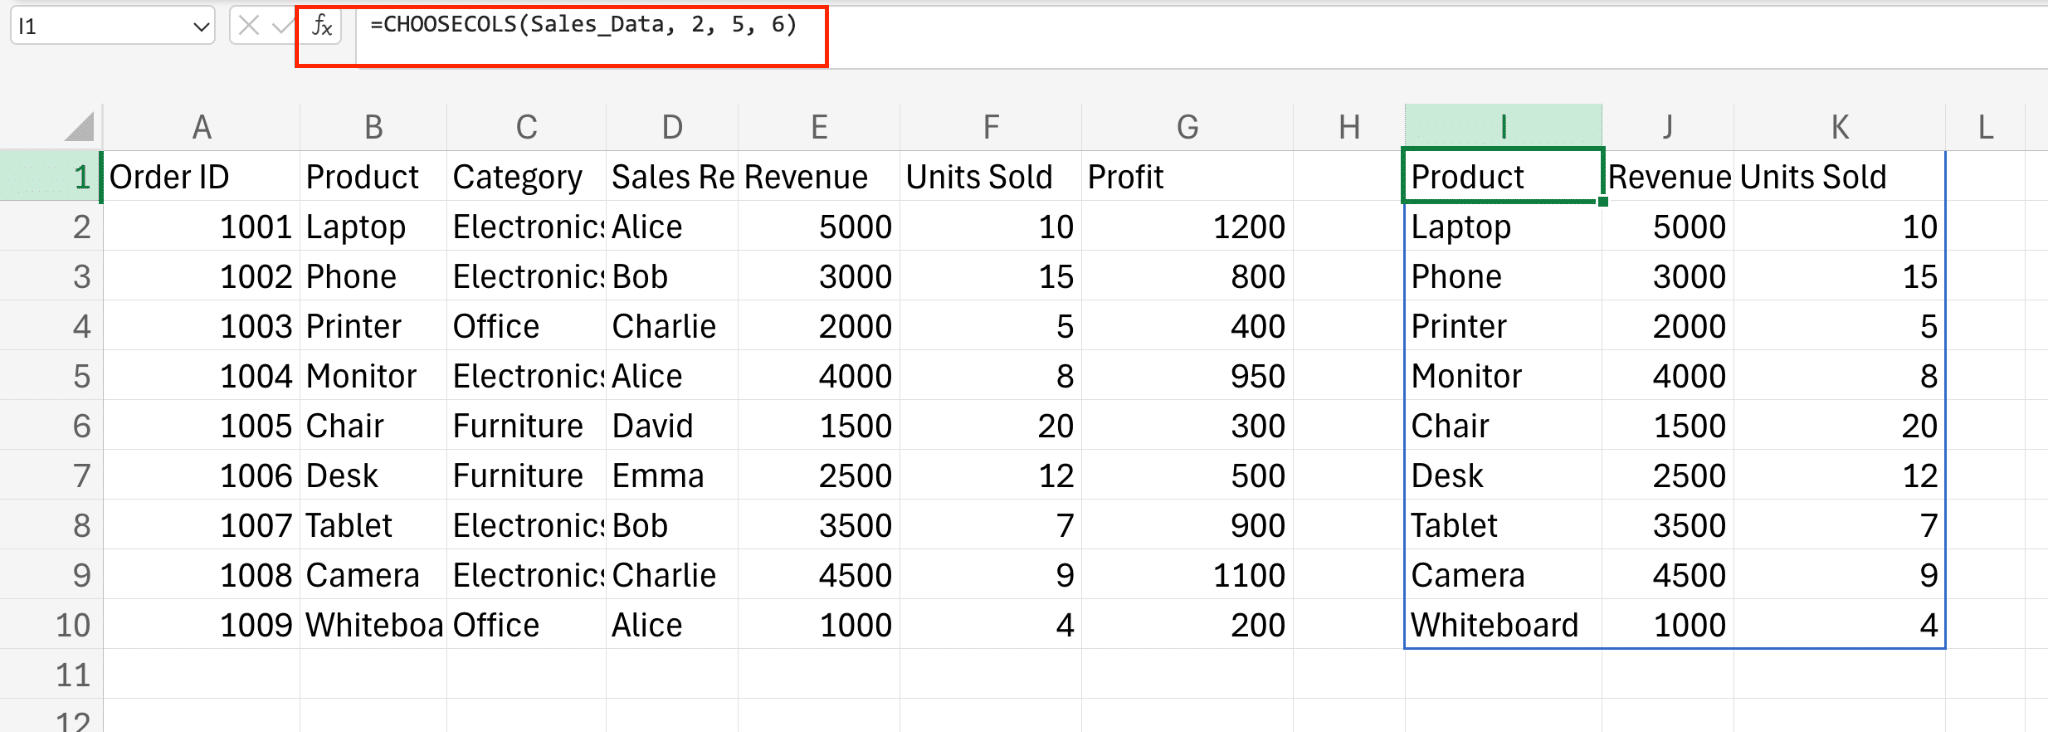
- Sales Analysis
=CHOOSECOLS(Sales_Data, 2, 5, 6)
Focuses on Product, Quantity, and Revenue
Custom Report Creation
- Set Up Template
- Define your output structure
- Identify required columns
- Apply CHOOSECOLS with dynamic ranges
- Format Output
- Add headers
- Apply number formatting
- Include subtotals where needed
Next Steps
Now that you understand CHOOSECOLS, start experimenting with your own datasets. Combine it with other functions to create powerful data analysis solutions. For more advanced data analysis capabilities and real-time Excel integration, try Coefficient’s data automation tools.
Get started with Coefficient today to transform your Excel workflow and automate your reporting processes.


