Excel’s BYROW function transforms how you process row-based data calculations. This dynamic array function lets you apply custom operations across entire rows automatically, eliminating the need for complex formulas or manual cell-by-cell processing. Learn how to leverage BYROW to streamline your spreadsheet workflows and enhance your data analysis capabilities.
Creating Your First BYROW Function in Excel
Let’s start with a practical example to understand how BYROW works in real-world scenarios.
Step 1: Set up your sample dataset
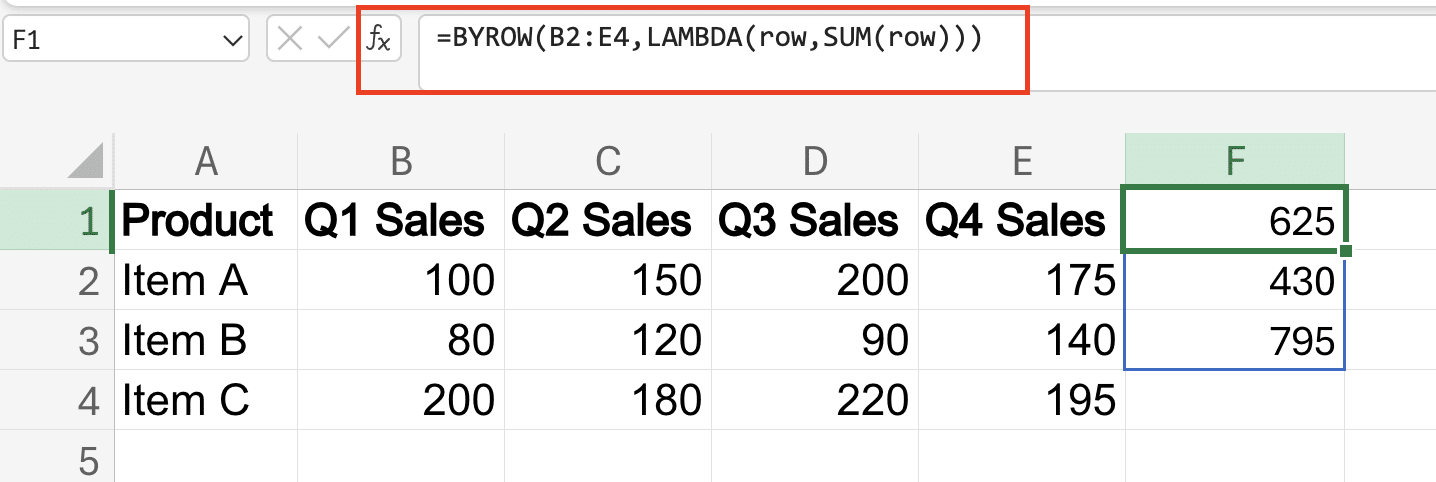
Create a simple table with multiple columns of numerical data:
|
Product |
Q1 Sales |
Q2 Sales |
Q3 Sales |
Q4 Sales |
|---|---|---|---|---|
|
Item A |
100 |
150 |
200 |
175 |
|
Item B |
80 |
120 |
90 |
140 |
|
Item C |
200 |
180 |
220 |
195 |
Step 2: Write your first BYROW formula
Command: Enter this basic BYROW formula to sum each row
Copy
=BYROW(B2:E4,LAMBDA(row,SUM(row)))

Step 3: Apply the function
- Select the cell where you want your results
- Enter the formula
- Press Enter (the result will spill automatically)
The formula breaks down into two main parts:
- BYROW(array, operation): Defines the range and function
- LAMBDA(row,SUM(row)): Specifies what to do with each row
Calculating Row Totals with BYROW
BYROW excels at performing calculations across entire rows. Here’s how to implement various calculations:
Basic Row Sum Formula
Command: Calculate row totals with conditions
Copy
=BYROW(B2:E4,LAMBDA(row,SUM(IF(row>100,row,0))))
This formula:
- Processes each row individually
- Adds only values greater than 100
- Returns zero for values below the threshold

Handling Blank Cells and Errors
Command: Create an error-handling formula
Copy
=BYROW(B2:E4,LAMBDA(row,SUM(IF(ISNUMBER(row),row,0))))

Processing Multiple Columns Together
BYROW becomes powerful when combining multiple operations:
Example: Weighted Average Calculation
|
Product |
Weight |
Value 1 |
Value 2 |
Value 3 |
|---|---|---|---|---|
|
Item A |
0.3 |
10 |
20 |
30 |
|
Item B |
0.5 |
15 |
25 |
35 |
Command: Calculate weighted averages
Copy

Stop exporting data manually. Sync data from your business systems into Google Sheets or Excel with Coefficient and set it on a refresh schedule.
Get Started
=BYROW(C2:E3,LAMBDA(row,AVERAGE(row)*B2))

Real-World BYROW Applications
Financial Analysis Example
Consider this sales performance table:
|
Region |
Sales |
Costs |
Tax Rate |
Profit Margin |
|---|---|---|---|---|
|
North |
1000 |
600 |
0.2 |
0.15 |
|
South |
1200 |
800 |
0.18 |
0.12 |
Command: Calculate net profit after tax
Copy
=BYROW(B2:E3,LAMBDA(row,(row[1]-row[2])*(1-row[3])*row[4]))
Working with LAMBDA in BYROW
LAMBDA functions extend BYROW’s capabilities:
Custom LAMBDA Expression Example
Command: Create a conditional sum with multiple criteria
Copy
=BYROW(B2:E3, LAMBDA(row, (INDEX(row, 1) – INDEX(row, 2)) * (1 – INDEX(row, 3)) * INDEX(row, 4)))

Combining BYROW with Other Excel Functions
BYROW works seamlessly with other array functions:
BYROW and BYCOL Integration
Command: Compare row and column operations
Copy
=LET(
row_totals,BYROW(B2:E4,LAMBDA(row,SUM(row))),
col_totals,BYCOL(B2:E4,LAMBDA(col,SUM(col))),
row_totals/col_totals
)
Next Steps
Start implementing BYROW in your own spreadsheets by:
- Converting existing row-based calculations
- Experimenting with different LAMBDA expressions
- Building more efficient data processing workflows
Ready to take your Excel data analysis to the next level? Connect your spreadsheets to live data sources with Coefficient. Get started now and transform how you work with Excel.

