
Ever wished you could do several calculations at once in Excel without writing a bunch of nested formulas? That’s where the AGGREGATE function comes in handy.
It lets you crunch numbers in different ways using just one formula. Whether you’re totaling sales or crunching lab data, AGGREGATE can make your job easier.
Let’s see how it works.
AGGREGATE Function in Excel 101: The Basics
The AGGREGATE function in Excel is a powerful tool that allows you to perform a variety of aggregate calculations on a range of data. Unlike traditional aggregate functions like SUM, AVERAGE, or COUNT, the AGGREGATE function offers a more flexible and comprehensive approach to data analysis.
The primary purpose of the AGGREGATE function is to provide a single function that can handle multiple types of aggregate calculations, while also offering the ability to exclude certain values from the analysis. This makes it a valuable asset when working with datasets that contain blank cells, errors, or other types of data that you may want to exclude from your calculations.
Understanding the Syntax and Parameters of the AGGREGATE Function
The syntax of the AGGREGATE function is as follows:
=AGGREGATE(function_num, options, array)
Let’s break down each of these parameters:
- function_num: This parameter specifies the type of aggregate calculation you want to perform. The AGGREGATE function supports a wide range of calculations, including SUM, AVERAGE, COUNT, MAX, MIN, and many more. Each calculation is represented by a unique numeric code, which you’ll need to reference when using the function.
- options: This parameter allows you to control how the AGGREGATE function handles certain types of data, such as blank cells, errors, or logical values. You can use various numeric codes to specify the desired behavior.
- array: This is the range of cells or the data set that you want to perform the aggregate calculation on.
By understanding the syntax and parameters of the AGGREGATE function, you’ll be able to tailor it to your specific data analysis needs and ensure accurate and reliable results.
Types of Aggregate Calculations You Can Perform
The AGGREGATE function in Excel supports a wide range of aggregate calculations, including:
- SUM: Calculates the addition of the values in the specified range.
- AVERAGE: Calculates the mean of the values in the specified range.
- COUNT: Counts the number of non-blank cells in the specified range.
- MAX: Finds the maximum value in the specified range.
- MIN: Finds the minimum value in the specified range.
- PRODUCT: Calculates the product of the values in the specified range.
- STDEV.S: Calculates the sample standard deviation of the values in the specified range.
- STDEV.P: Calculates the population standard deviation of the values in the specified range.
- VAR.S: Calculates the sample variance of the values in the specified range.
- VAR.P: Calculates the population variance of the values in the specified range.
Each of these aggregate calculations can be performed using the AGGREGATE function, and you can choose the appropriate function_num code to specify the desired calculation.
How to Find Probability in Excel
In the first part of this comprehensive guide, we covered the basics of calculating probability in Excel using functions like COUNTIF, COUNTIFS, and NORMDIST. Now, let’s dive into some more advanced techniques that will take your probability analysis to the next level.
Using T.TEST for Probability Calculations
The T.TEST function in Excel is a powerful tool for determining the probability of a given value or range of values occurring within a dataset. This function is particularly useful when you need to compare two sample populations and assess the statistical significance of any differences between them.
To use T.TEST, simply input your two data ranges and select the appropriate test type (one-tailed or two-tailed). Excel will then provide you with the probability (p-value) that the observed difference between the two samples could have occurred by chance.
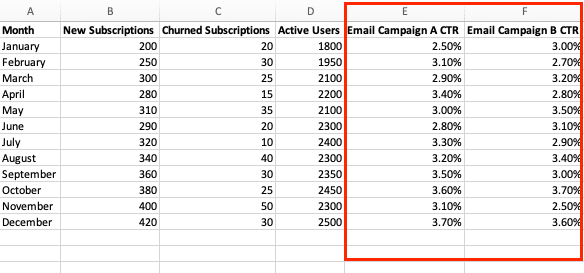
Let’s walk through an example. Suppose you want to compare the click-through rates (CTR) of two different email campaigns. You can use the T.TEST function to determine if the difference in CTR between the two campaigns is statistically significant. Here’s how:

Stop exporting data manually. Sync data from your business systems into Google Sheets or Excel with Coefficient and set it on a refresh schedule.
Get Started
- Gather the CTR data for both email campaigns in separate columns or ranges.
- In a new cell, use the formula =T.TEST(range1, range2, 2, 2) to perform a two-tailed T-test.
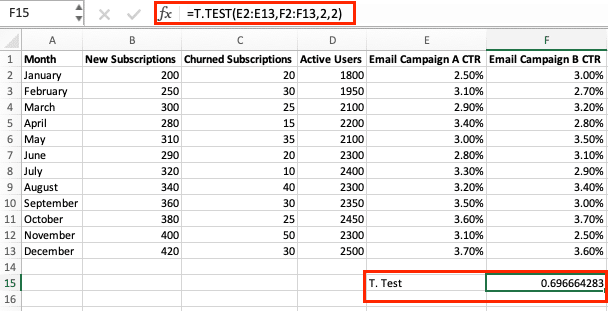
- The resulting p-value will indicate the probability that the observed difference in CTR between the two campaigns could have occurred by chance. If the p-value is less than your chosen significance level (e.g., 0.05), you can conclude that the difference is statistically significant.
Probability Calculations: Z-Scores and More
In addition to the T.TEST function, Excel offers other advanced tools for calculating probability, such as z-scores. Z-scores are a standardized measure of how many standard deviations a data point is from the mean of a dataset. They are particularly useful for understanding the likelihood of a specific value occurring within a normal distribution.
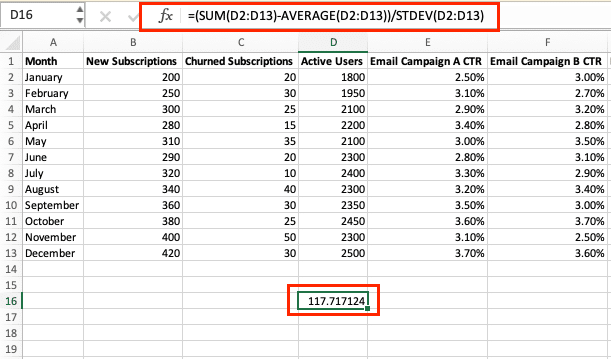
To calculate a z-score in Excel, you can use the formula =(value – mean) / standard_deviation. This will give you the amount of deviations the value is from the mean, which you can then use to determine the corresponding probability.
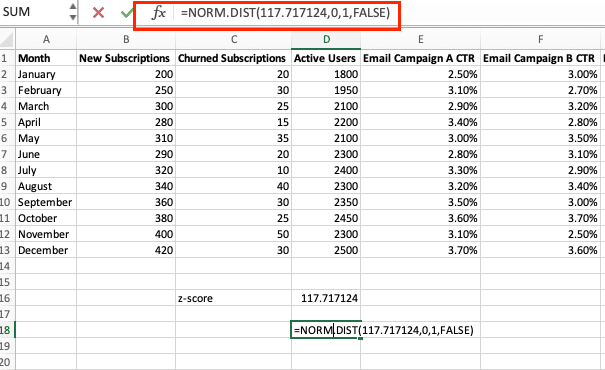
For example, let’s say you want to know the probability of a active customers using a platform being more than two standard deviations above the mean. You can calculate the z-score for the purchase amount and then use the NORM.DIST function to find the probability.
- Calculate the mean and standard deviation of your active customers.
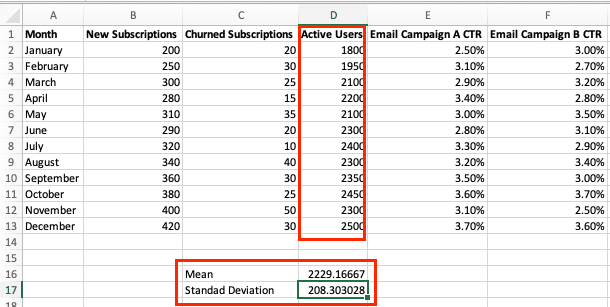
- Use the formula =(active customers – mean) / standard_deviation to get the z-score.
- Plug the z-score into the formula =NORM.DIST(z_score, 0, 1, FALSE) to find the probability.
By understanding and applying z-scores, you’ll be able to tackle more complex probability calculations and gain deeper insights from your data.
Probability Distributions in Excel: A Deep Dive
Excel also provides a range of functions for working with different probability distributions, such as the normal, binomial, and Poisson distributions. These distributions can be used to model various real-world scenarios and calculate the likelihood of specific outcomes.
For example, the NORMDIST function can be used to calculate the probability of a value falling within a certain range of a normal distribution. The BINOM.DIST function, on the other hand, can be used to calculate the probability of a certain number of successes in a fixed number of trials, where each trial has a binary outcome (success or failure).
To get started with probability distributions in Excel, familiarize yourself with the different distribution functions and their parameters. Then, practice applying them to your own data and scenarios to see how they can provide valuable insights.
Mastering AGGREGATE in Excel
AGGREGATE in Excel is a real time-saver. It handles tricky data like errors or outliers without breaking a sweat, which means less headache for you.
If you’re looking to improve your Excel skills even more, check out how Coefficient can pull live data from your work apps right into your spreadsheet. Try it for free today!


