Understanding and nurturing customer relationships is the cornerstone of growth and sustainability for SaaS businesses.
In 2025, customer health score is a critical metric that forecasts the longevity of customer relationships, identifies expansion opportunities, and highlights churn risks.
Coefficient’s pre-built dashboard templates empower teams to monitor and enhance this vital metric using live data for accurate, proactive decision-making.
This blog explores the intricacies of customer health scores, guiding you through its calculation, significance, and optimization, with Coefficient as your navigator.
What is a Customer Health Score?
A customer health score is a SaaS metric that gauges the risk of a customer discontinuing their service, essentially measuring churn risk. It also indicates upsell readiness, reflecting the overall status of your customer relationship.
Each SaaS business may calculate this score uniquely, based on variables specific to their product and customer interaction patterns. The score is a composite metric reflecting the likelihood of a customer continuing to do business with you, potentially expanding their engagement, or being at risk of churning.
Tracking customer health scores is about actionable intelligence, not just metric monitoring. Implementing a refined customer experience program with targeted insights from health scores delivers three key advantages:
- Minimized Churn: Satisfied customers stay longer, directly correlating with loyalty.
- Boosted Sales: Happy customers are more inclined to explore higher-tier products.
- Enhanced Reputation: Exceptional service yields positive word-of-mouth, amplifying market presence and potential sales.
How to Calculate Customer Health Score
There isn’t a universal formula for the Customer Health Score as it varies based on the company’s specific objectives, customer success criteria, and available data points.
Typically, it combines several weighted factors relevant to customer engagement and satisfaction.
- Indicator Identification: Pinpoint metrics that correlate with customer satisfaction and churn.
- Score Segmentation: Distinguish between positive and negative customer actions in your score calculation.
- Action Weighting: Assign weights to quantify each action’s impact on customer health.
- Customer Segmentation: Tailor your approach by segmenting customers and adjusting weights accordingly.
- Total Action Scoring: Multiply action occurrences by their weights, adding or subtracting based on the action’s nature.
Leveraging Coefficient for Customer Health Scores
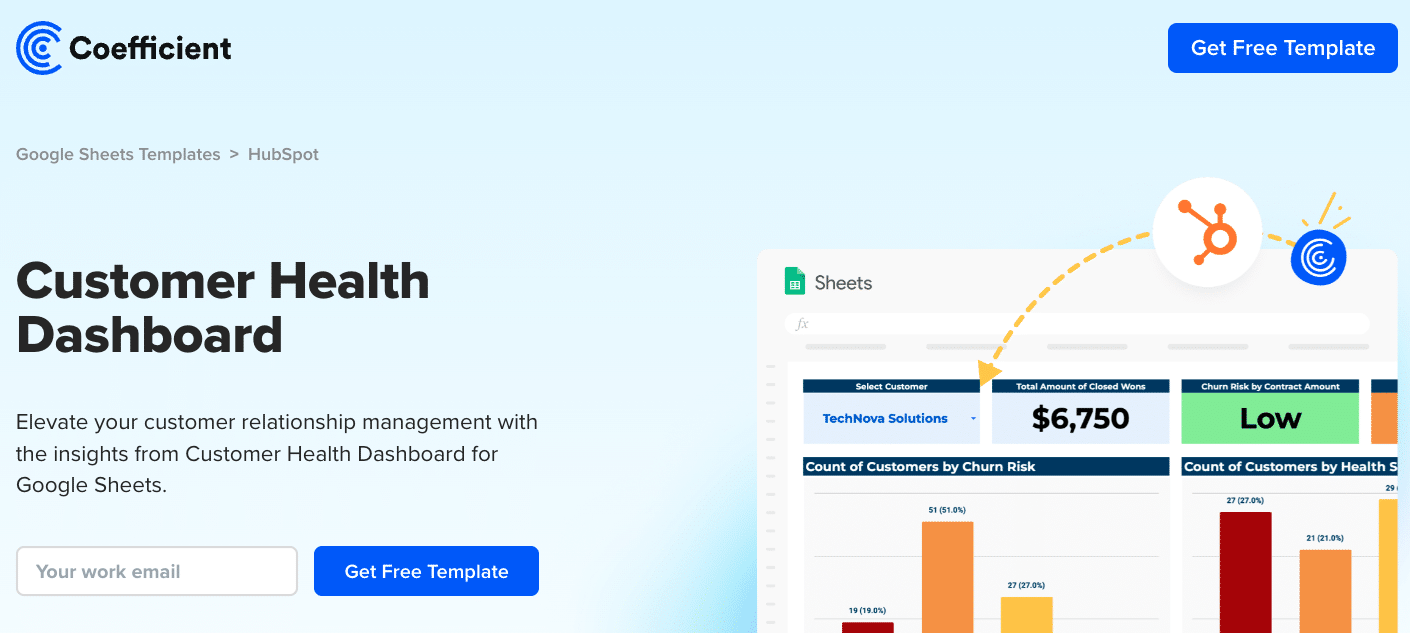
Coefficient’s Customer Health Score Dashboard for Google Sheets makes it easy to track and analyze key customer metrics.
Here’s a quick tutorial on how to use it:
Step 1: Download the (Free) Customer Health Score
To start, head to Coefficient.io.
Enter your work email in the box and click ‘Get Free Template.’
Follow the prompts to make a copy of the HubSpot Customer Health Template.
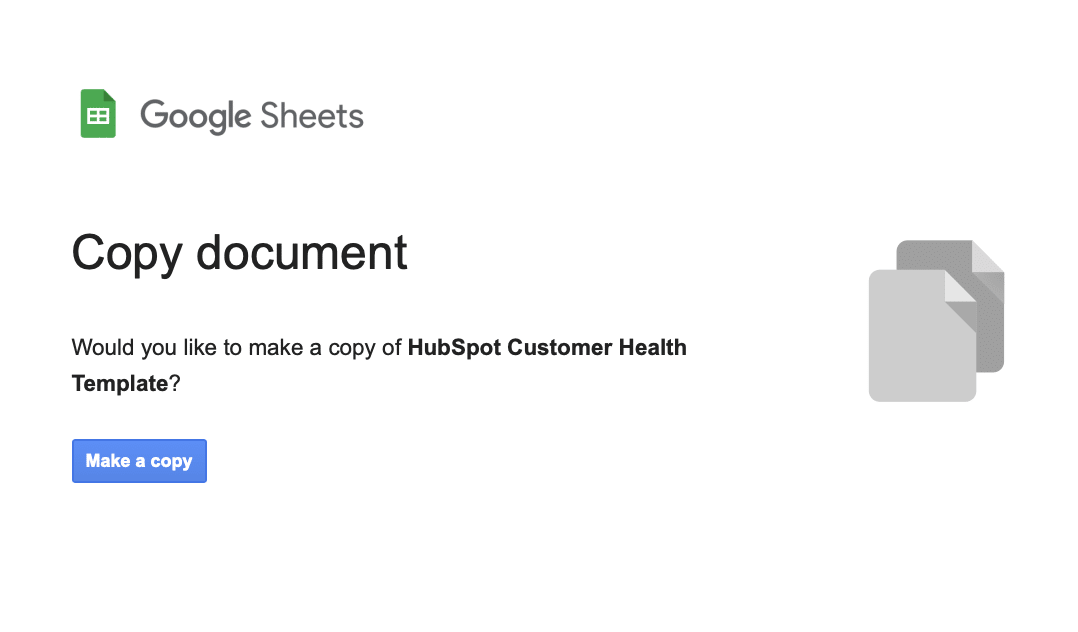
Your Dashboard will open in a new spreadsheet.

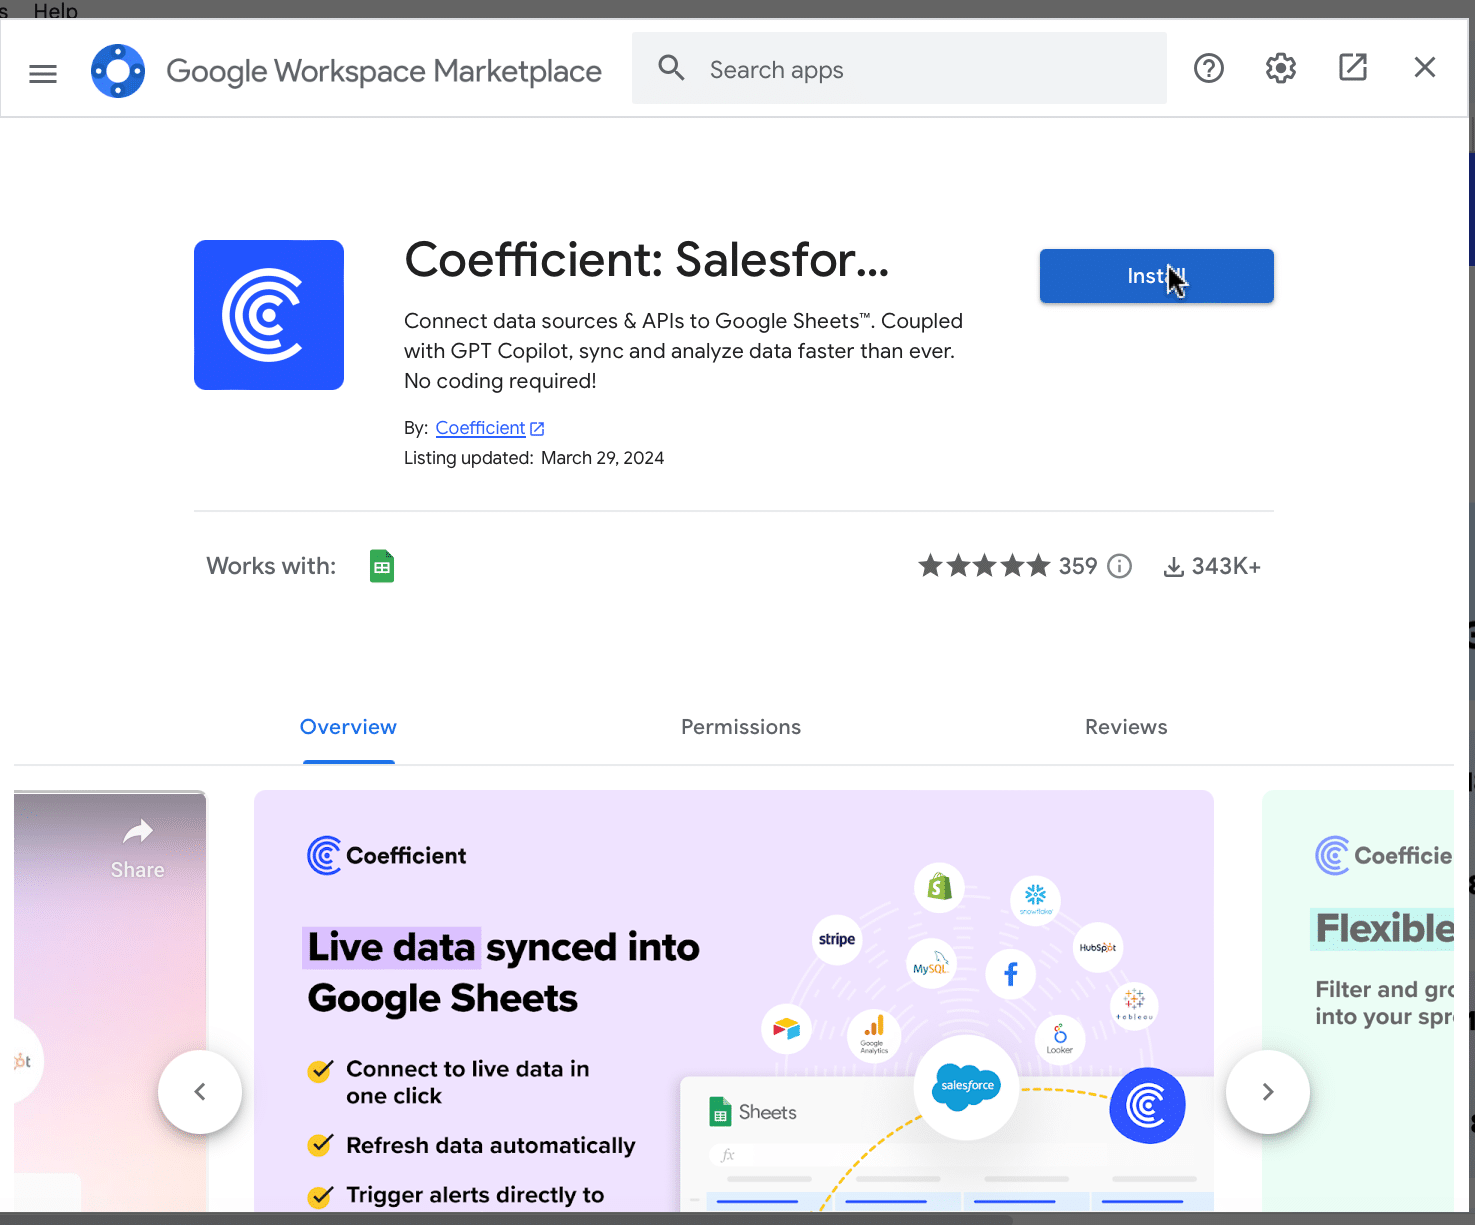
If this is your first time using Coefficient, you’ll need to add it as an add-on to Google Sheets. Click ‘Add to Sheets’ to continue.
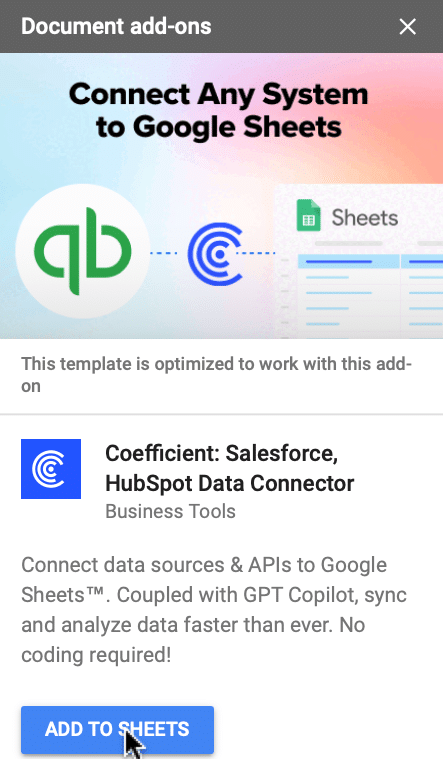
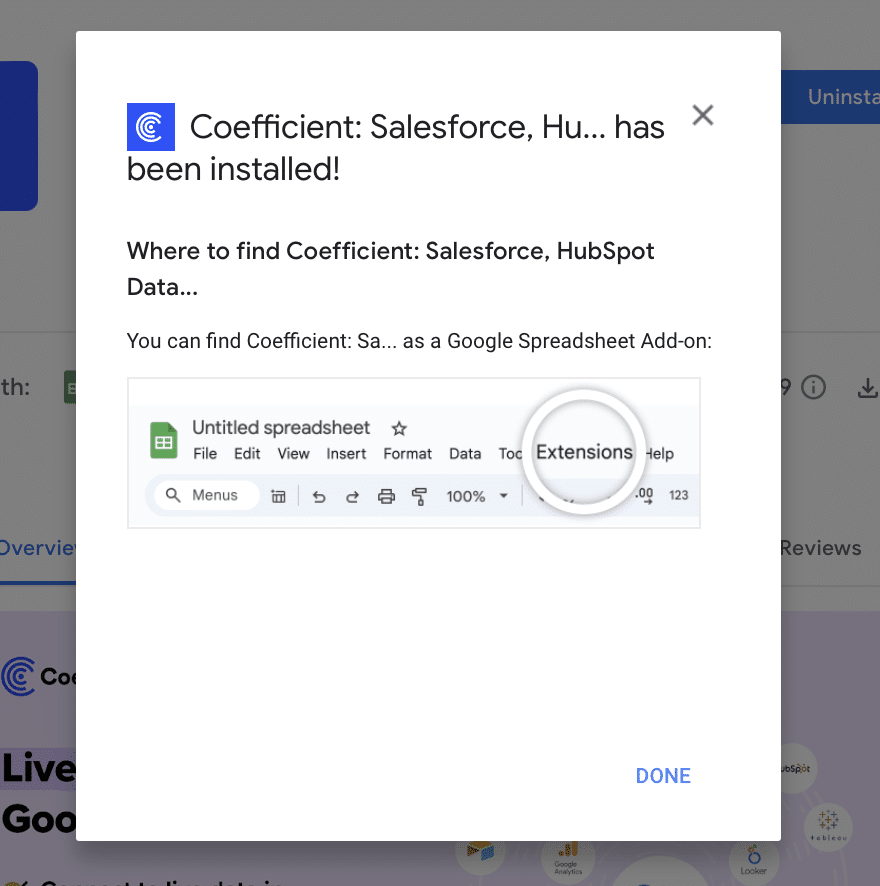
Hit the ‘Install’ button and follow the prompts to complete the installation.
Step 2: Connect Coefficient to HubSpot
After installation is complete, click ‘Done’ to return to your spreadsheet.
Click ‘Connect to HubSpot’ from the Coefficient menu on the right-hand side of your spreadsheet.
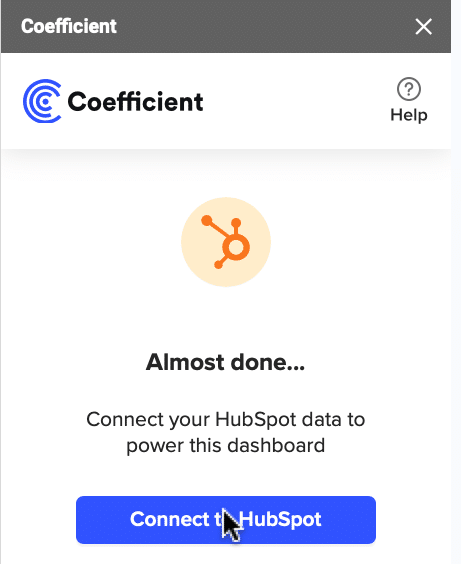
Follow the prompts to authorize Coefficient to your HubSpot account.
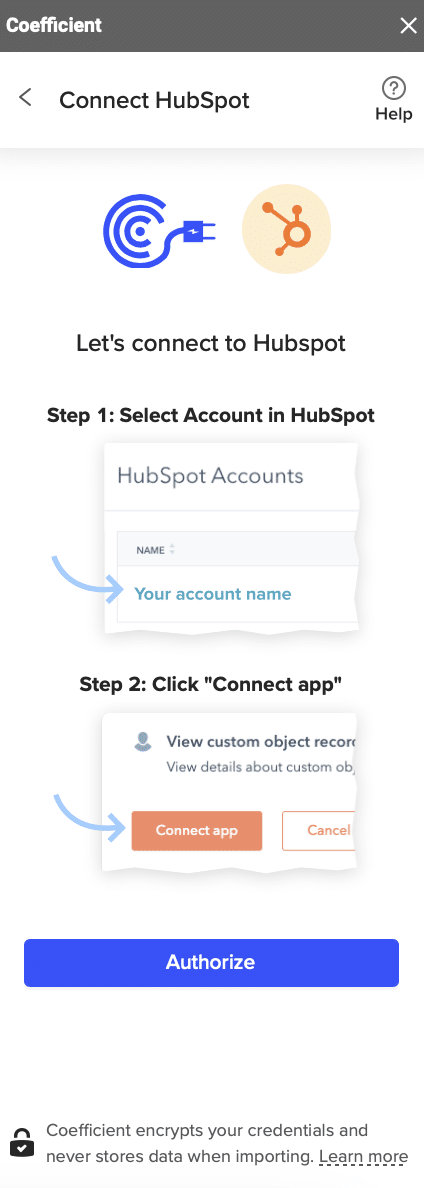
If successful, you’ll see the following notification at the top of your spreadsheet.

To update your data, navigate to the ‘HubSpot Import’ tab of your spreadsheet and click ‘Refresh.’
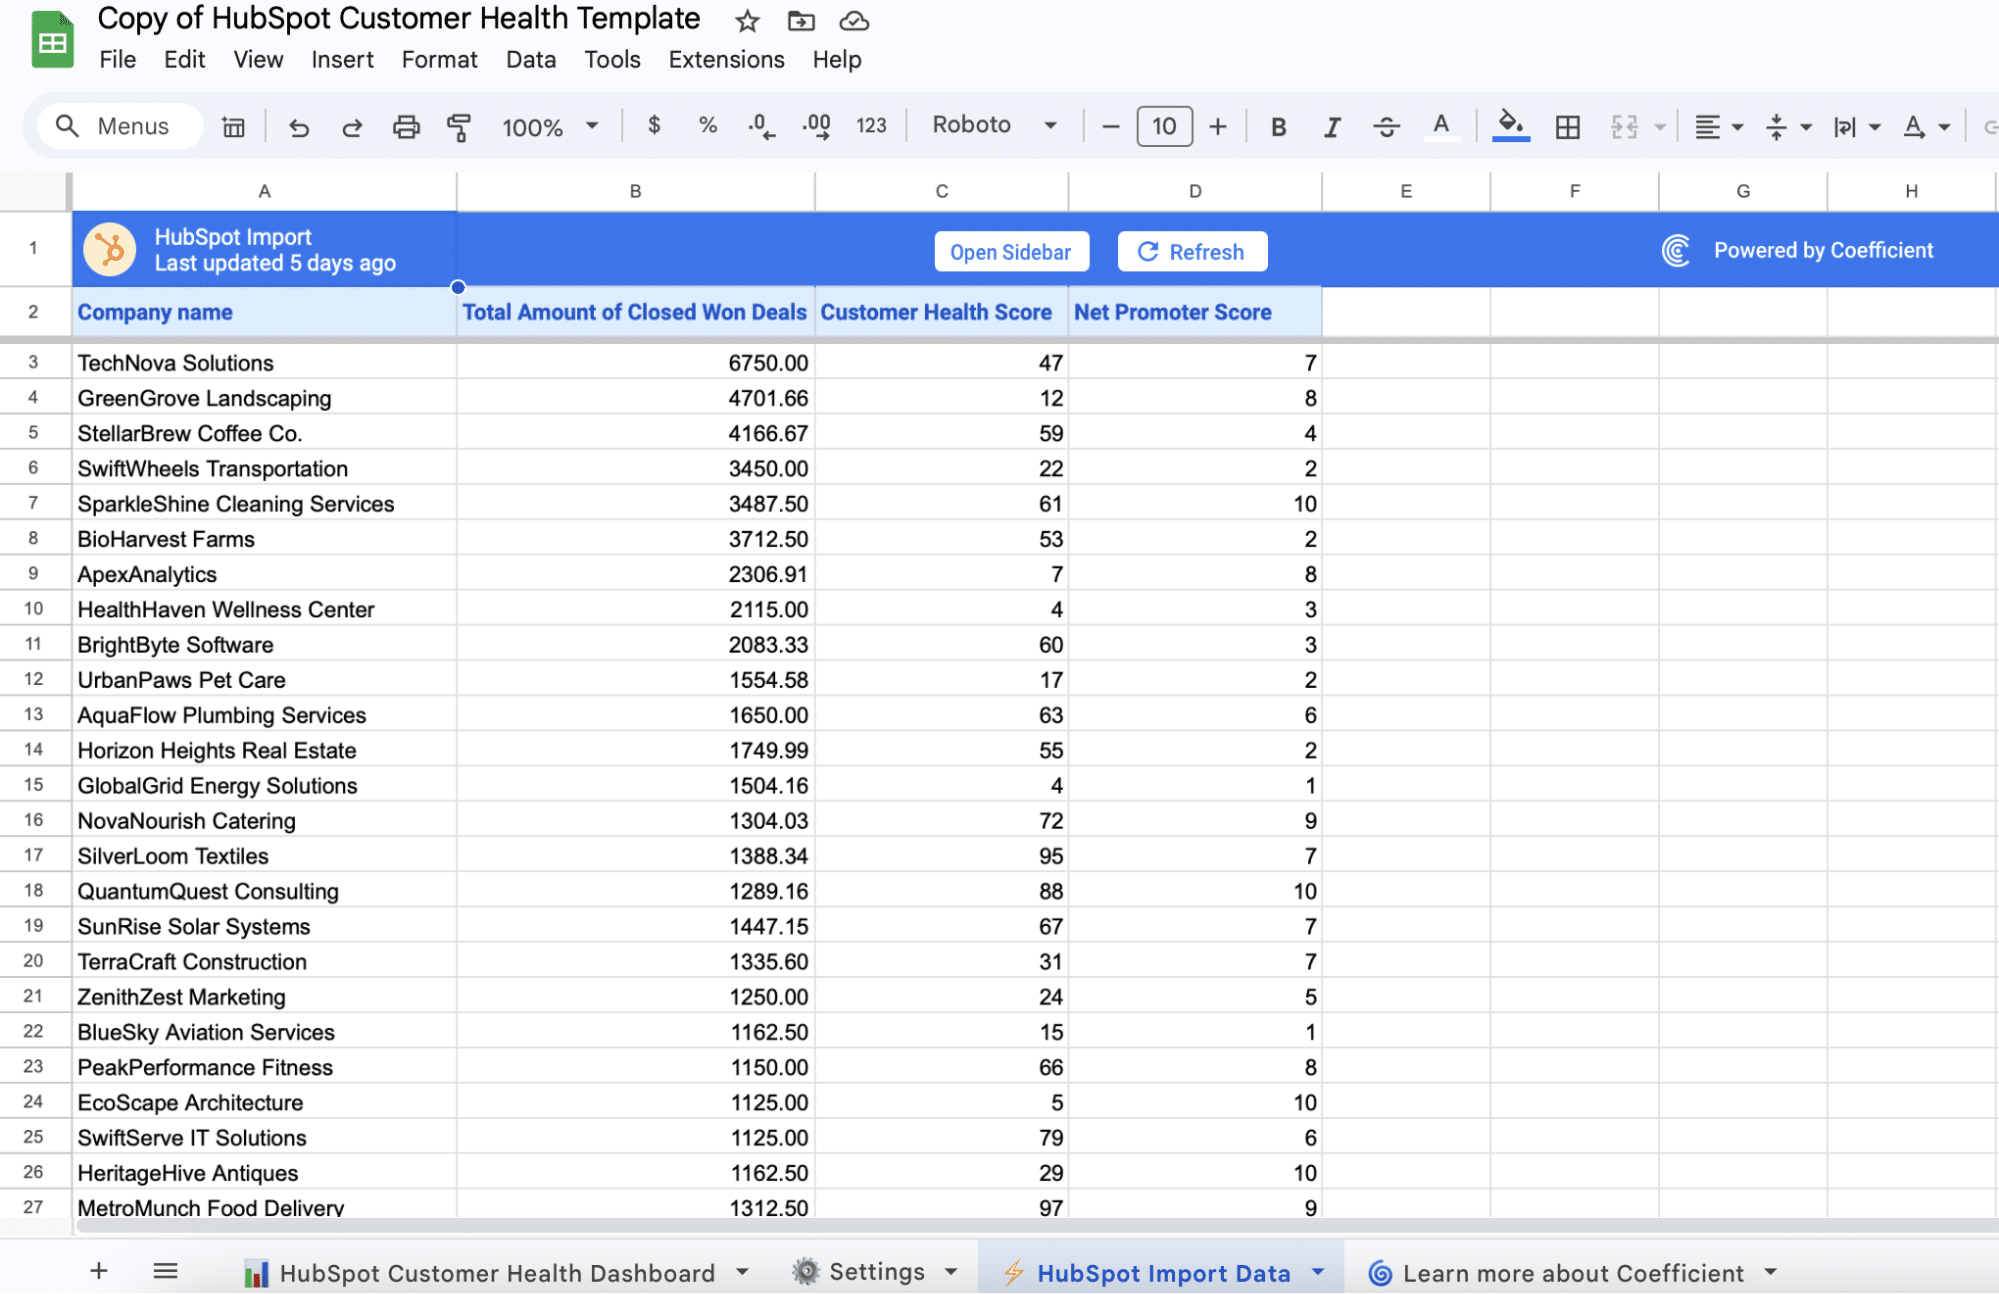
You can also auto-refresh your data by clicking ‘Set Refresh Schedule.’
Set up an hourly, daily, or weekly auto-refresh schedule, and Coefficient will automatically update your data based on that time interval.
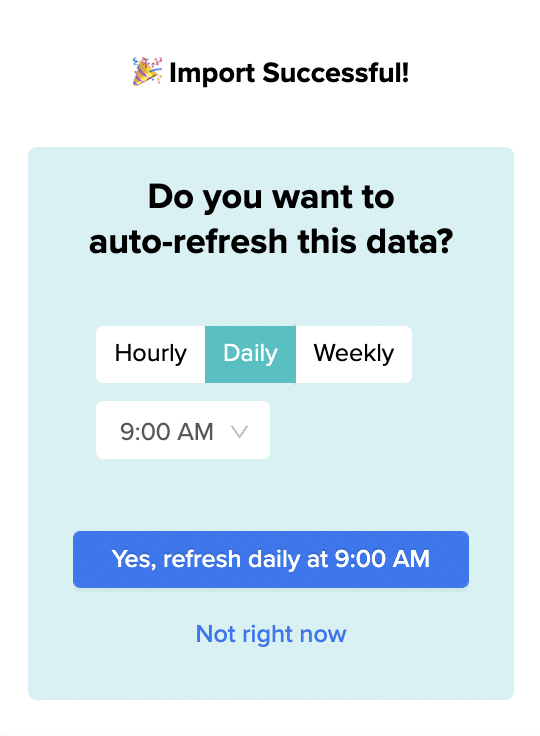
Set up an hourly, daily, or weekly auto-refresh schedule, and Coefficient will automatically update your data based on that time interval.
Step 3. Customize Your Dashboard
Tailor the Customer Health Score Dashboard to your organization’s unique needs by navigating to the ‘Settings’ tab.
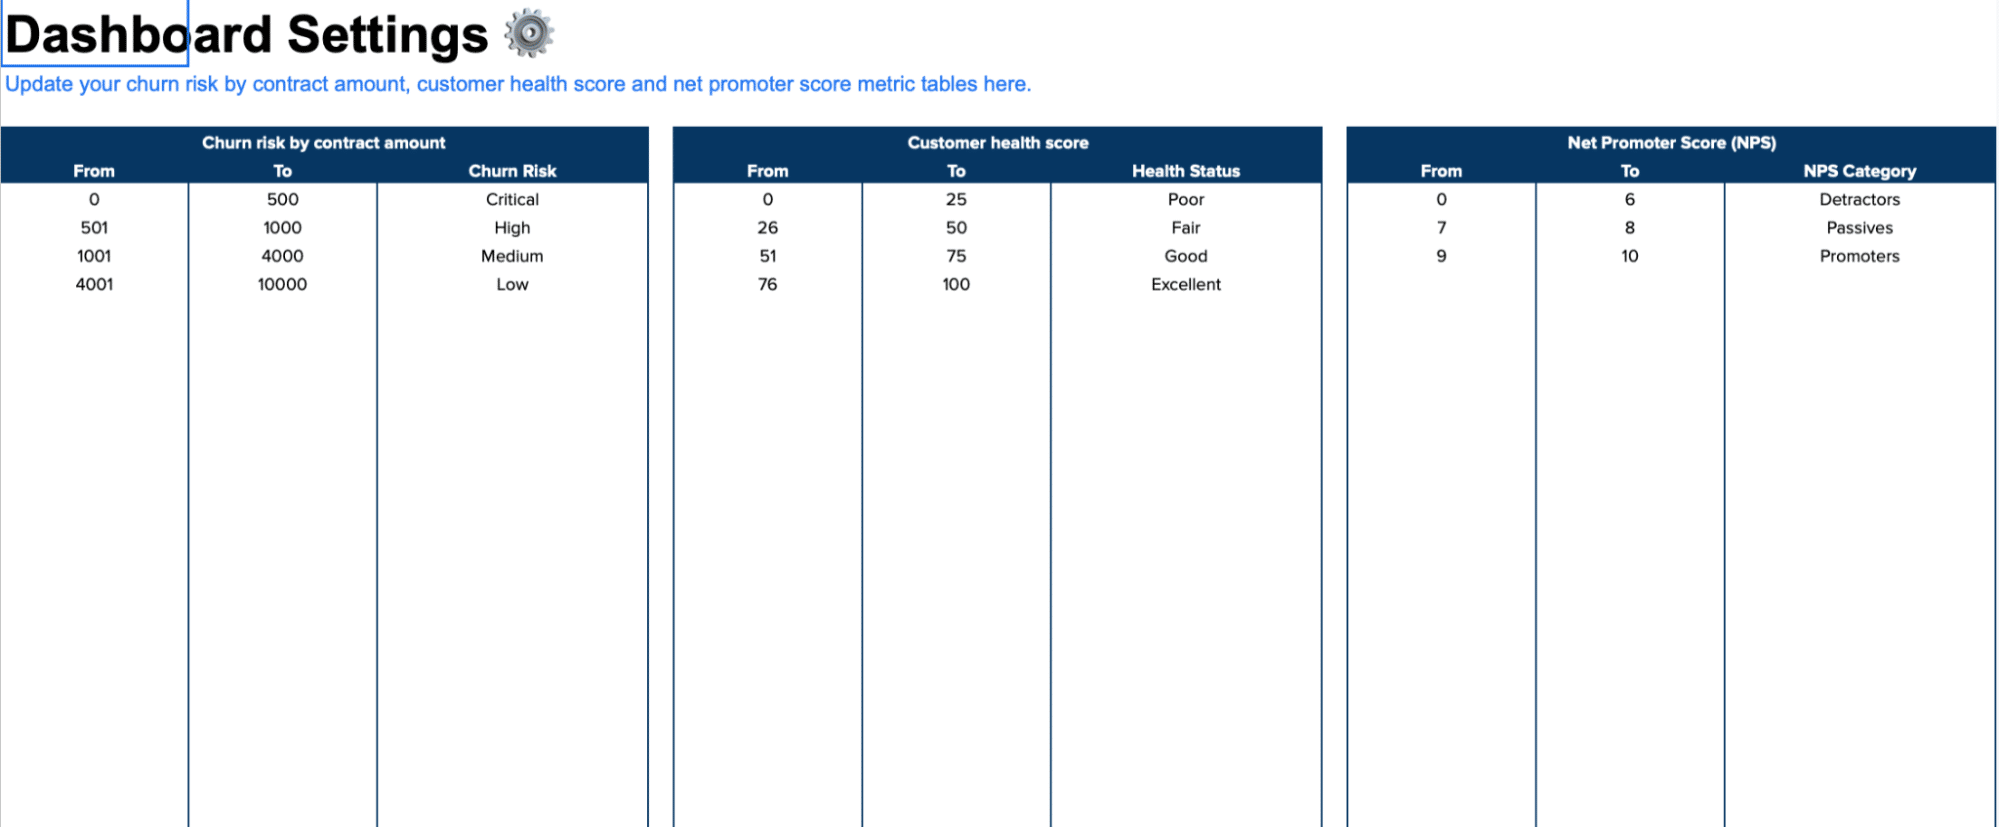
Here, you can customize various aspects of the dashboard to ensure it aligns perfectly with your business:
- Churn Risk by Contract Amount: Define the contract value ranges and their corresponding churn risk levels. This allows you to quickly identify the potential revenue impact of at-risk customers based on their contract size.
- Customer Health Score: Customize the health score ranges and labels to match your company’s specific criteria for assessing customer health. This ensures that the dashboard’s insights are tailored to your unique definition of a healthy, at-risk, or churned customer.
- Promoter Score: Adjust the NPS (Net Promoter Score) ranges and labels to align with your organization’s NPS benchmarks. This helps you quickly gauge customer satisfaction and loyalty based on your industry’s standards.
With just a few simple customizations, you can transform the Customer Health Score Dashboard into a powerful tool tailored to your organization’s specific needs.
https://coefficient.io/dashboard-examples/customer-health-dashboard

Stop exporting data manually. Sync data from your business systems into Google Sheets or Excel with Coefficient and set it on a refresh schedule.
Get Started
Deep Dive into the Customer Health Score Dashboard Template
provides a comprehensive view of your win rate performance. Key visualizations include:
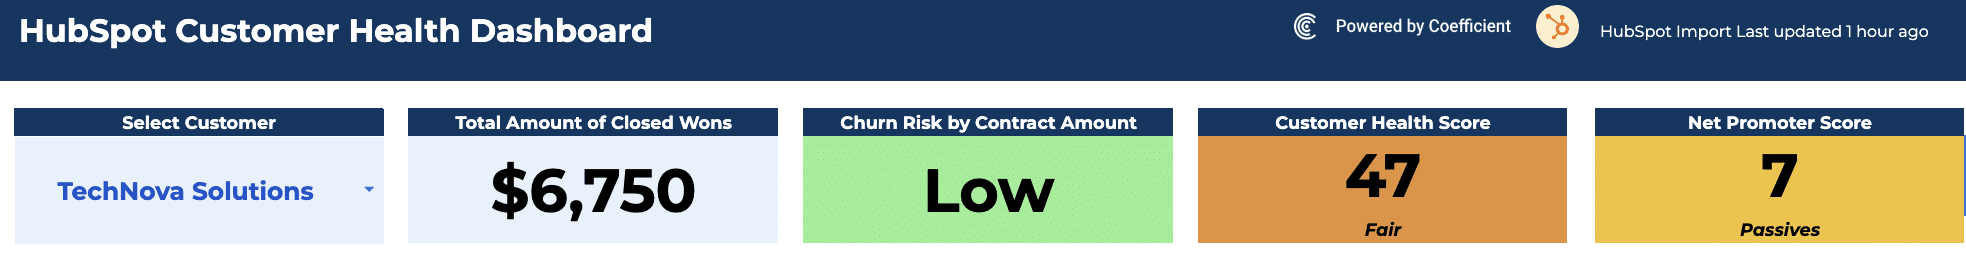
The dashboard provides a high-level view of selected customers, displaying key metrics such as the total amount of closed-won deals, churn risk by contract amount, customer health score, and net promoter score.
This overview allows you to quickly gauge the overall health and value of your customer base.
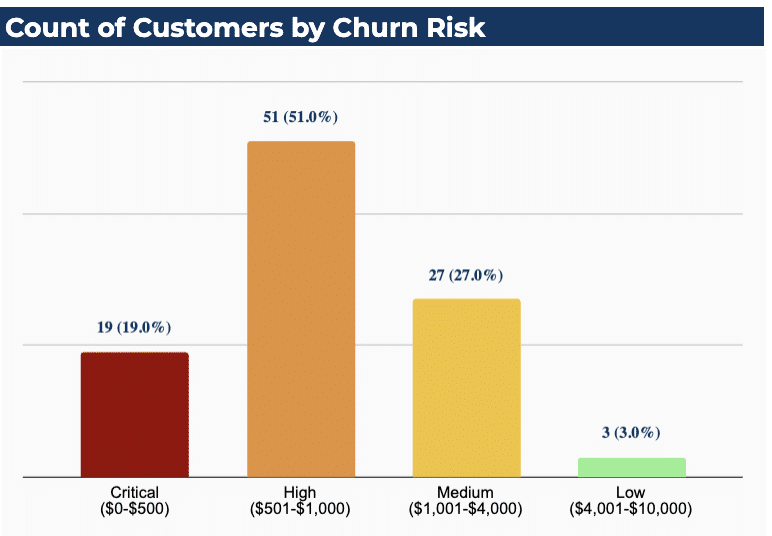
The Count of Customers by Churn Risk chart categorizes customers into critical, high, medium, and low churn risk levels.
This visualization helps you understand the distribution of your customer base across different risk categories, enabling you to prioritize retention efforts.
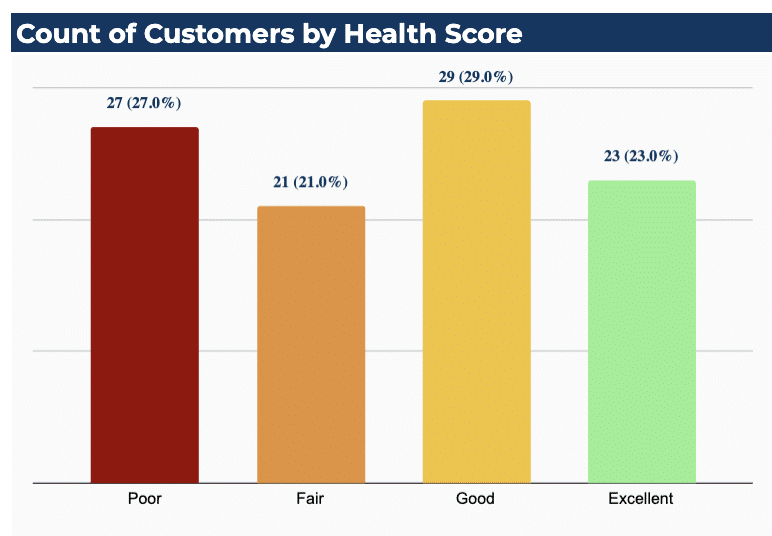
The Count of Customers by Health Score chart segments customers into poor, fair, good, and excellent health score ranges.
This breakdown provides a clear picture of the overall health status of your customer base, allowing you to identify patterns and trends in customer success.
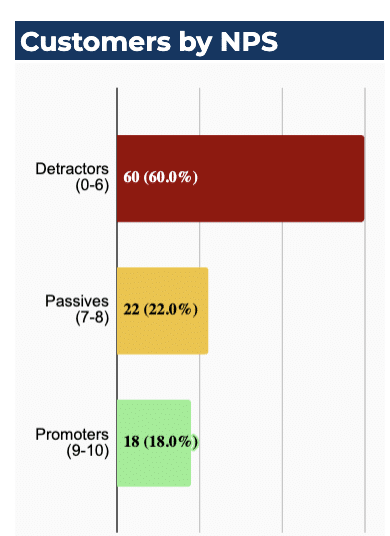
The Customer NPS chart displays the percentage of customers classified as detractors, passives, and promoters based on their Net Promoter Score (NPS).
This chart offers insights into customer loyalty and satisfaction levels, helping you gauge the likelihood of customer referrals and advocacy.
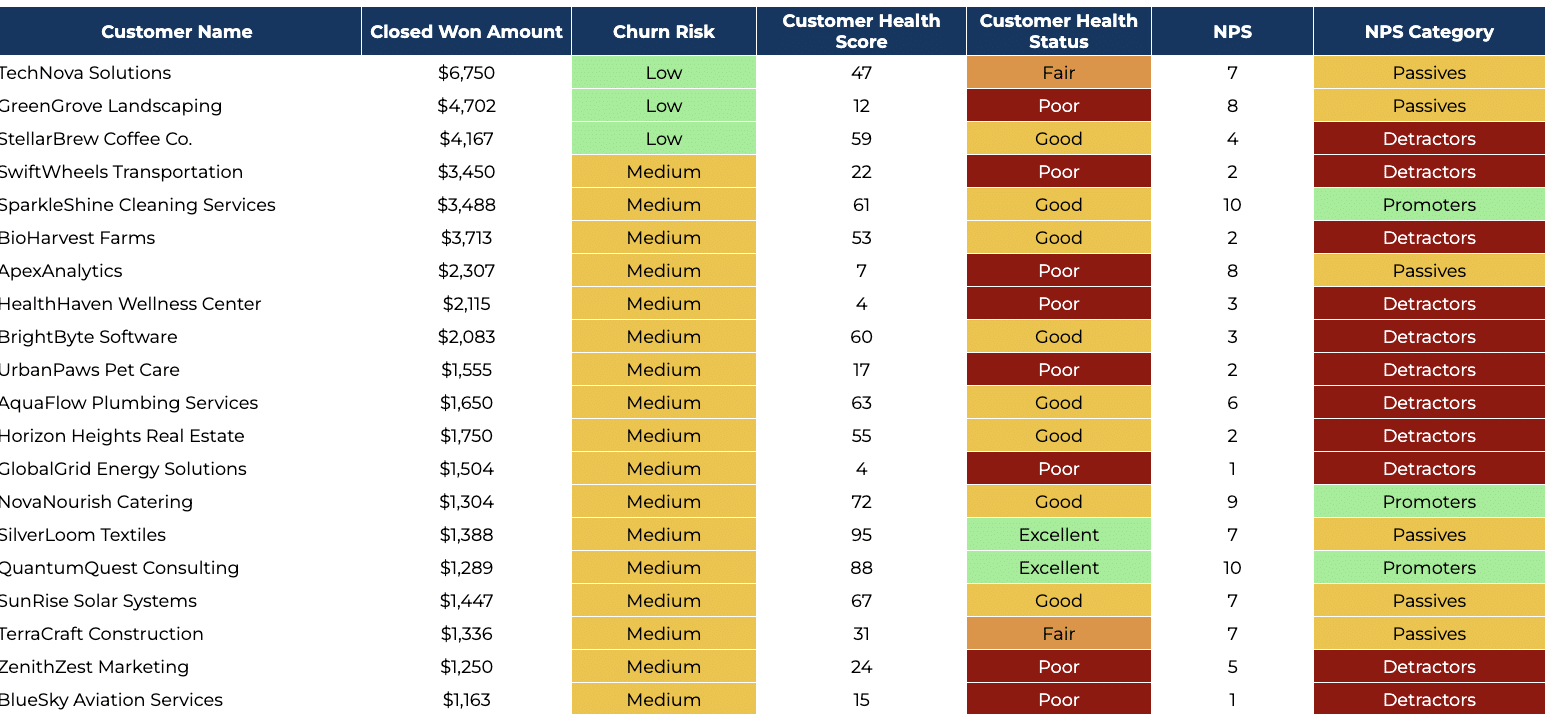
The customer table presents a comprehensive view of individual customers, including their name, closed-won amount, churn risk, customer health score, health status, NPS, and NPS category.
This detailed information allows you to analyze customer-specific data, identify trends, and make data-driven decisions to optimize your customer success strategies.
How to Action Insights into Your Customer Health Score
By leveraging the insights from Coefficient’s Customer Health Score Dashboard, you can take proactive steps to improve customer relationships and drive business growth:
- Proactively Engage At-Risk Customers: Identify customers with high churn risk or low health scores and prioritize outreach efforts. Develop targeted engagement strategies to address their specific needs, concerns, or pain points, demonstrating your commitment to their success.
- Optimize Onboarding and Training: Analyze trends in customer health scores to identify areas for improvement in your onboarding and training processes. Refine these processes to ensure customers are set up for success from the start, reducing the likelihood of churn and increasing their lifetime value.
- Personalize Customer Success Strategies: Use insights from the dashboard to develop personalized success strategies for each customer segment or tier. Tailor your approach based on factors such as contract value, health score, or NPS, ensuring that your efforts are aligned with the unique needs and expectations of each group.
- Identify Upsell and Cross-Sell Opportunities: Leverage customer health scores and NPS data to identify customers who are primed for expansion. Develop targeted upsell and cross-sell campaigns that demonstrate the value of additional products or services, helping you grow revenue within your existing customer base.
- Continuously Monitor and Iterate: Regularly review your Customer Health Score Dashboard to stay attuned to changes in customer sentiment, behavior, or risk levels. Use these insights to continuously refine your customer success strategies, ensuring that you’re always one step ahead of potential challenges or opportunities.
By taking a data-driven approach to customer success, you can proactively manage churn risk, identify growth opportunities, and deliver exceptional experiences that keep your customers loyal and satisfied.
The Importance of Live Data
Coefficient’s Customer Health Score Dashboard harnesses the power of live data, enabling you to:
- Make decisions based on the most up-to-date information, ensuring your strategies are always relevant and effective
- Quickly identify and respond to changes in customer health, sentiment, or behavior
- Gain a comprehensive, real-time view of your customer base, empowering you to make informed decisions and drive meaningful results
With live data at your fingertips, you can stay agile, proactive, and responsive in the face of ever-changing customer needs and market conditions.
Elevate Your Customer Success Strategy with Insights from Coefficient’s Customer Health Score Dashboard
Embracing customer health scores as a key metric empowers Revenue Operations teams to proactively reduce churn, enhance sales, and build a stellar reputation.
With Coefficient’s dynamic, actionable dashboard templates, integrating this critical data into your decision-making process becomes effortless.
Download the Customer Health Score Dashboard Template or sign up for Coefficient to unlock the full potential of your data analysis capabilities today. Get Started.


