Ready to boost your content marketing in 2024? It all starts with understanding the right metrics. These content marketing metrics are your roadmap to success, highlighting what works and guiding your strategy towards better results.
Coefficient’s dashboard templates make it simple to track marketing metrics and data in your spreadsheet, offering quick insights to power smarter content strategies. This guide will walk you through the five essential content marketing metrics you need to follow in 2024, enhanced by the convenience of real-time data insights.
Want a quick video walkthrough instead? Analytics expert, Frank Ferris, has you covered.
Top 5 Content Marketing Metrics for 2024
Understanding the right content marketing metrics can transform how you approach marketing success in 2024. Here are the five essential metrics that should guide your content strategy.
Organic Rankings
Organic rankings refer to your content’s position on search engine results pages (SERPs) for relevant queries.
Key Benefits:
- Enhances Visibility: Higher organic rankings place your content at the forefront of search results, significantly increasing its visibility to potential visitors.
- Increases Credibility: Ranking at the top signals to users that search engines view your site as a credible and authoritative source on the topic.
- Drives Organic Traffic: Achieving a top position in search results typically results in higher click-through rates, funneling more organic traffic to your website.
How It’s Calculated:
Ranking=Position of content on SERP for targeted keywords
Achieve higher organic rankings by optimizing your content with targeted keywords, enhancing site speed, improving mobile-friendliness, and building quality backlinks. Consistency and quality in your SEO efforts are key to climbing higher on search results.
How Coefficient’s Organic Rank Tracker Dashboard Can Help:
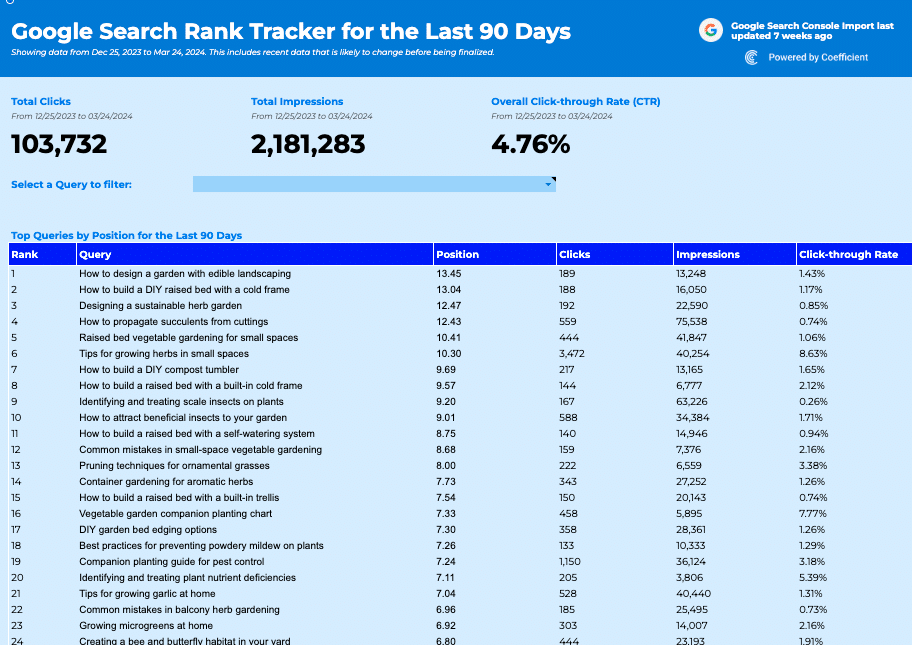
Use Coefficient’s Organic Rank Tracker to keep tabs on where your content stands on SERPs for essential keywords. This tool facilitates tracking ranking changes over time, allowing you to adapt and tweak your strategies for optimal positioning.
- Spot Trends Early: Keep an eye on ranking changes to quickly adapt your SEO strategy, staying ahead of the curve.
- Understand Market Dynamics: Glean insights into competitor movements and market shifts, fine-tuning your approach to stay competitive.
- Tailored Reporting: The Google Sheets Rank Tracker provides a customizable and collaborative platform, making SEO reporting and strategy development a breeze.
SEO Impressions
SEO impressions measure the number of times your content appears in search results.
Key Benefits:
- Measures Visibility Potential: SEO impressions provide a direct measure of how often your content is visible in search results, indicating potential reach.
- Identifies Opportunities for Optimization: Tracking impressions highlights which content is being recognized by search engines, guiding efforts to optimize for increased visibility.
- Supports Strategic Keyword Targeting: By understanding impression trends, you can refine your keyword strategy to focus on terms that maximize your content’s exposure in search results.
How It’s Calculated:
Impressions=Total number of times content appears in search results
To increase SEO impressions, focus on improving keyword optimization and ensuring your content is indexed correctly. Regularly update your content to keep it relevant and authoritative.
How Coefficient’s SEO Impression Dashboard Can help
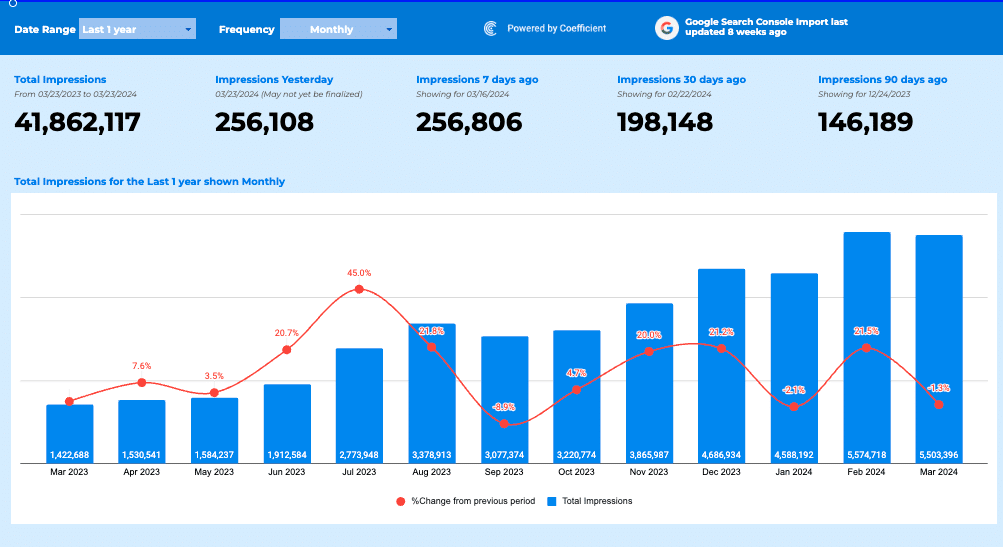
The SEO Impressions Dashboard enables you to monitor impressions for your content, giving you insights into how often your pages are being seen in search results. With this data, you can refine your SEO strategy for better visibility.
- Boost Online Presence: Track how often your site appears in search results to increase your visibility and reach.
- Strategic Content Planning: Use impression data to influence your content creation, focusing on what earns the most visibility.
- Easy Data Analysis: With Coefficient’s SEO Impressions Tracker, aggregating and analyzing your data is straightforward, allowing for informed, swift strategy adjustments.
Organic Click-Through Rates (CTR)
CTR tells you if your content gets noticed. It measures how often people decide to click on your content after seeing it. A higher CTR means your content is hitting the mark with your audience.
Key Benefits:
- Boost Engagement: Higher CTR means content resonates more with your audience.
- Drive Qualified Traffic: Users who click are more likely to be interested in your offering.
- Optimize Content Strategy: CTR insights help refine headlines and meta descriptions for better results.
[Image of the template Placeholder]
How It’s Calculated:
CTR=(Total Clicks/Total Impressions)×100
- Total Clicks: This is the number of times people have clicked on your content from a search engine results page.
- Total Impressions: This refers to how many times your content was displayed in search results, regardless of whether it was clicked or not.
Enhance your CTR by refining your titles and meta descriptions based on what historically performs well. Consistent monitoring and adjustment based on data are key to increasing appeal to your target audience.
How Coefficient’s Organic CTR Dashboard Can Help:
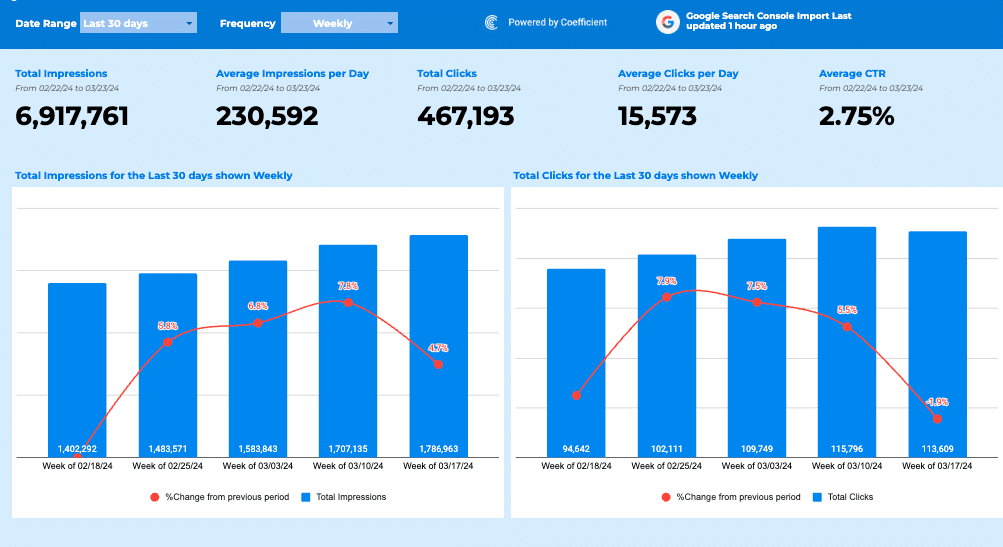
With Coefficient’s Organic CTR template, tracking and analyzing CTR across various campaigns becomes hassle-free, enabling real-time improvements and A/B testing conclusions.
- Maximize Visibility: Discover what makes your audience click and increase the chances of your content being seen and interacted with.
- Refine Content Strategy: Use CTR data to adjust your headlines, descriptions, and content to better match what your audience is searching for.
- Simple Collaboration: Coefficient’s Organic CTR Tracker makes sharing insights easy, enabling your team to make informed decisions together.
Website Channel Traffic & Breakdowns
Knowing where your website visitors come from helps you understand which channels—like social media or search engines—are working best.
Key benefits:
- Identify Top Channels: Pinpoint which sources contribute most to your traffic.
- Allocate Resources Wisely: Focus efforts on channels with the highest ROI.
- Tailor Engagement Strategies: Customize content and campaigns according to channel performance.
[Image of the template Placeholder]

Stop exporting data manually. Sync data from your business systems into Google Sheets or Excel with Coefficient and set it on a refresh schedule.
Get Started
How It’s Calculated:
Analytics platforms segment traffic by source, using URLs and tracking parameters to categorize visits (e.g., Direct, Organic Search, Referrals).
To improve traffic, Use analytics to pinpoint high-performing channels and allocate resources accordingly. Tailoring your content and marketing efforts based on channel performance can significantly enhance visitor engagement and conversion rates.
How Coefficient’s GA4 Website Performance Dashboard Can Help:
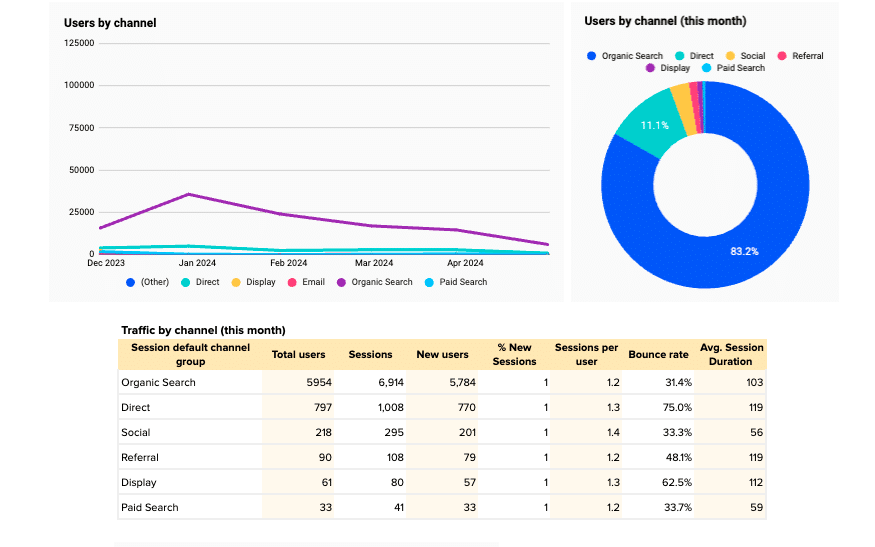
Coefficient’s Google Analytics Website Performance Report gives you a comprehensive view of your site’s traffic and user engagement.
- Real-Time Performance Tracking: Stay updated with how different channels contribute to your site’s traffic for timely strategy adjustments.
- Understand User Behavior: Gain insights into your audience’s preferences and behavior, helping you create more targeted and effective content.
- Effortless Data Extraction: With everything in one place, pull comprehensive reports easily, understanding your traffic and engagement at a glance.
Top Landing Pages
This metric lets you see which of your pages are most popular. It’s a clear indicator of what interests your audience.
Key benefits:
- Highlight Content Preferences: Understand what content draws in your audience the most.
- Maximize Conversions: Leverage high-traffic pages for better conversion strategies.
- Inform Content Creation: Use insights to guide the development of new, compelling content.
How It’s Calculated:
Measured by tracking the number of visits to specific pages, often identified through web analytics tools which attribute page views to individual URLs.
How Coefficient’s GA4 Website Performance Dashboard Can Help:
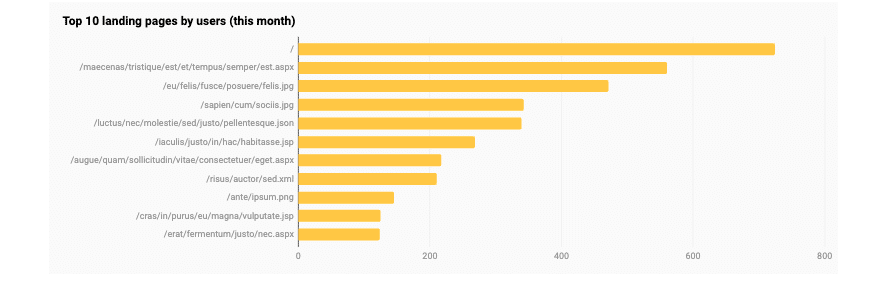
Coefficient’s Google Analytics Website Performance Report template not only tracks website channel traffic but also provides detailed insights into the performance of individual landing pages. This makes it easier to focus efforts where they count most.
- Highlight Engaging Content: Easily identify what captivates your audience, directing your content strategy to replicate successful topics and formats.
- Optimize for Conversions: Understand which pages are conversion goldmines, focusing optimization efforts where they count.
- Audience Behavior Insights: Delve into how users interact with your site, allowing for refined engagement strategies and content creation.
Advantages of Integrating Live Data into a Unified Dashboard
Integrating live data into a unified dashboard transforms marketing analytics with solid, tangible benefits:
- Real-Time Data for Swift Campaign Adjustments: Enables immediate access to the freshest data, critical for swiftly tweaking campaigns in response to the latest trends and customer behaviors.
- Centralized Insights & Time Savings: Consolidates data from various sources for a holistic view, significantly reducing time spent on analysis and strategy adjustments, and thereby increasing overall productivity.
- Enhanced Collaboration with Custom Reporting: Improves team collaboration through shared, live data access and allows for the creation of detailed, custom reports tailored to specific strategy needs and stakeholder communication.
Success Stories: How Mutiny’s Marketing Operations Team Uses Coefficient.
Mutiny leverages Coefficient to aggregate data from multiple marketing platforms into Google Sheets, dramatically enhancing their marketing strategy’s effectiveness and efficiency. This approach provides a comprehensive view of campaign performances and spending effectiveness, supporting swift, strategic adjustments.
The result? Live, accurate data Mutiny can trust to power reporting and hours saved with automated imports.
“Coefficient gives me peace of mind. It allows us to confidently report across the org from BizOps to Finance, Revenue, and our C-Suite, said Brian Chalif, Head of BizOps at Mutiny.
Let Coefficient redefine your marketing data analysis process. Explore our (free) suite of templates and sign up to embark on a journey towards streamlined, data-driven marketing insights.

