
Webflow is a leading website design and development platform that enables businesses to create visually appealing and fully functional websites without coding.
By connecting Webflow to Excel using Coefficient, you can seamlessly import your website data into a spreadsheet for in-depth analysis, content management, and reporting.
This tutorial will walk you through the steps of setting up the integration and fetching your Webflow data into Excel.
Prefer video? Watch the tutorial here!
Advantages of Using Excel to Analyze Webflow Data
- Familiar interface: Excel provides a well-known interface for data analysis, making it easy for users to navigate and work with Webflow data.
- Powerful analysis tools: Excel offers a wide range of built-in functions, formulas, and pivot tables to help you analyze and visualize your website data.
- Flexible reporting: Create custom website performance reports and content management dashboards in Excel to share insights with stakeholders and make data-driven decisions.
How to Install Coefficient in Excel
Before we get started, you’ll need to install Coefficient in Excel. Don’t worry, it’s a quick and easy process that you only need to complete once. Follow these simple steps to get started:
Open Excel from your desktop or in Office Online.
Click ‘File’ > ‘Get Add-ins’ > ‘More Add-Ins.’
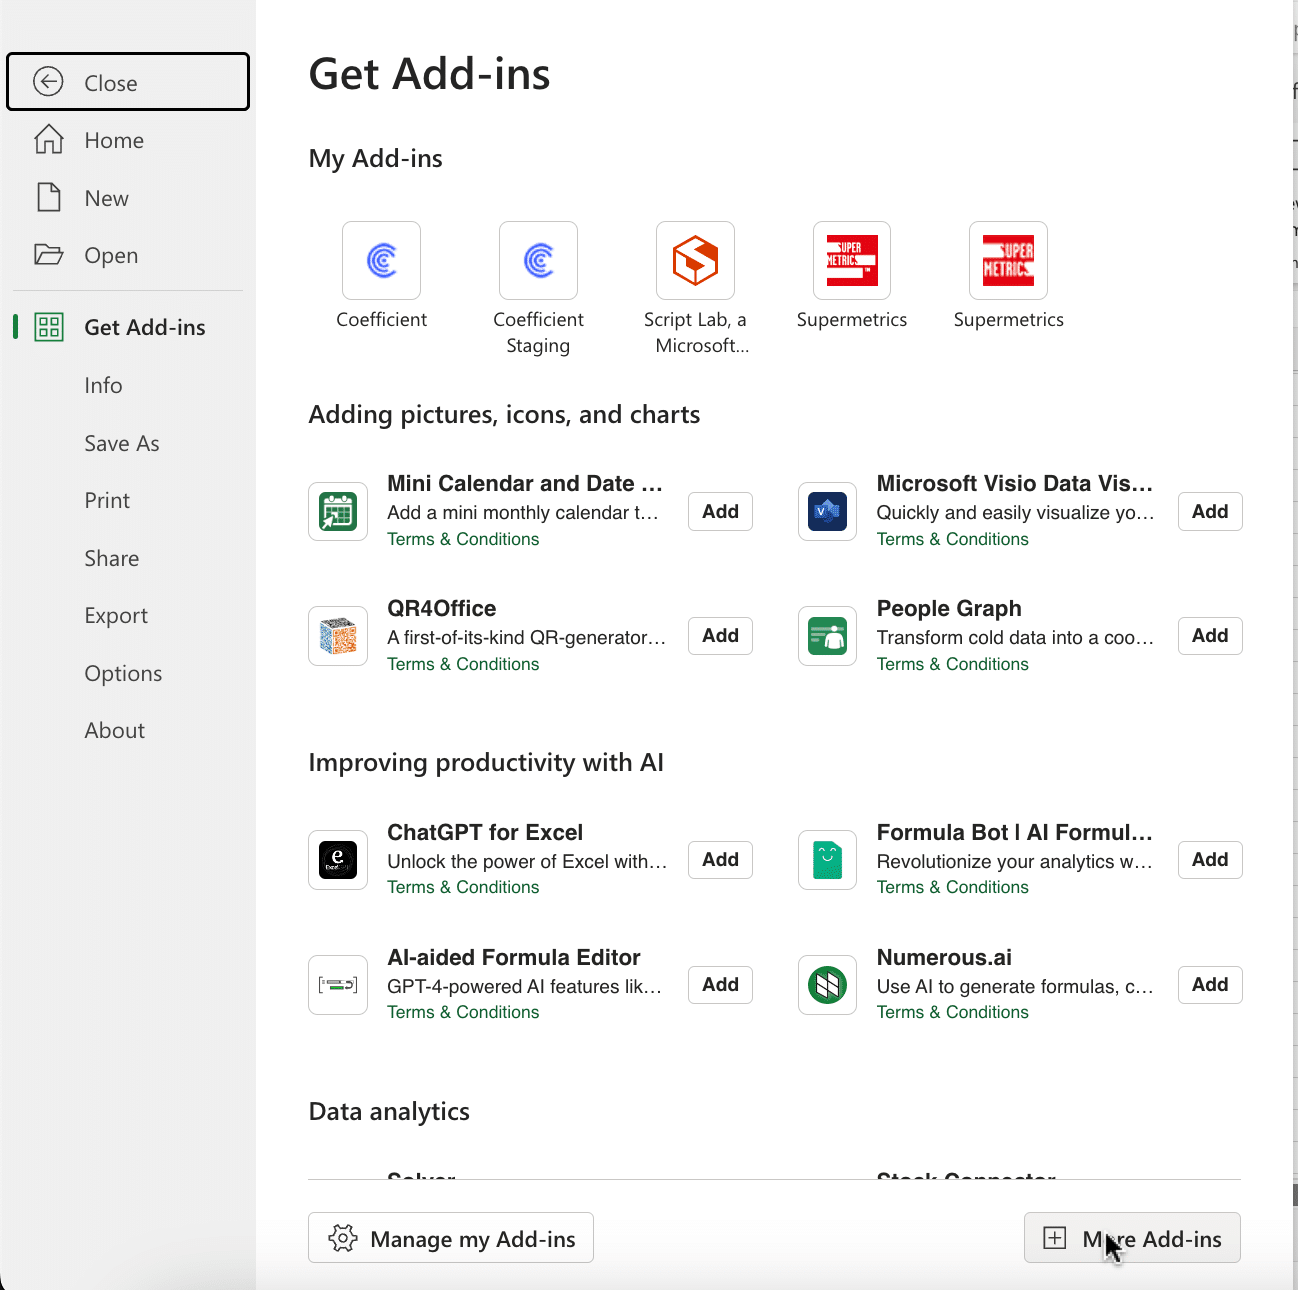
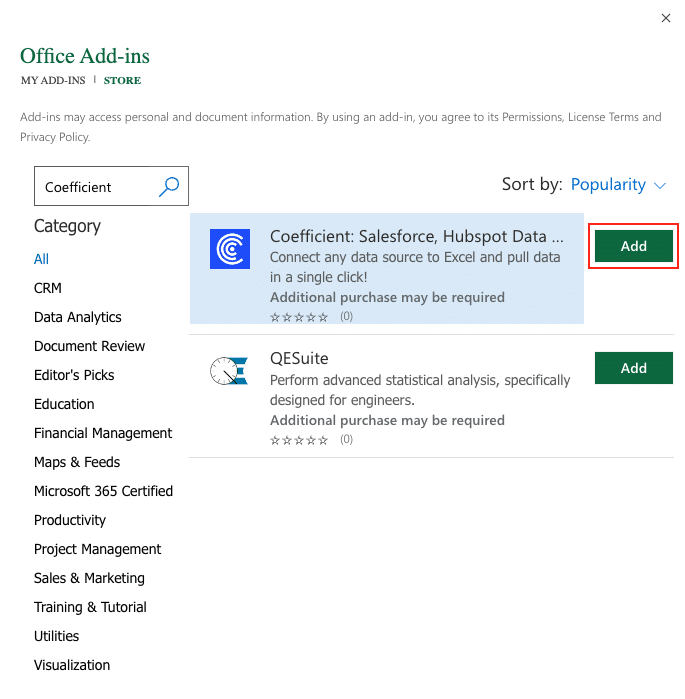
Type ‘Coefficient’ in the search bar and click ‘Add.’
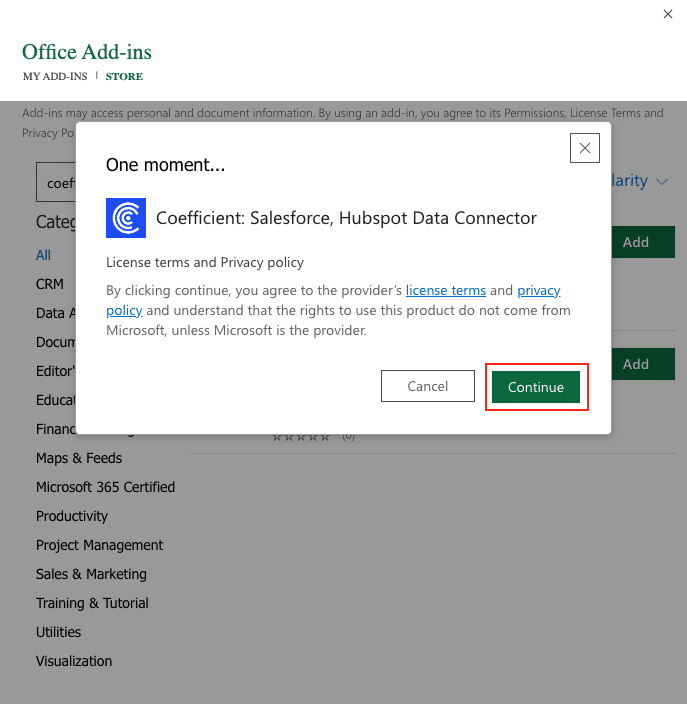
A pop-up will open up. Follow the prompts to complete the installation.
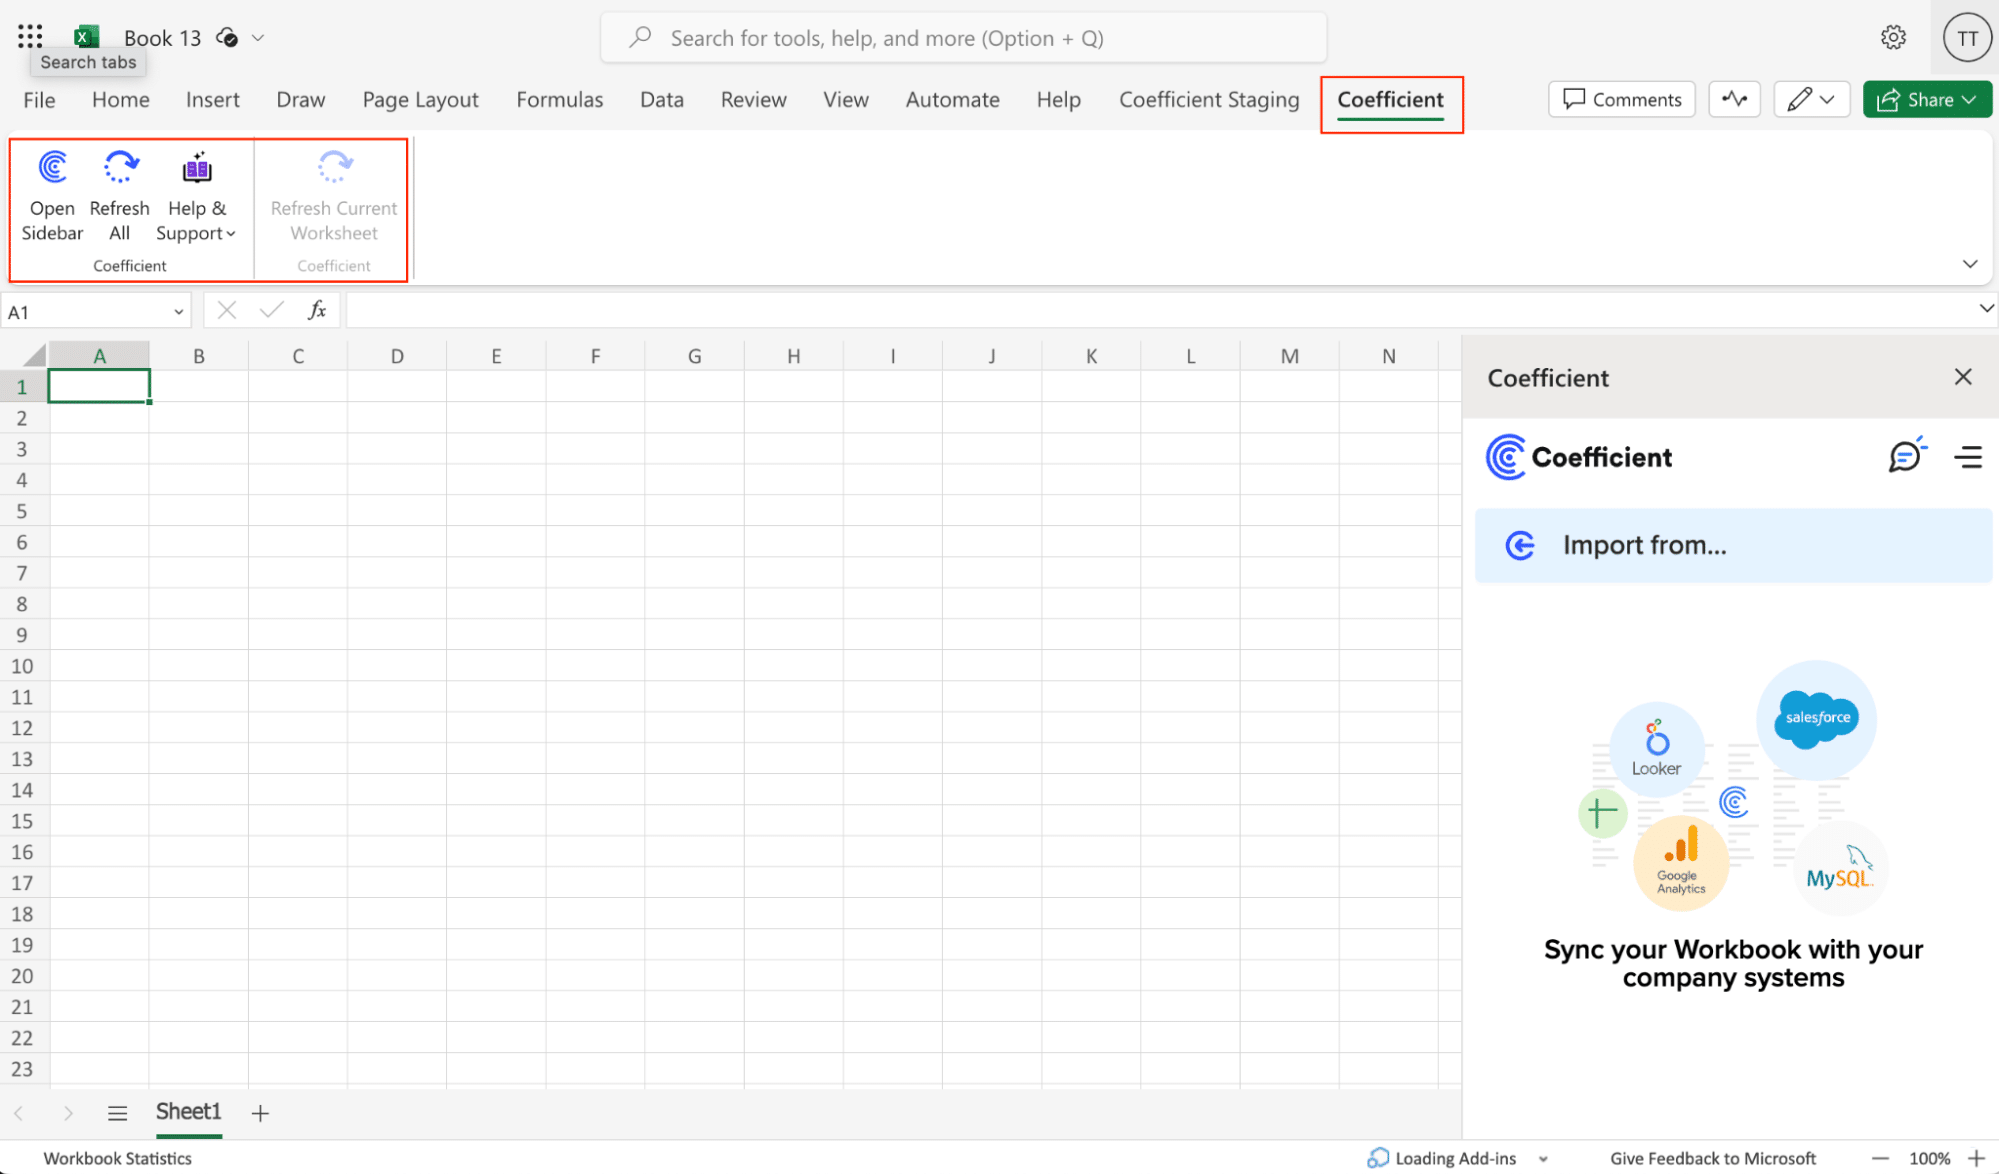
Once finished, you will see a ‘Coefficient’ tab at the top navigation bar.
Click ‘Open Sidebar’ to launch Coefficient.
Step-by-Step Tutorial: Connecting Webflow to Excel Using Coefficient
With Coefficient installed, you’re now ready to import your Webflow data into Excel. Let’s walk through the process step by step:
Step 1: Open Coefficient and add Webflow as a data source
In the Coefficient sidebar, select “Import From.” Next to “Connected Sources”, click the blue “+” button.
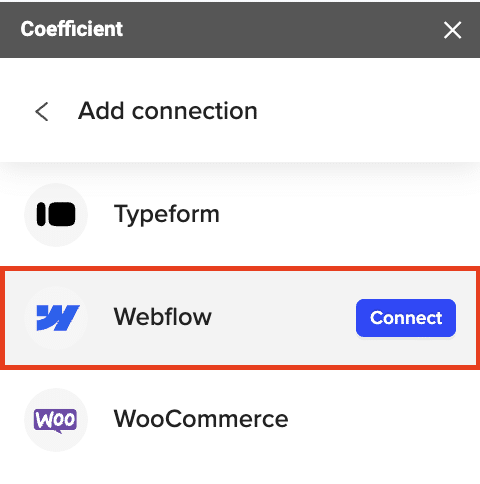
Scroll through the list of available data sources and select “Webflow.”
Step 2: Authorize Coefficient to access your Webflow account
Follow the prompts to initiate the authorization process.

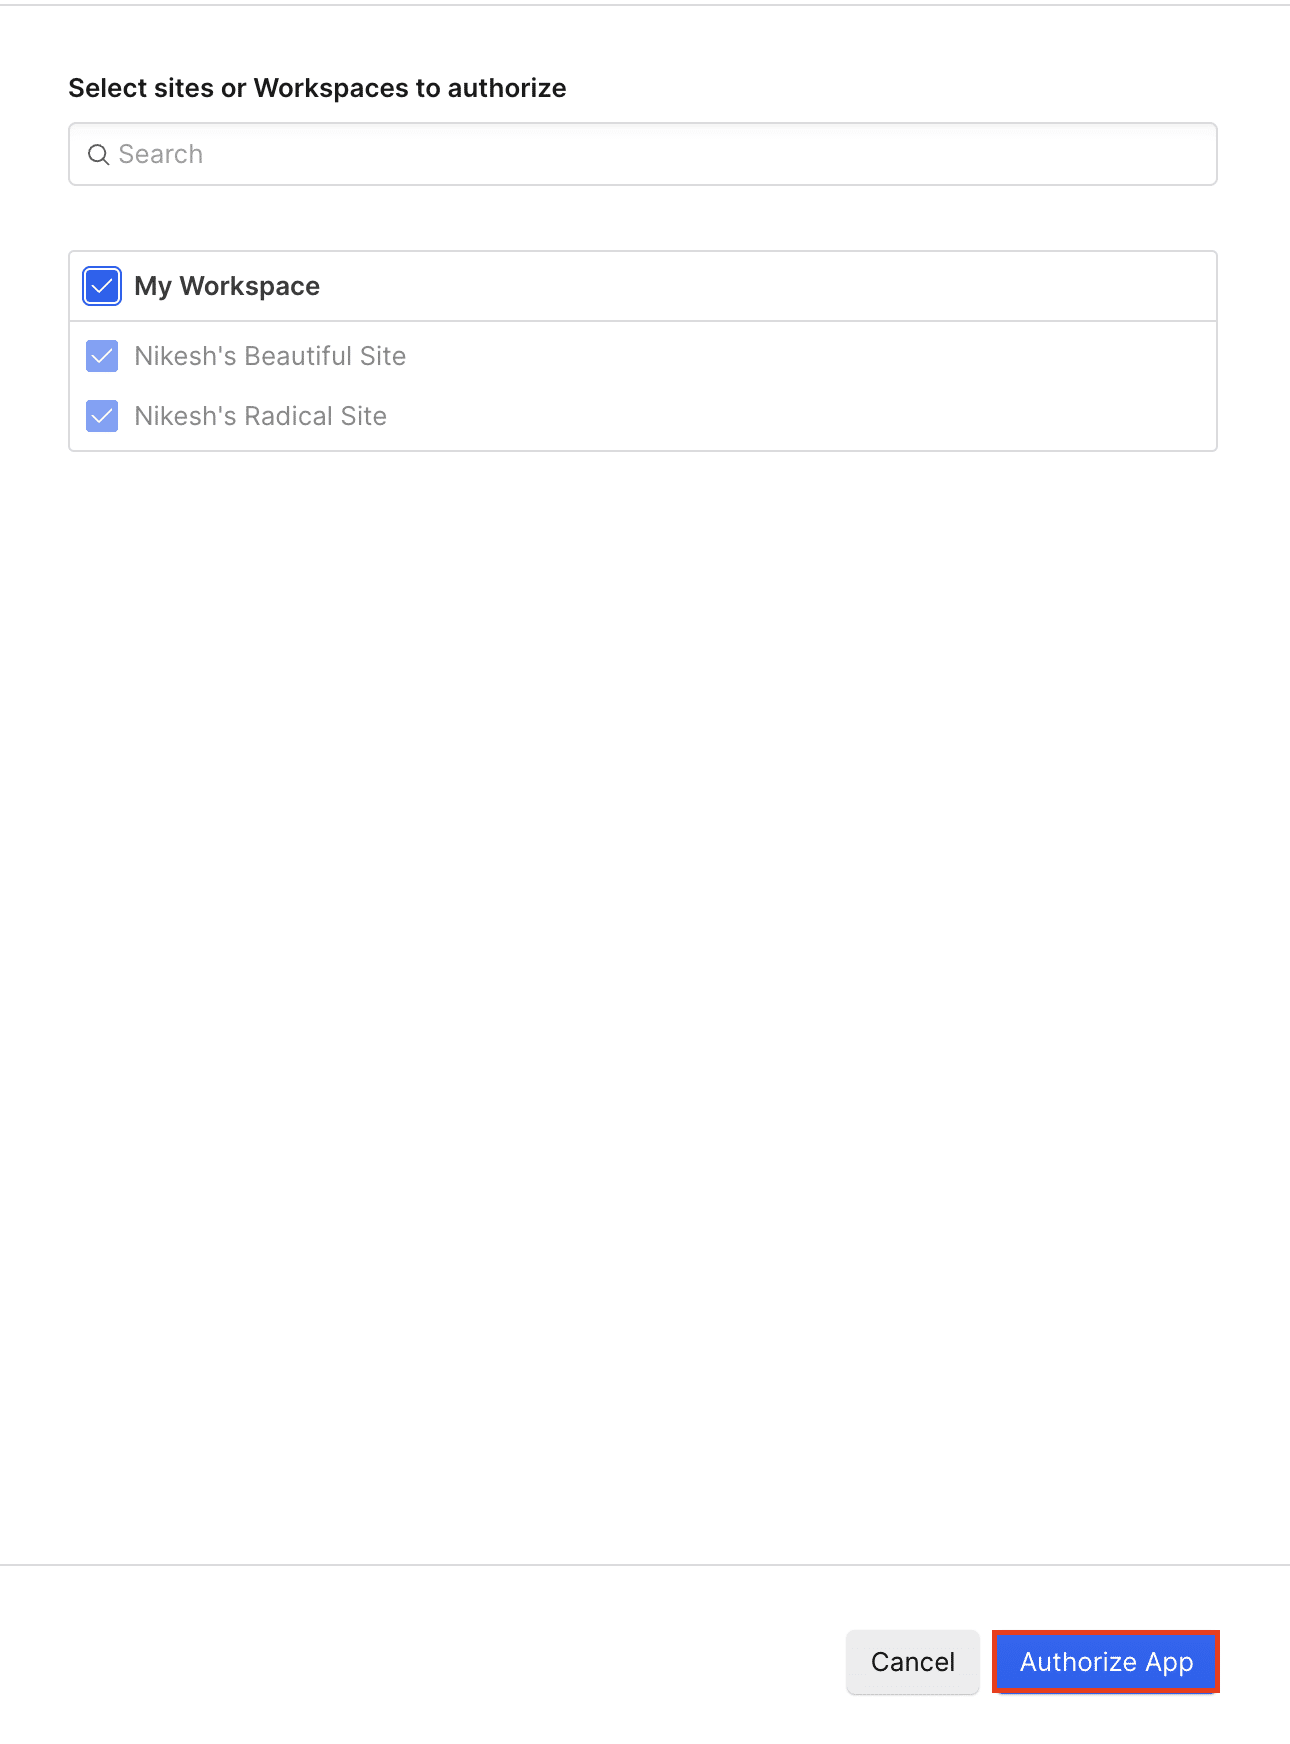
In the new tab that opens, select the sites or workspaces you want to authorize by checking the corresponding boxes.
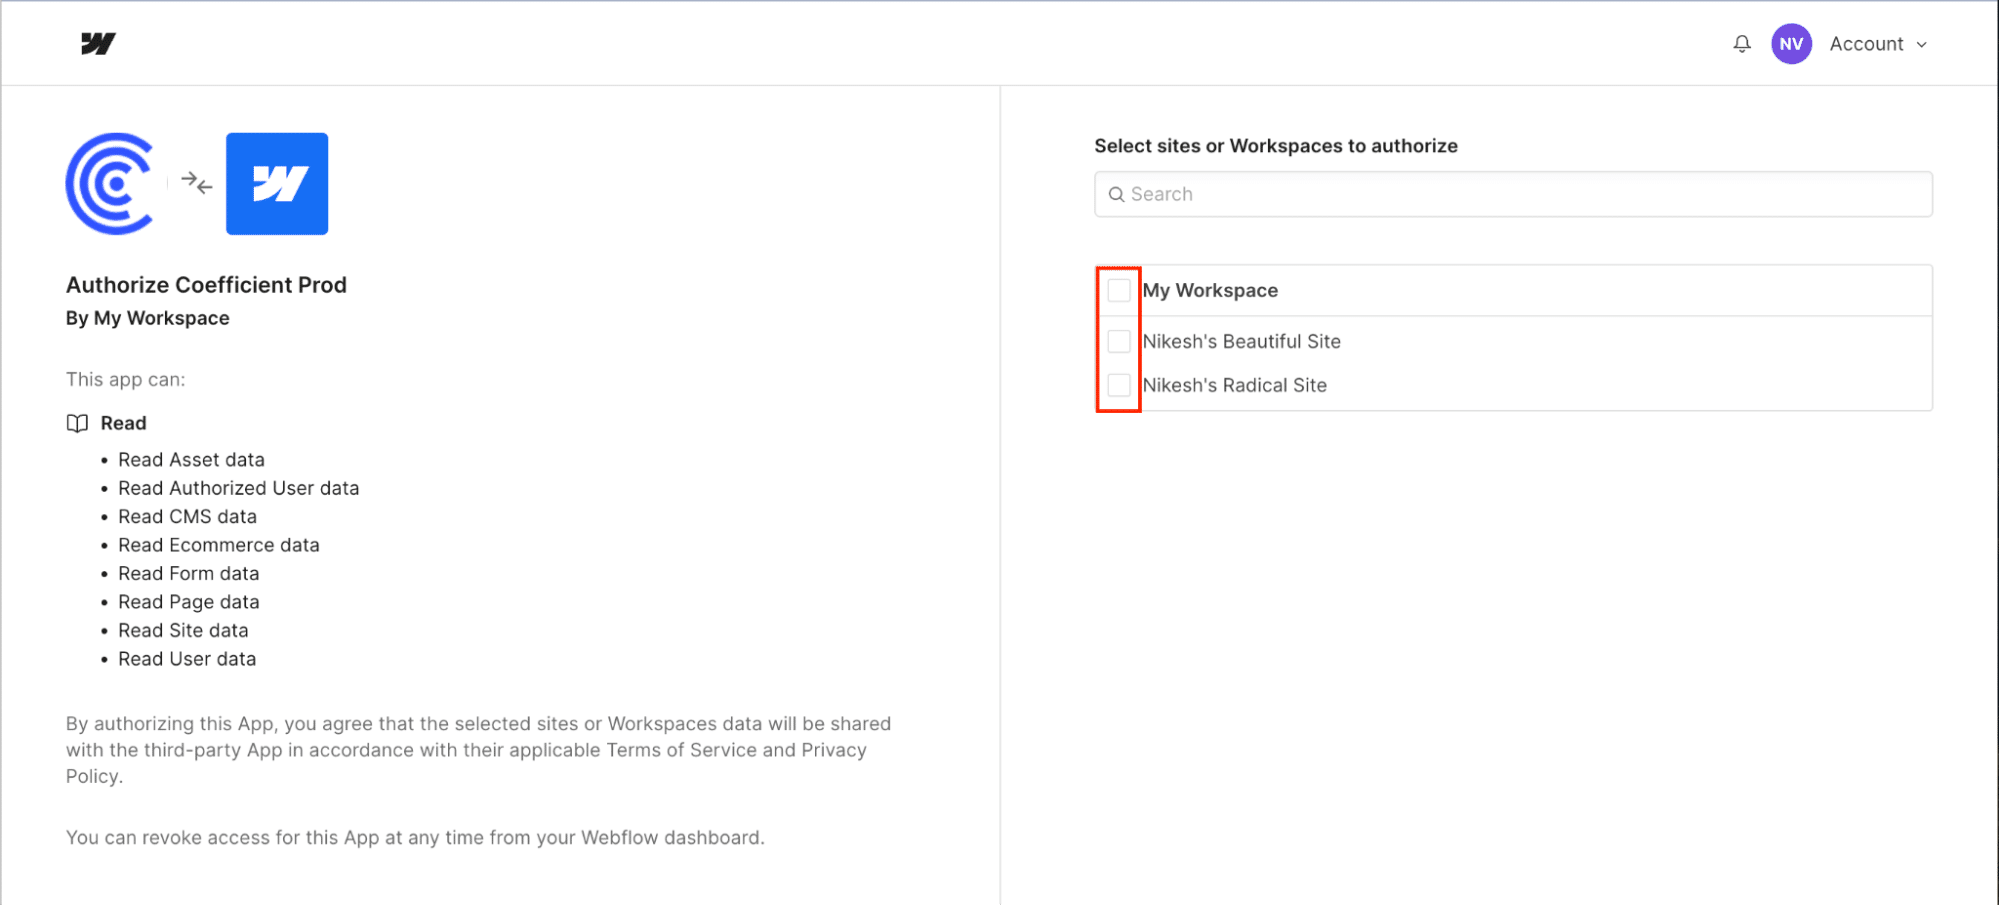
Click “Authorize App” in the bottom right corner to grant Coefficient access to your selected Webflow sites and workspaces.
Step 3: Choose an object or report to import
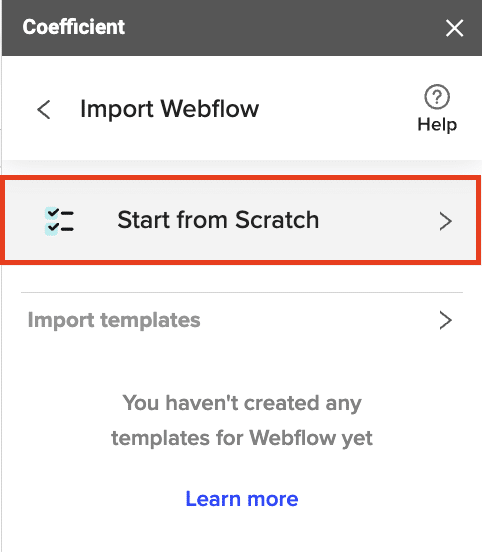
After authorizing the app, select “Start from scratch” to open the import preview.

Stop exporting data manually. Sync data from your business systems into Google Sheets or Excel with Coefficient and set it on a refresh schedule.

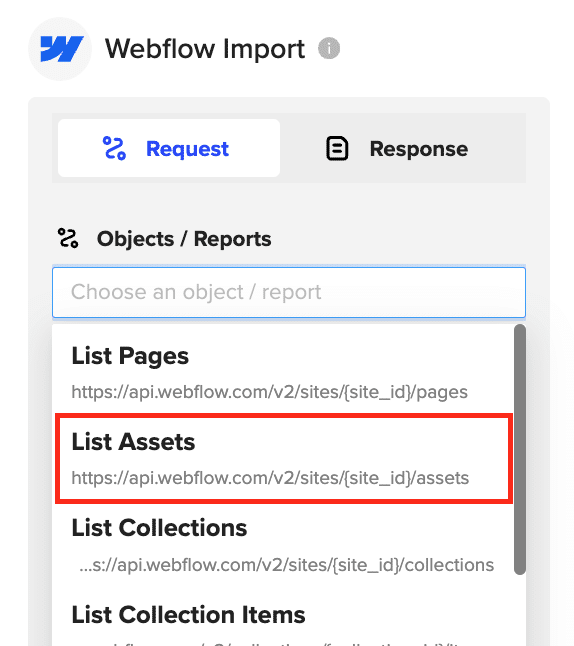
Explore the various objects and reports available for import, such as website data, marketing assets, orders, and more.
Step 4: Configure your import settings
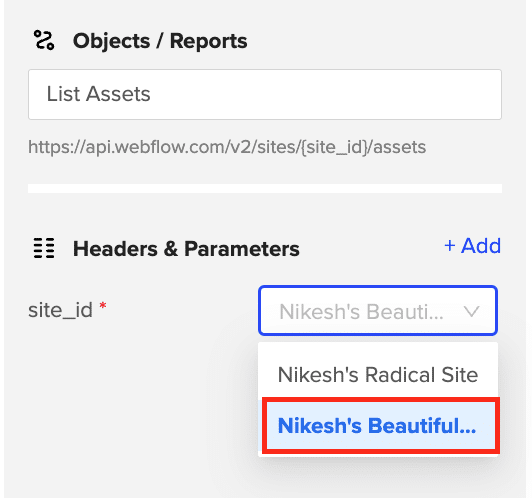
For this example, let’s select the “Assets” import.
Choose the desired site ID from the dropdown menu.
Click “Preview” to see the available data fields.
Step 5: Customize your data import
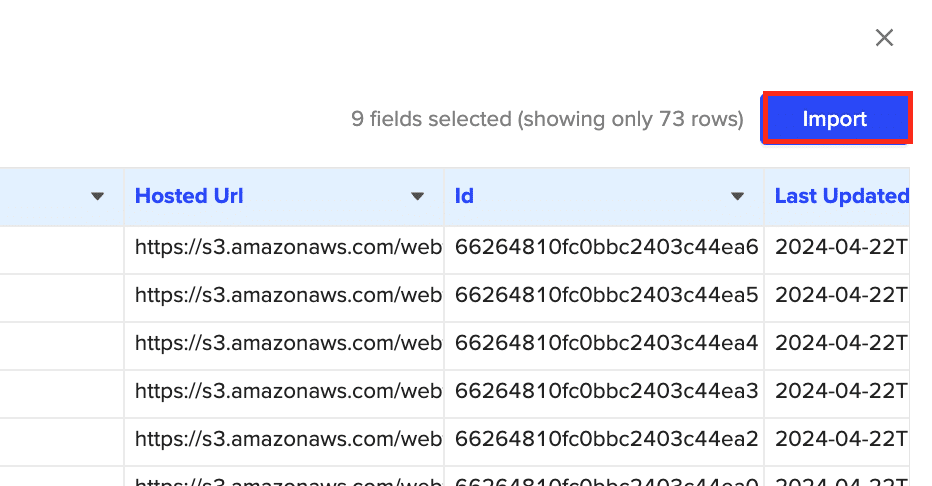
Select the specific data fields you want to include in your import by checking or unchecking the corresponding boxes.
Once you’re satisfied with your field selection and order, click “Import” to fetch the data into your Excel spreadsheet.
Step 6: Set up automatic data refreshes
To ensure your Webflow data stays up to date, set up a refresh schedule by selecting a frequency (e.g., daily at 9 AM) in the Coefficient sidebar.

With your data imported and the refresh schedule set, you’re now ready to explore the endless possibilities of analyzing and leveraging your Webflow data in Excel.
Use Cases for Analyzing Webflow Data in Excel
- Content Audit: Create a comprehensive list of your Webflow pages to assess the quality, relevance, and update status of each page, helping improve SEO and user experience.
- Asset Management: Understand which assets are most frequently used to shape future content strategies and ensure consistency in branding.
- Collection Refinement: Use a spreadsheet view of all collections to understand and refine how different content types are structured, categorized, and displayed.
- SEO Optimization: Review metadata like titles, descriptions, and slugs across all collection items to ensure content is SEO-friendly and follows best practices.
- Inventory Management: Monitor inventory levels, SKUs, and restocking dates for ecommerce products, helping prevent stockouts and overstocking.
- User Management: Categorize users based on roles, permissions, and other criteria, making it easier to manage their access to different parts of your Webflow platform.
Tips and Tricks for Analyzing Live Webflow Data in Excel
- Utilize Excel’s powerful tools like PivotTables and PivotCharts to quickly summarize and visualize your Webflow data for better insights.
- Create custom website performance reports and content management dashboards in Excel using the imported Webflow data to share with stakeholders and make informed decisions.
- Set up automatic data refresh schedules in Coefficient to keep your Webflow data in Excel always up-to-date.
- Leverage Excel’s extensive library of functions and formulas to perform advanced calculations and analyses on your Webflow data.
Connect Webflow to Excel in Minutes with Coefficient
Connecting Webflow to Excel using Coefficient simplifies the process of importing and analyzing your website data. By following this tutorial, you can easily fetch your Webflow data into an Excel spreadsheet and leverage the powerful analysis tools available in Excel to uncover valuable insights into your website’s performance, content quality, and user engagement.
Start using Coefficient today to enhance your Webflow data management and analysis workflow. Get started for free!


