Connecting Rippling to Microsoft Excel using Coefficient allows you to import and analyze your HR and payroll data directly in your spreadsheets.
This integration simplifies data management, enhances reporting capabilities, and provides real-time access to critical employee information.
In this guide, we’ll walk you through the process of setting up the connection and importing Rippling data into Excel.
Advantages of Using Excel to Analyze Rippling Data
- Centralized HR data management: Consolidate employee information, payroll data, and organizational structures in one place for easier access and analysis.
- Custom reporting: Create tailored reports and dashboards to track key HR metrics, monitor workforce trends, and share updates with stakeholders.
- Automated data updates: Keep your HR data current with scheduled refreshes, ensuring you always work with the most up-to-date information.
Step-by-Step Tutorial: Connecting Rippling to Excel
Before starting, make sure you have the Coefficient add-in installed in Excel. If not, download and install it from the AppSource Marketplace.
Step 1: Add Rippling as a data source in Coefficient
Open Coefficient in Excel: Launch the Coefficient add-in from the Excel ribbon.
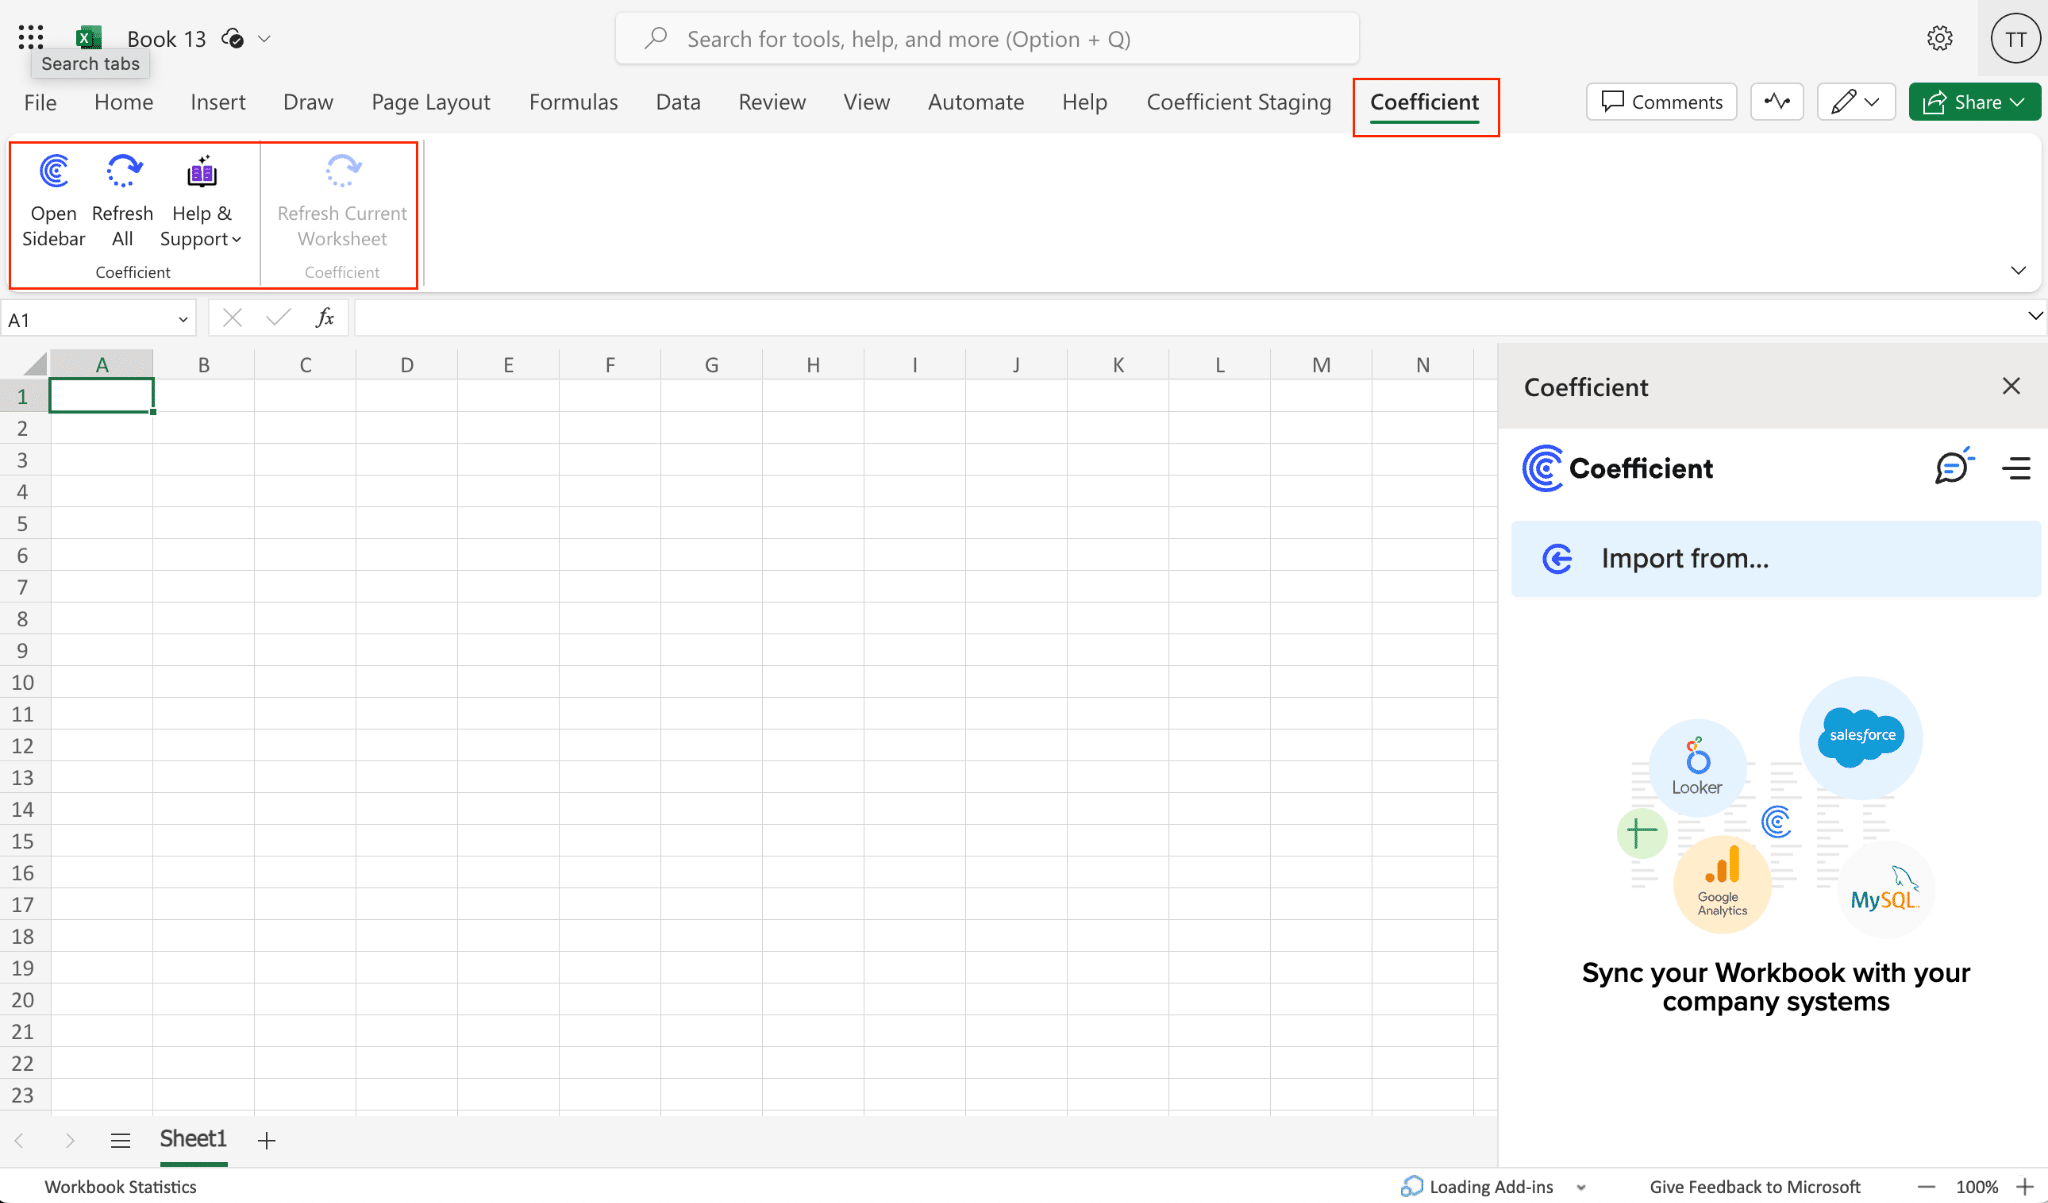
Select Rippling: Click on “Add a Data Source” and choose “Rippling” from the list of available integrations.
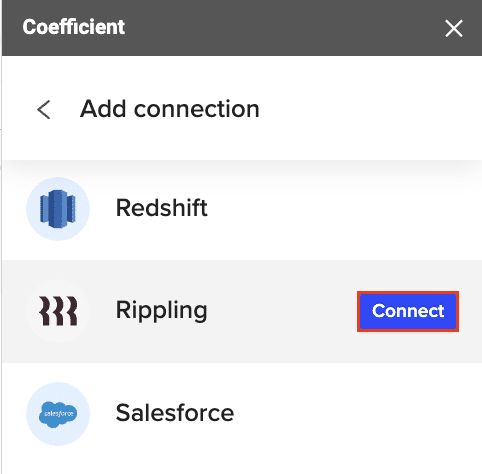
Connect your Rippling account: Enter your Rippling API key to authenticate the connection. 
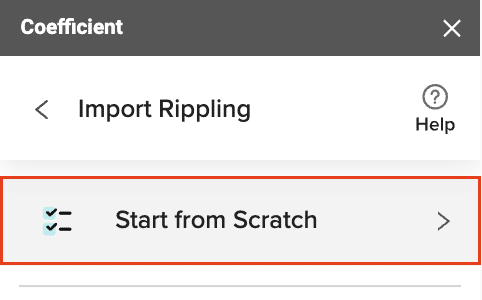
Start a new import: After authentication, return to Rippling and select “Start from Scratch.”
Step 2: Choose the data you want to import
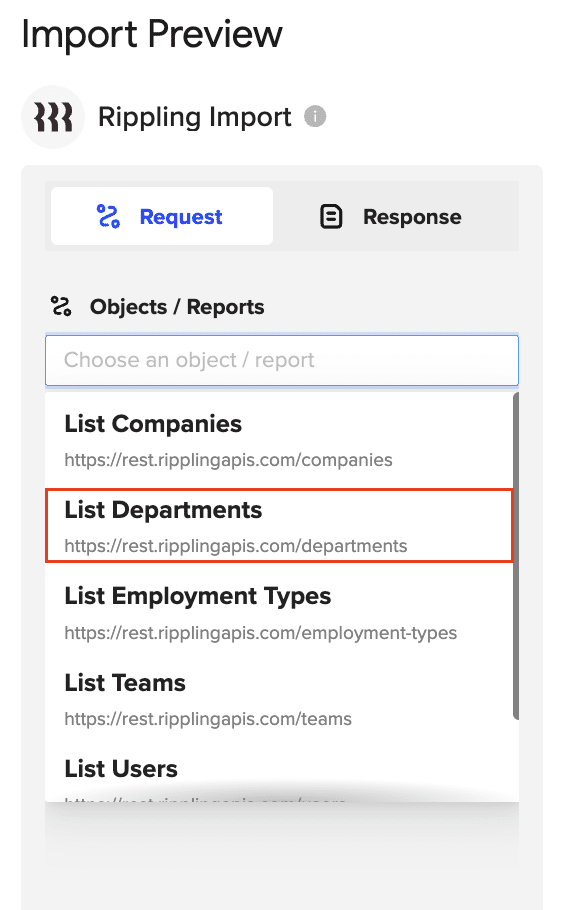
Select an object: Coefficient will display a list of available Rippling objects. Choose the object you want to import, such as Companies, Departments, or Users.

Stop exporting data manually. Sync data from your business systems into Google Sheets or Excel with Coefficient and set it on a refresh schedule.

Preview and select fields: Coefficient will generate a preview of the data fields available for the selected object. Choose the specific fields you want to include in your Excel import.

Refine your import: Apply any necessary filters, sort options, or limits to refine your data import. You can also rename columns or reorder them to match your preferred spreadsheet layout.
Step 3: Import your Rippling data into Excel
Confirm and import: Once you’ve configured your import settings, click “Import” to pull the Rippling data into your Excel spreadsheet. Coefficient will create a new sheet with the imported data. 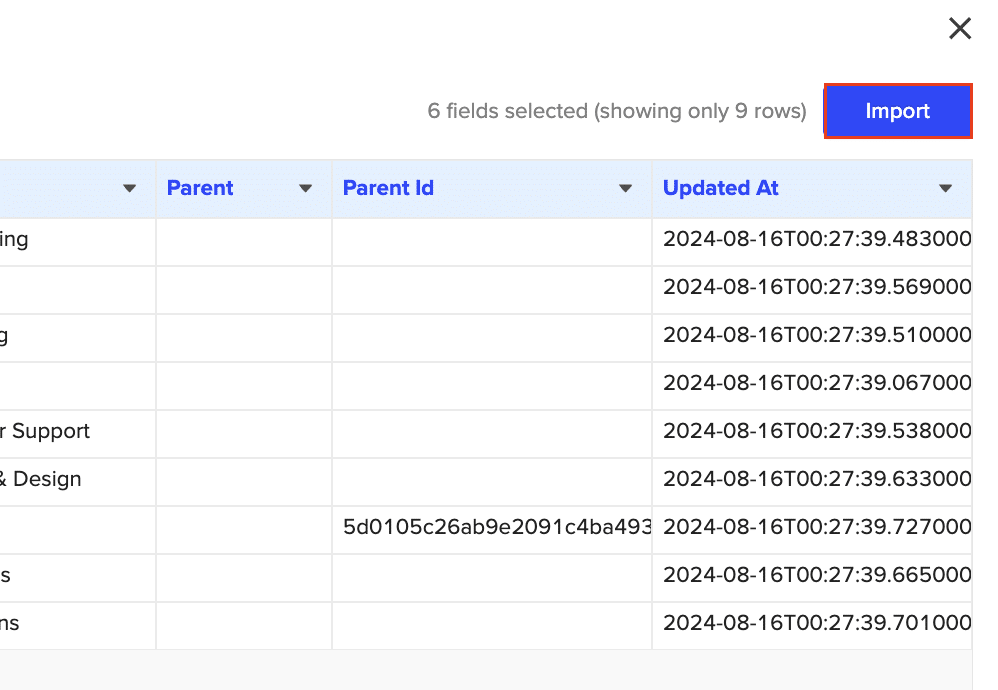
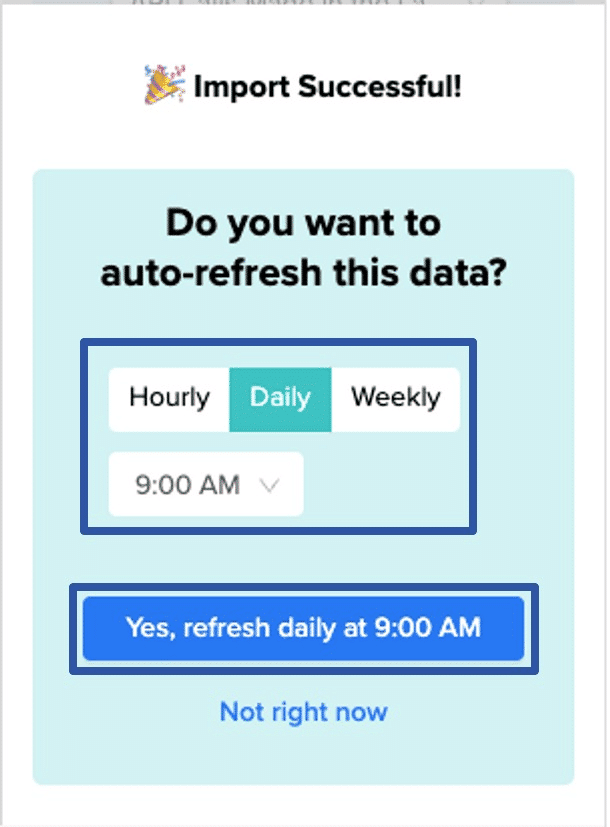
Set up auto-refresh: To keep your Rippling data up to date, set up an auto-refresh schedule in Coefficient. Choose an update frequency (hourly, daily, or weekly) and specify a time for the data to refresh automatically.
Use Cases for Managing Rippling Data in Excel
- Workforce analytics: Import user data to analyze employee demographics, tenure, and department distribution. Create visual representations of your organizational structure and track changes over time.
- Payroll reporting: Pull in payroll data to generate custom reports on salary distributions, overtime trends, and labor costs across departments or locations.
- Team management: Use the “List Teams” object to track team compositions, sizes, and changes. Identify understaffed or overstaffed teams and plan resource allocation accordingly.
- Employment type analysis: Import employment type data to analyze the distribution of full-time, part-time, and contract workers across your organization. Monitor trends and adjust hiring strategies as needed.
- Location-based reporting: Use the “List Work Locations” object to create reports on employee distribution across different office locations or remote work arrangements.
- Custom object tracking: Leverage Rippling’s custom objects and fields to import specialized data unique to your organization, such as training certifications, equipment assignments, or project allocations.
Connect Rippling to Excel in Seconds with Coefficient
Connecting Rippling to Excel using Coefficient opens up a world of possibilities for HR data analysis and reporting. By following this step-by-step guide, you can easily import your Rippling data into Excel and start leveraging its powerful features to gain deeper insights into your workforce.
Ready to transform your HR data management? Get started with Coefficient today and experience the benefits of seamless Rippling-Excel integration.

