
Intercom is an invaluable resource for customer communication and support data. By connecting Intercom to Microsoft Excel with Coefficient, you can take your analytics to the next level.
This integration allows you to retrieve key metrics, identify trends, and make data-driven decisions to improve customer satisfaction.
Prefer video? Watch the tutorial here!
Advantages of Analyzing Intercom Data in Excel
- Comprehensive View: Consolidate customer data from various Intercom sources into one spreadsheet for a complete overview of your customer engagement.
- Customizable Analysis: Use Excel’s powerful tools to slice and dice your Intercom data, create custom formulas, and build insightful visualizations.
- Collaborative Reporting: Share your Intercom analytics with team members within Excel, facilitating seamless collaboration and aligned decision-making.
Step-by-Step Guide: Connecting Intercom to Excel via Coefficient
Step 1. Install Coefficient in Microsoft Excel
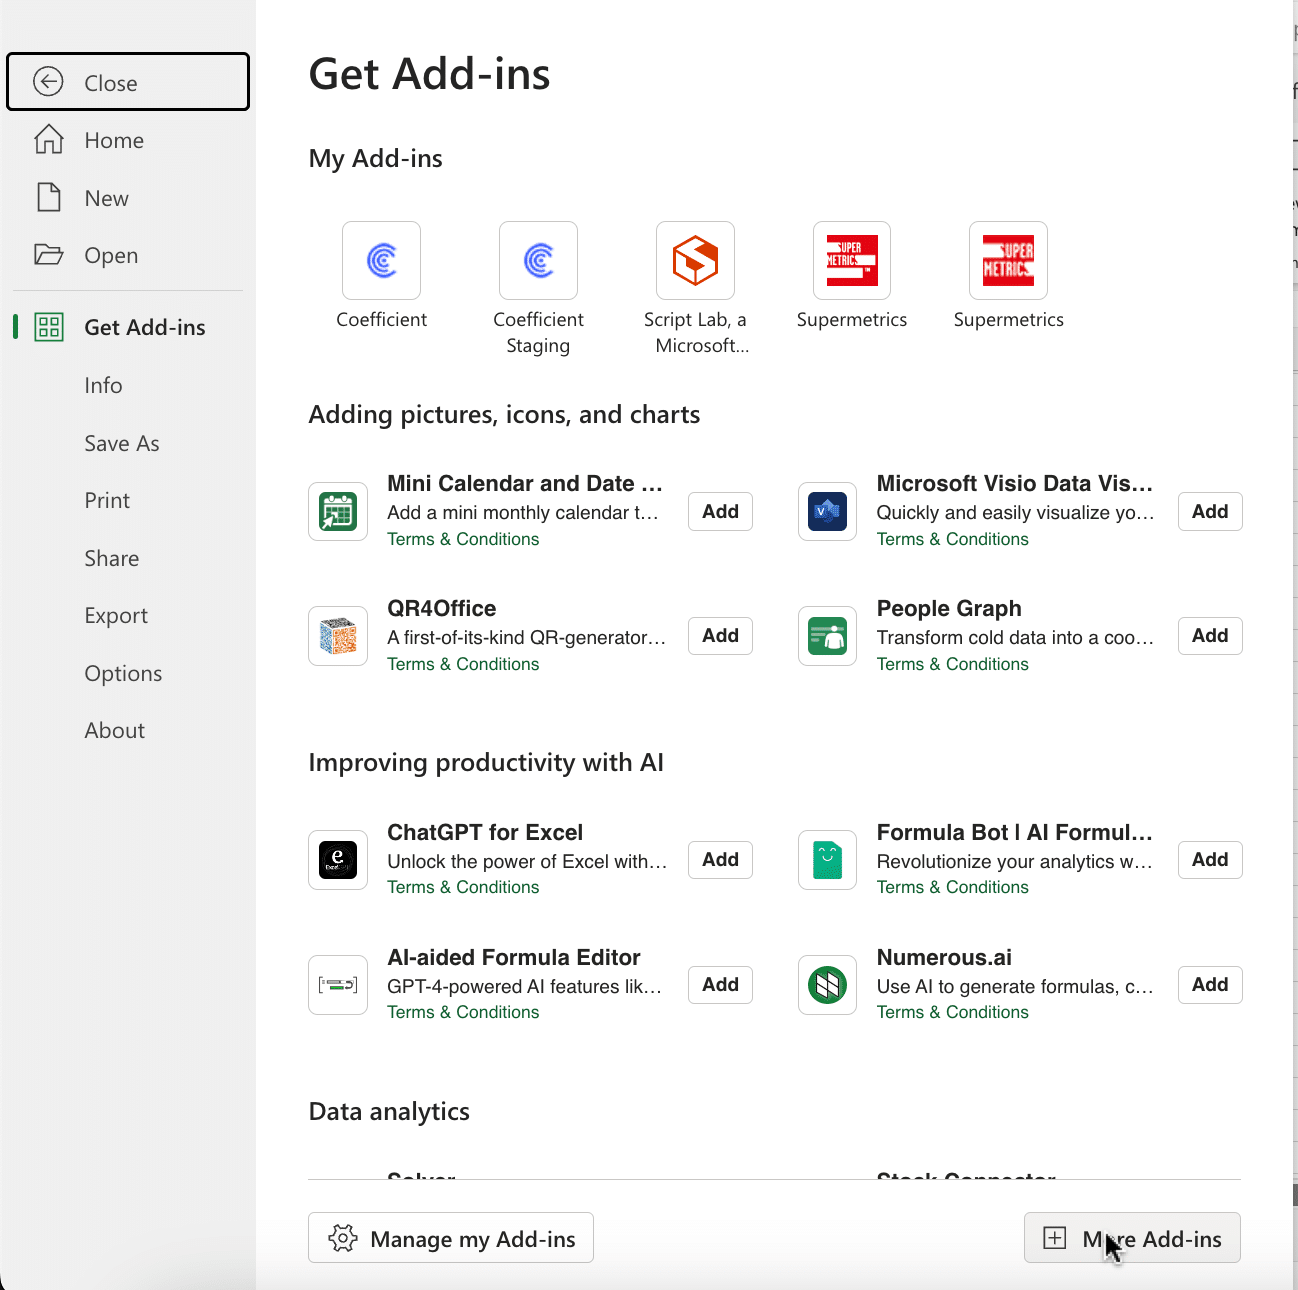
You can either get started here or open Excel from your desktop or in Office Online. Click ‘File’ > ‘Get Add-ins’ > ‘More Add-Ins.’
Type “Coefficient” in the search bar and click ‘Add.’
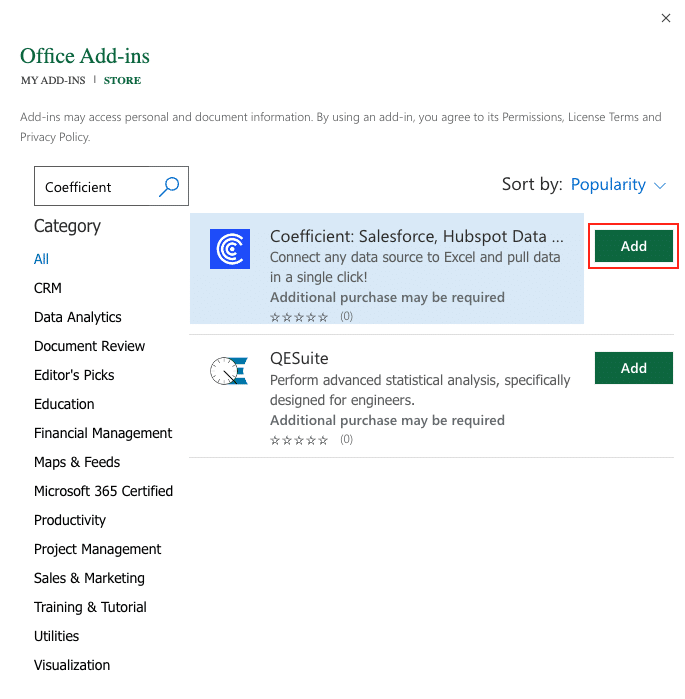
Follow the prompts in the pop-up to complete the installation.
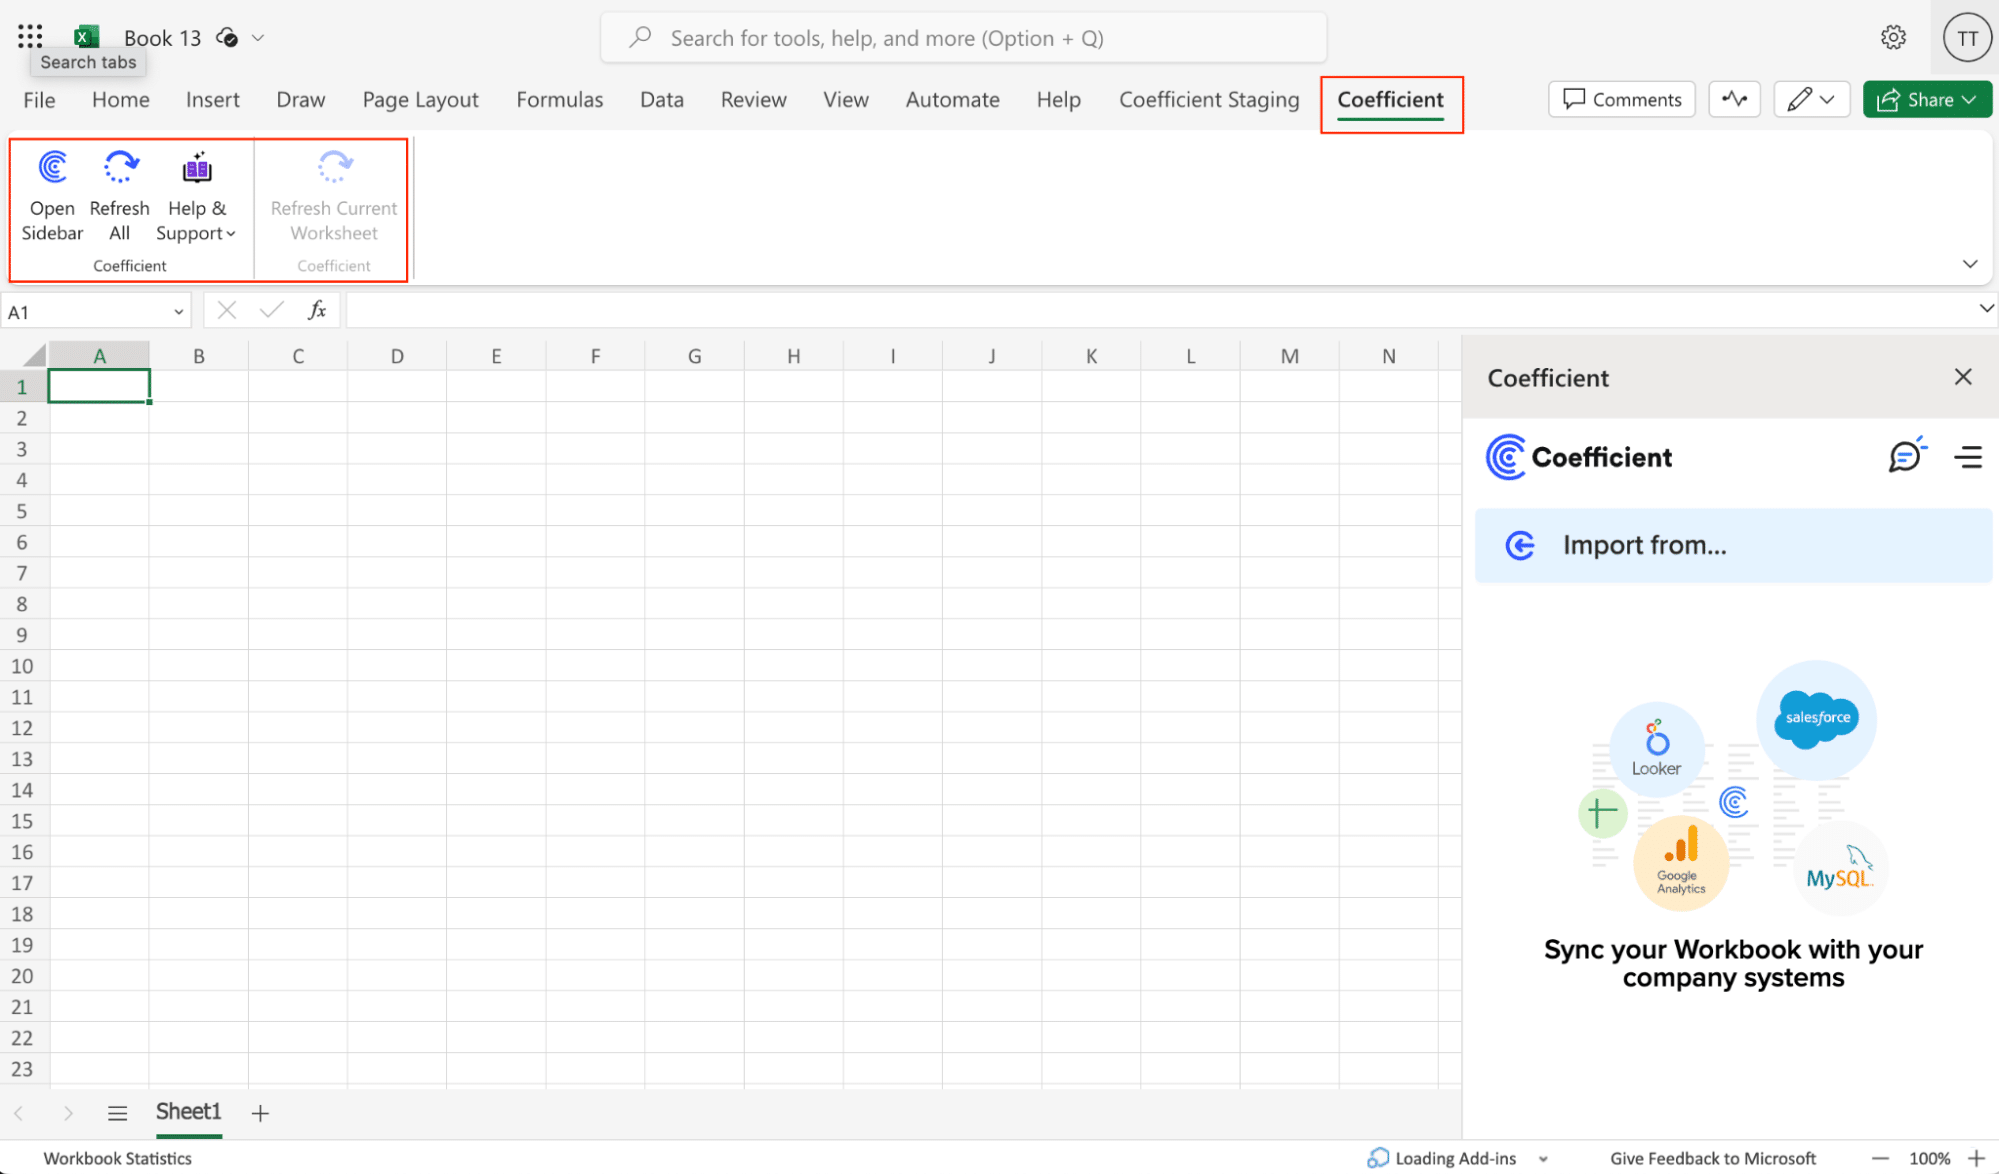
Once finished, you will see a “Coefficient” tab in the top navigation bar. Click ‘Open Sidebar’ to launch Coefficient.
Step 2: Connect to Intercom
Select “Import from…” in the Coefficient sidebar.

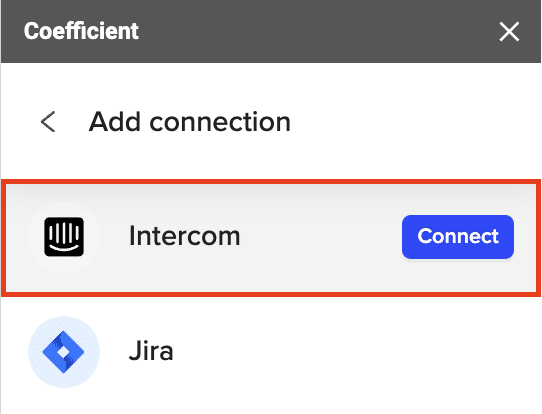
Click “Add” and search for “Intercom” in the bar. Click “Connect” to continue.
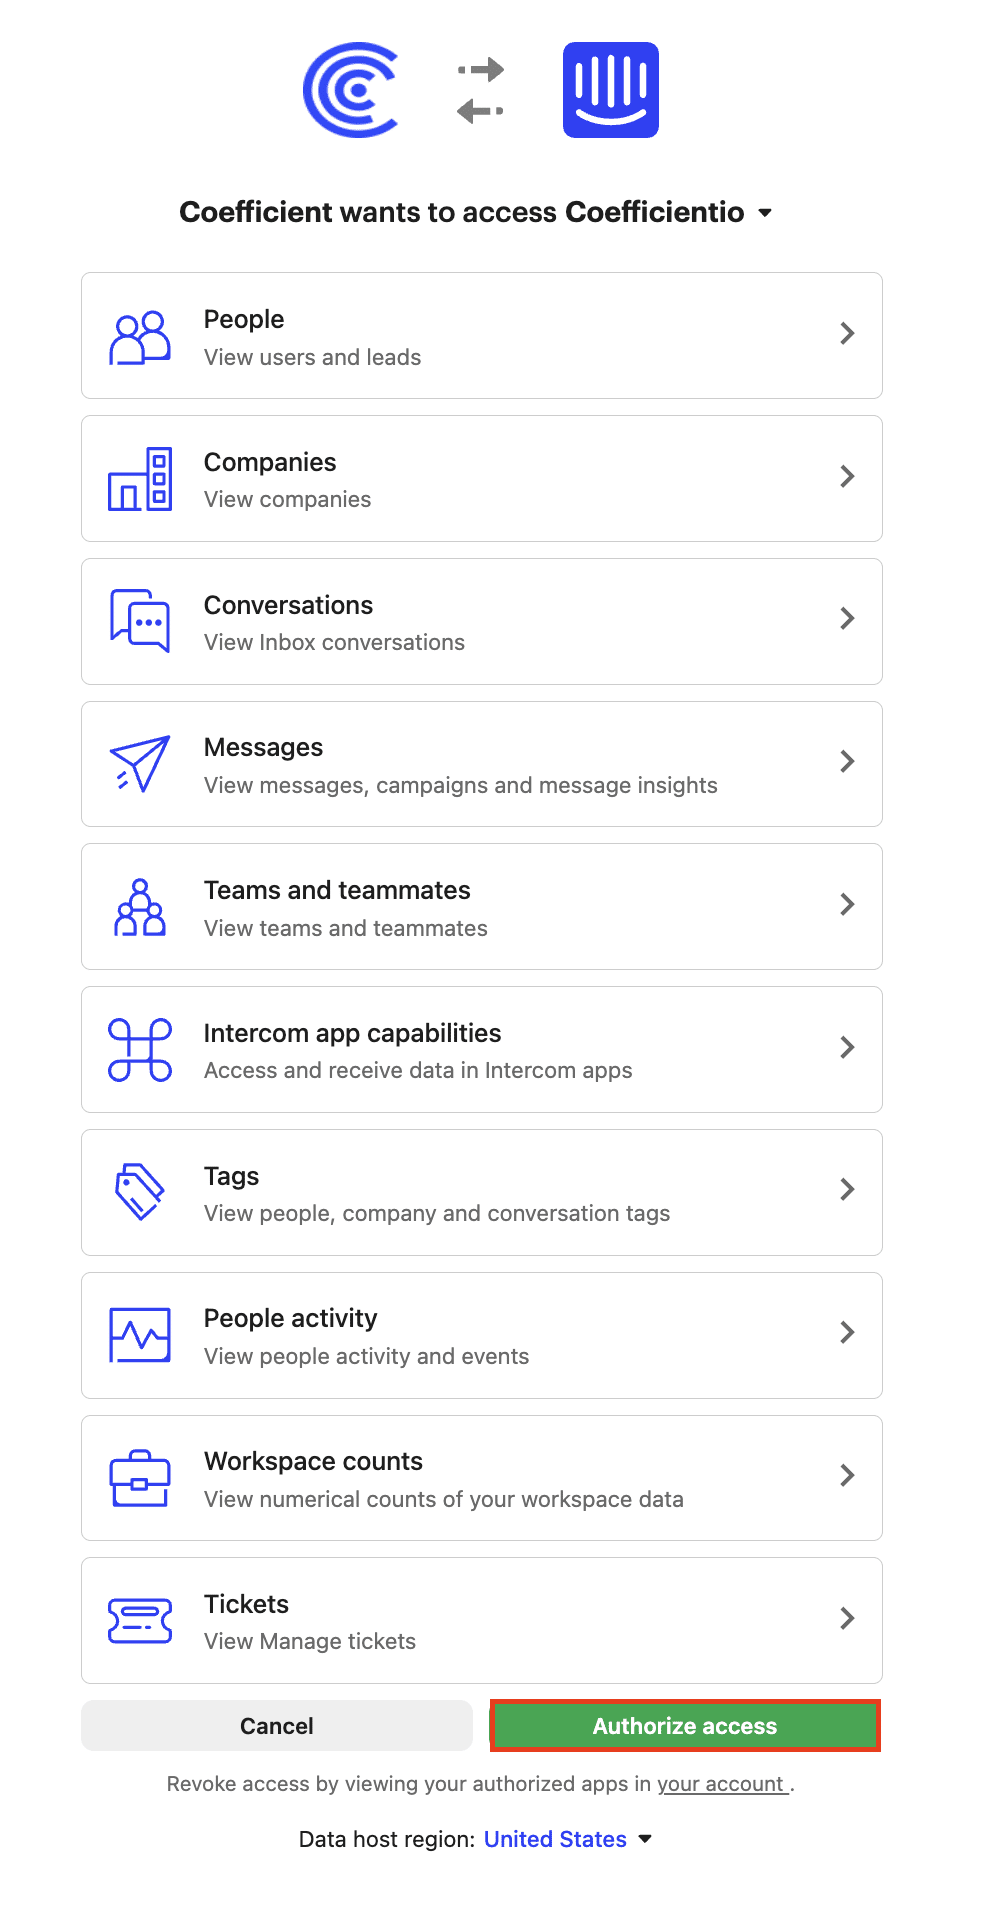
Choose your Intercom data center and click “Authorize”.

Follow the prompts to authorize Coefficient to your account.
Step 3: Import Your Data
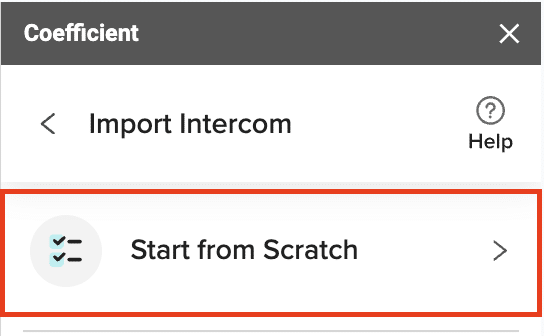
Select “Start from Scratch” from the next menu.
Open the drop-down and choose “Retrieve Companies”.
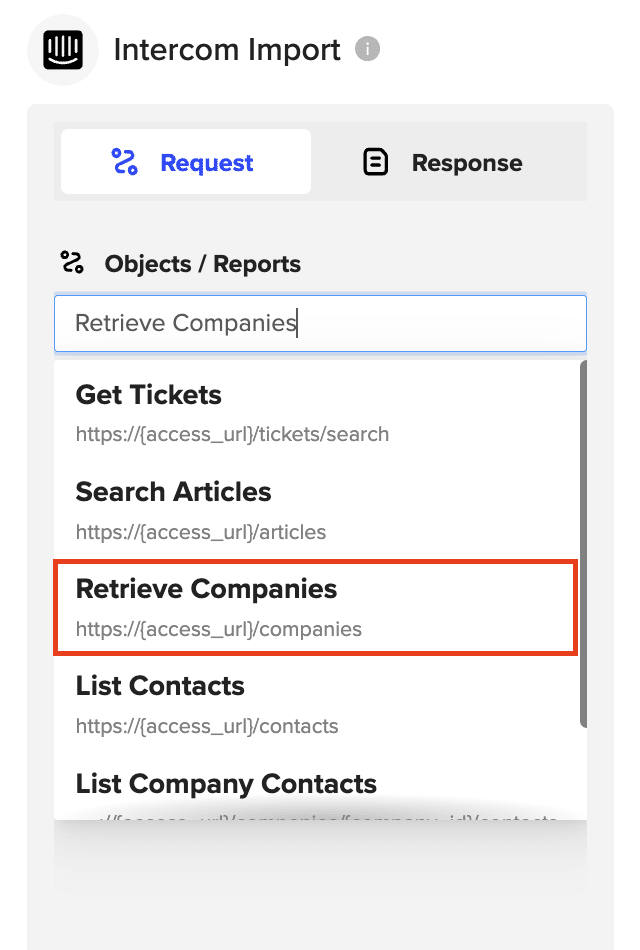
Click “Preview” to continue.

Stop exporting data manually. Sync data from your business systems into Google Sheets or Excel with Coefficient and set it on a refresh schedule.


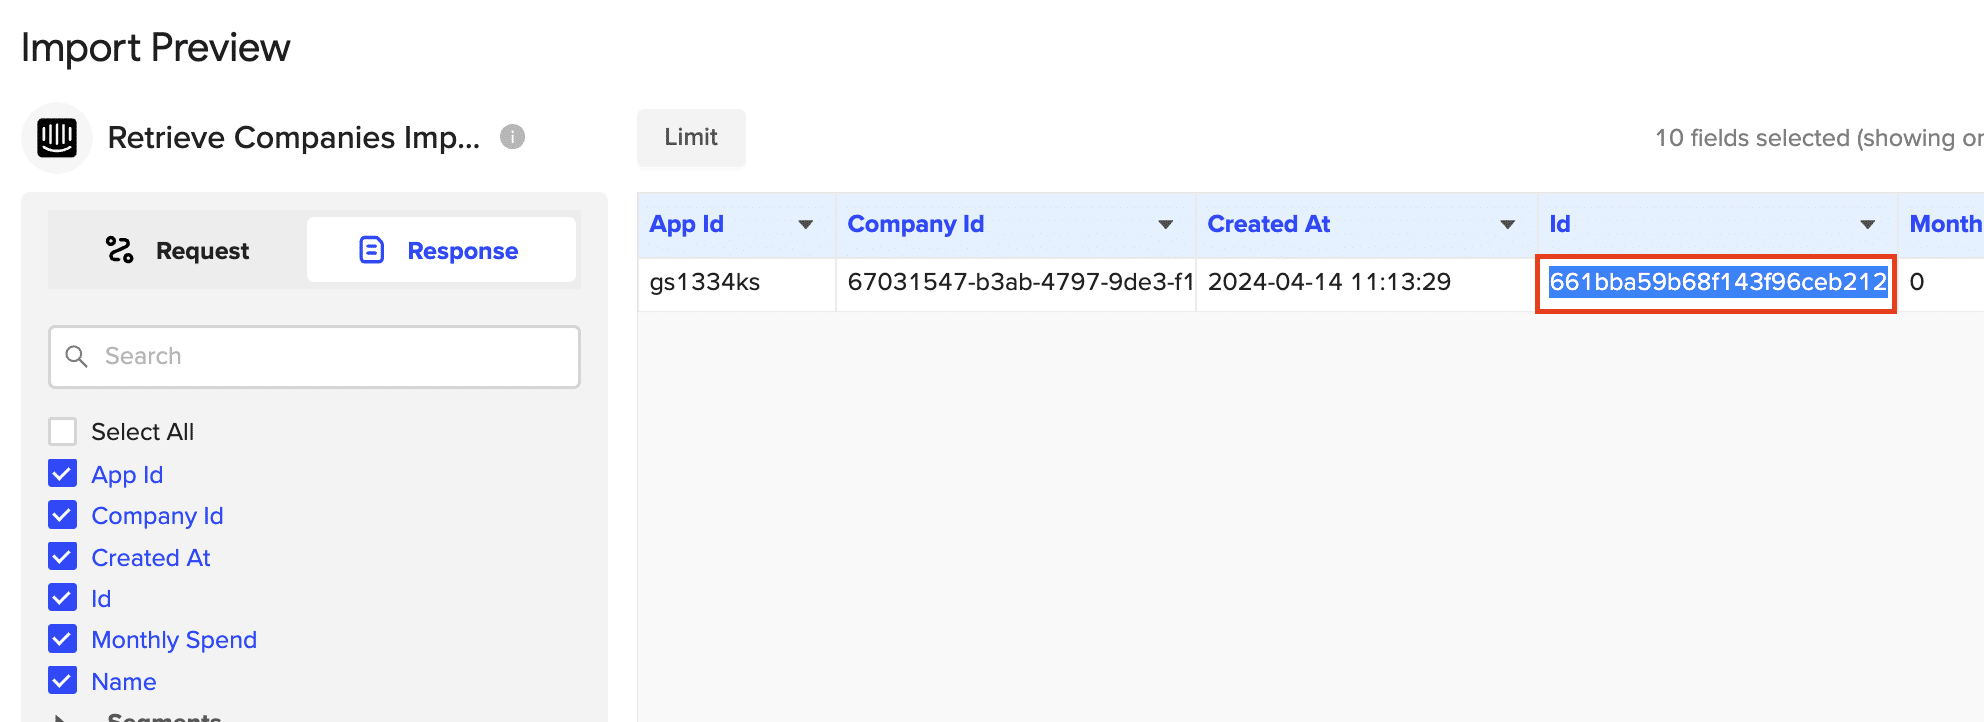
Copy the ID of the company you want to analyze from the Coefficient Import Preview menu.
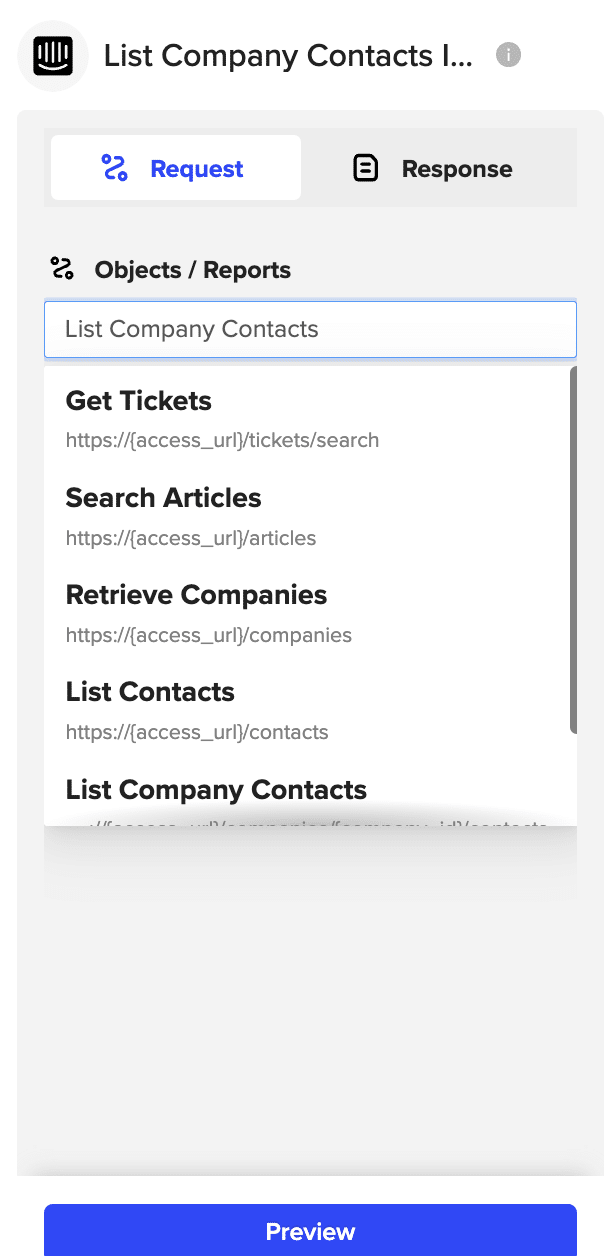
Next, return to the objects menu select “List Company Contacts” from the drop down.
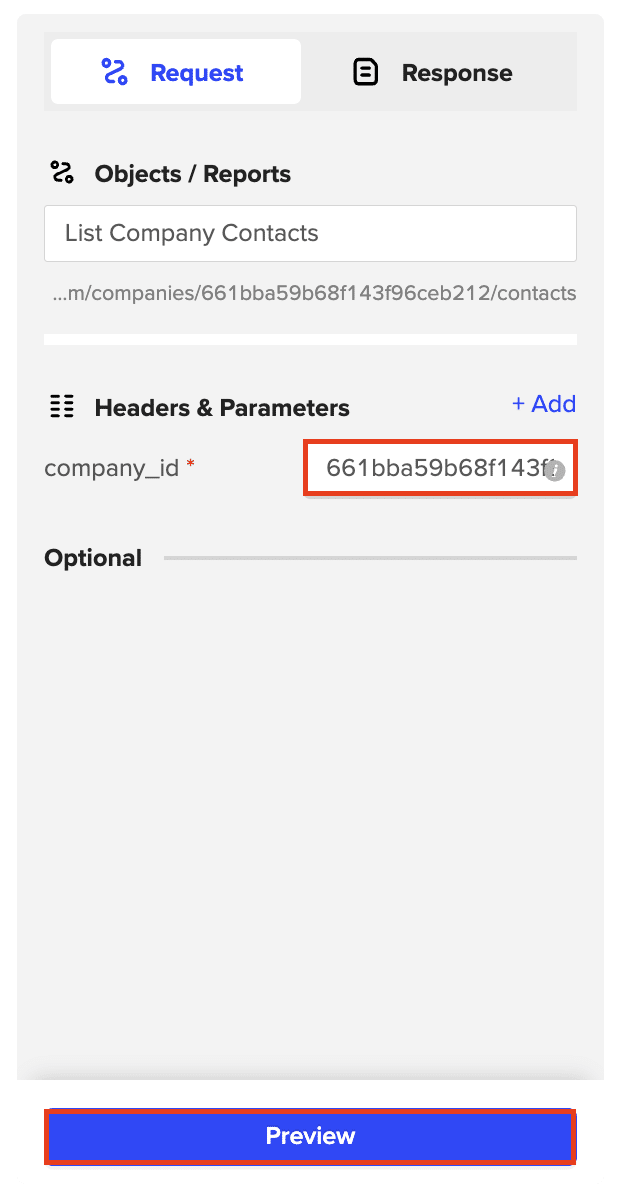
Paste the company ID and click “Preview”.
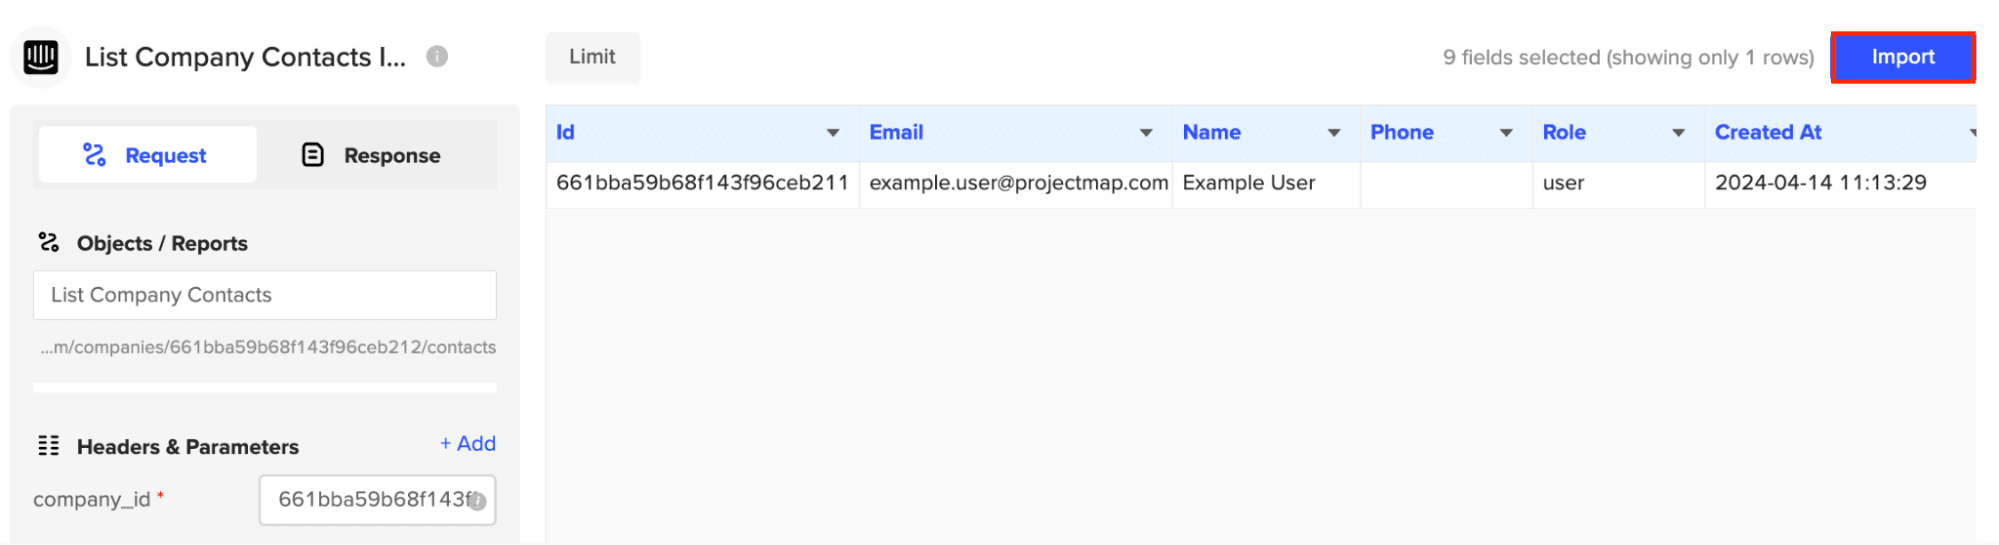
Select the fields you want and click “Import”.
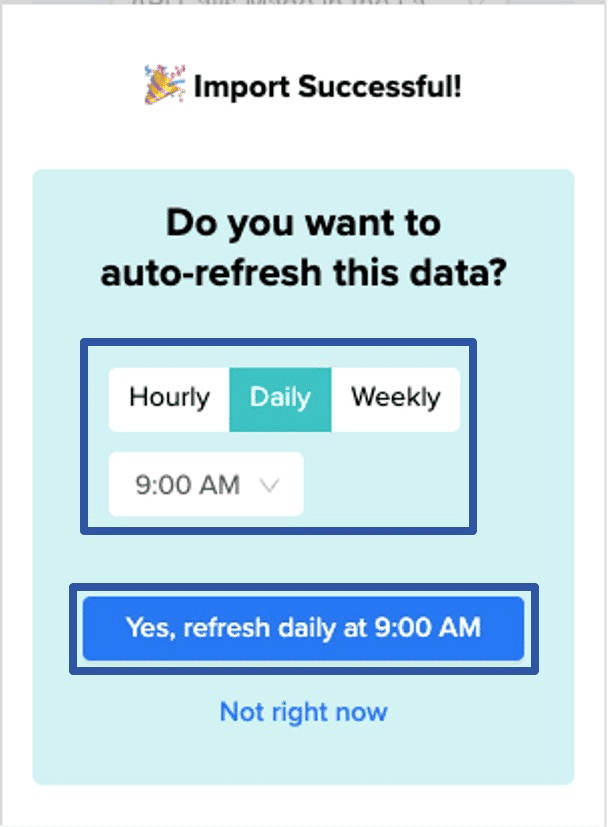
Step 4. Set Up Automatic Data Refreshes
After importing your data into Excel, activate Coefficient’s auto-refresh scheduler for automatic updates.
Just select your frequency (hourly, daily, or weekly) and the specific time, and Coefficient will handle the rest.
Use Cases for Intercom data analysis in excel
- Segment Customers: Categorize customers based on attributes like industry, subscription status, or engagement level to tailor your support and marketing strategies.
- Evaluate Conversation Quality: Assess conversation metrics such as response times, satisfaction ratings, and resolution rates to identify areas for improvement.
- Track Help Center Performance: Monitor article views, categories, and publication statuses to optimize your self-service resources and reduce support volume.
Tips for Effective Intercom Data Analysis
- Combine data from multiple Intercom objects to gain a comprehensive view of customer interactions.
- Leverage Excel formulas and pivot tables to uncover meaningful insights and patterns.
- Visualize your findings with charts and graphs to communicate insights effectively to stakeholders.
Connect Intercom to Excel in Seconds with Coefficient
Connecting Intercom to Microsoft Excel with Coefficient empowers you to master your customer engagement data. By following this step-by-step guide, you can effortlessly import your Intercom data, analyze it with Excel’s robust features, and drive impactful improvements in your customer support and success strategies.
Don’t wait – get started with Coefficient today and unlock the full potential of your Intercom data!


