As data grows at an unprecedented rate, equipping business users with data is becoming more complicated. Overloaded data teams, code-heavy data stacks, and interdepartmental friction make it difficult to provide business users with data. As a result, 63% of business users do not receive insights on their required timeframes.
To close the modern data gap, business users will need to adopt some kind of self-service solution for data analytics. However, business users do not have the technical skills to leverage the modern data stack in any meaningful way.
So what technology do business users actually feel comfortable in? The answer is so obvious, it’s easy to miss at first. Yes, the answer is spreadsheets. Spreadsheets enable business users to transform and visualize data in a familiar low-code interface that millions of users prefer.
However, up until recently, spreadsheets lacked the data connectivity and analytics capabilities necessary to close the data gap. But the integration of Coefficient and ThoughtSpot for Sheets bridges this divide for the first time.
Coefficient and ThoughtSpot for Sheets turns spreadsheets into a true self-service analytics tool for business users. Here’s how.
Modern Data Stack: Challenges for Business Users
Before highlighting Coefficient and ThoughtSpot for Sheets, an overview of the current status quo for business users is essential.
The average company employs 110 SaaS solutions, creating a maze of platforms and data sources for business users to navigate. The modern data stack allows data teams to quickly and easily centralize this data with pre-built data pipelines, cloud data warehouses, and flexible BI tools. However, for all these advancements, business users are in the same position: locked out of the data stack.
The modern data stack still adheres to an SQL-based architecture. Business users lack the coding skills to leverage it. So for business users, not much has changed. They still have to sit in the data team’s queue and wait for data, just like before. Meanwhile, the data team is already inundated with data requests. As a result, business users do not get the data they need for critical projects.
In recent years, methodologies such as DataOps have aimed to empower business users as self-serving agents in the data stack. While these process optimizations have sometimes improved outcomes, business users still cannot access all the insights they need, when they need them.
No, business users need to access the data stack with a tool they feel at home with. For the vast majority of business users, that tool is spreadsheets. And that’s why the combination of Coefficient and ThoughtSpot for Sheets is such a game-changer. ThoughtSpot’s new integration with Coefficient brings, for the first time, true self-service analytics to spreadsheets.
Coefficient + ThoughtSpot: Closing the Data Gap for Business Users
With over 1 billion users, spreadsheets are perhaps the most popular business application in the world. Every day, business users leverage spreadsheets to perform tasks that mirror functions in the data stack. This includes analyzing tabular data, transforming data with formulae, and visualizing data as charts and dashboards.
Spreadsheets allow business users to manipulate data with a “programming language” they already know. If business users could leverage this low-code interface as a part of the data stack, they could execute many data tasks independently, and get the insights they need without clogging up the data team’s queue.
But spreadsheets lack direct data connectivity to the company systems that business users rely on, including Salesforce, HubSpot, MySQL and others. Often, business users export data from these systems manually and copy-and-paste the data into spreadsheets. And then once the data is in spreadsheets, business users cannot search the data easily or perform real-time analytics.
The integration of Coefficient and ThoughtSpot for Sheets changes all of that. With Coefficient, you can import real-time data from your company systems directly into Google Sheets. And starting today, ThoughtSpot for Sheets will allow you to perform search, analytics, and visualization on this real-time data.
Coefficient/ThoughtSpot for Sheets Integration: Step-by-Step Walkthrough
By integrating Coefficient and ThoughtSpot for Sheets, you can import real-time data into Google Sheets (Coefficient) and perform search, visualization, and Live Analytics (ThoughtSpot) on the data in a few clicks. Here’s how.
Step 1: Import Real-Time Data into Google Sheets with Coefficient
To generate live, self-service analytics in our spreadsheet, we’ll need to import real-time data into Google Sheets with Coefficient.
First, let’s install Coefficient.
Navigate to the Add-ons menu from the main dropdown menu in Google Sheets. Click Get add-ons.
Then enter ‘Coefficient’ in the Google Workspace Marketplace search bar. Select Coefficient from the list.
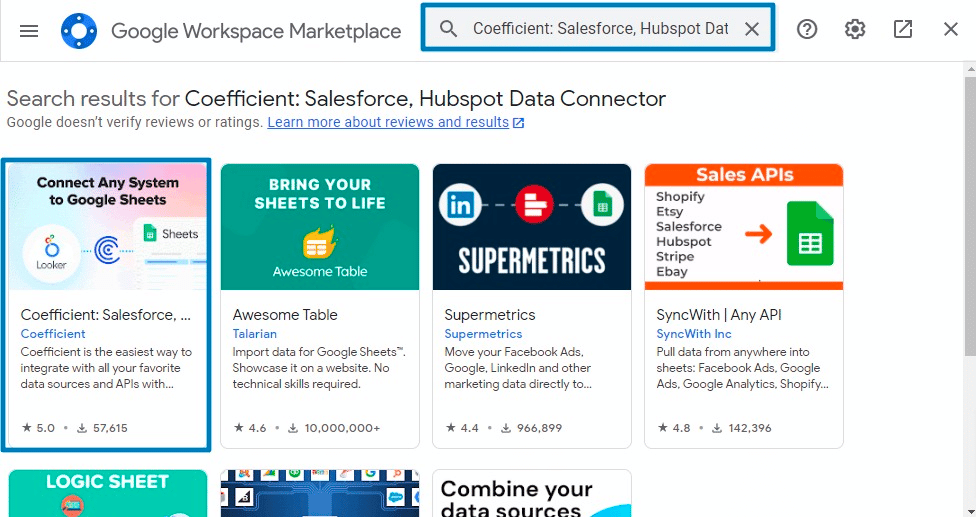
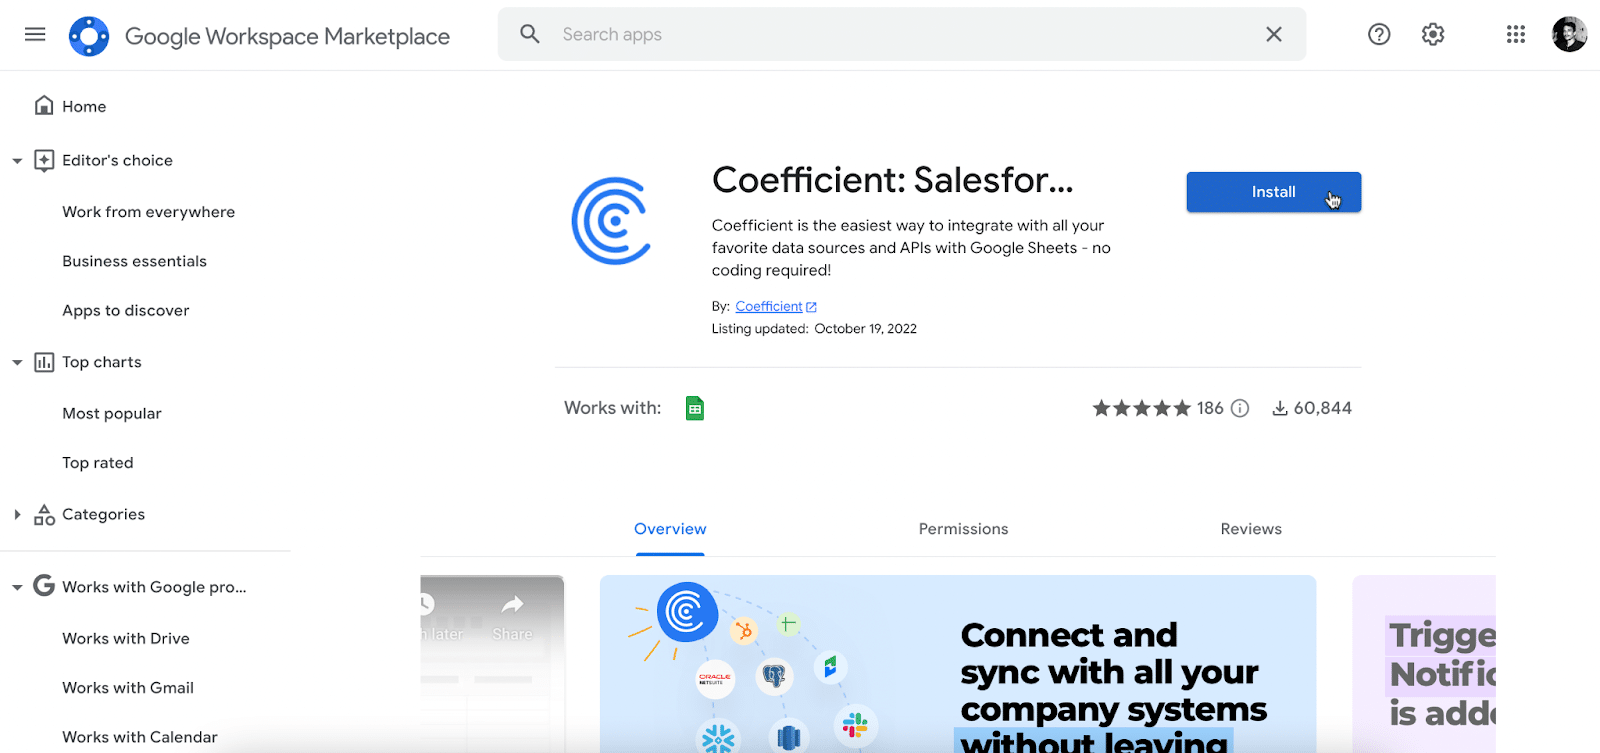
Click the ‘Install’ button on the following page and follow the prompts to install Coefficient.
Now you can launch the Coefficient app from the main menu on Google Sheets.
On the main Google Sheets menu, click Extensions > Coefficient: Salesforce, HubSpot Data Connector > Launch. Coefficient will run as a side panel on Google Sheets.
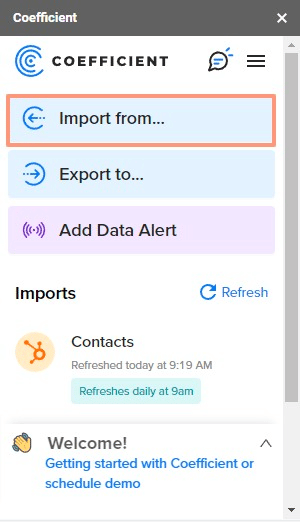
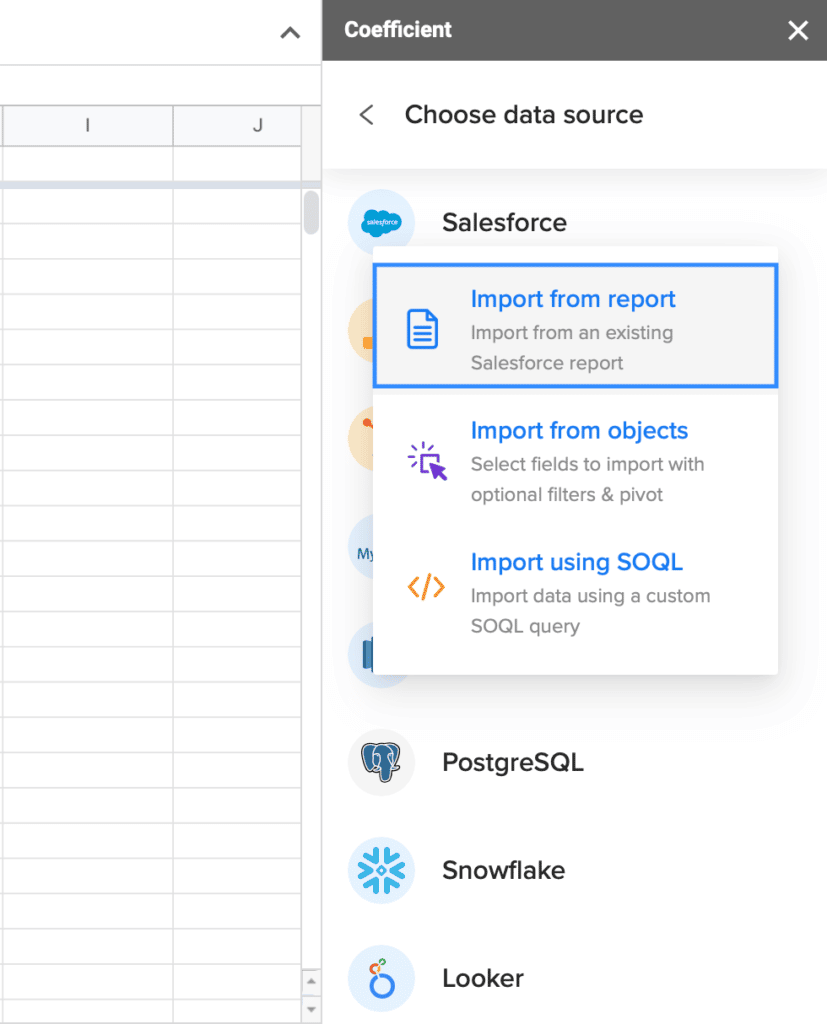
Select ‘Import From’ on the Coefficient sidebar to import live data into Google Sheets.
Now let’s pull a sample real-time dataset from Salesforce. Read How to Connect Salesforce to Google Sheets or watch the video below for a full walkthrough on how to set up Coefficient’s Salesforce connector.
How to Connect Salesforce to Google Sheets: A One Click Integration
Once the connector is set up, you can pull Salesforce data from Reports, Objects, or SOQL queries.
Let’s pull the ‘All Opportunities’ Report
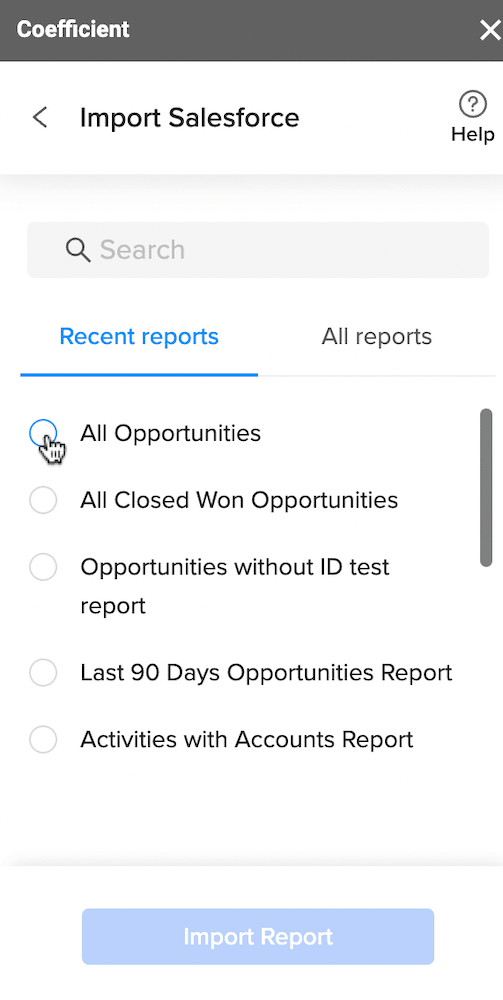
Press ‘Import Report’ to pull the real-time Salesforce data from the report into Google Sheets.
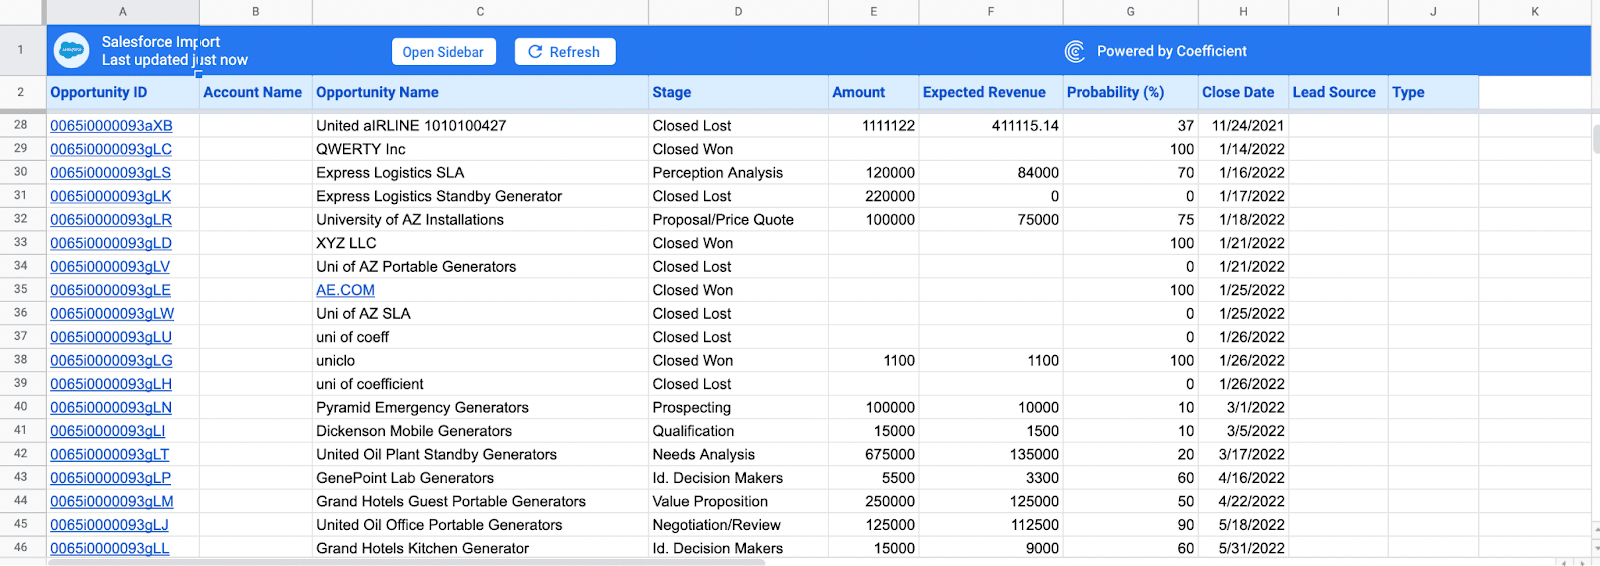
And voila. Now you have live Salesforce data in your Google spreadsheet. No more downloading CSV files. No more copy-and-pasting data into Google Sheets. Just the data you need, conveniently in your spreadsheet.
Step 2: Perform Search, Analytics, and Visualization with ThoughtSpot for Sheets
After you import the live Salesforce data into Sheets using Coefficient, you’ll need to install ThoughtSpot for Sheets.

Stop exporting data manually. Sync data from your business systems into Google Sheets or Excel with Coefficient and set it on a refresh schedule.

ThoughtSpot for Sheets will allow you to perform search, analytics, and visualizations typically associated with the modern data stack, but with point-and-click ease directly inside Google Sheets.
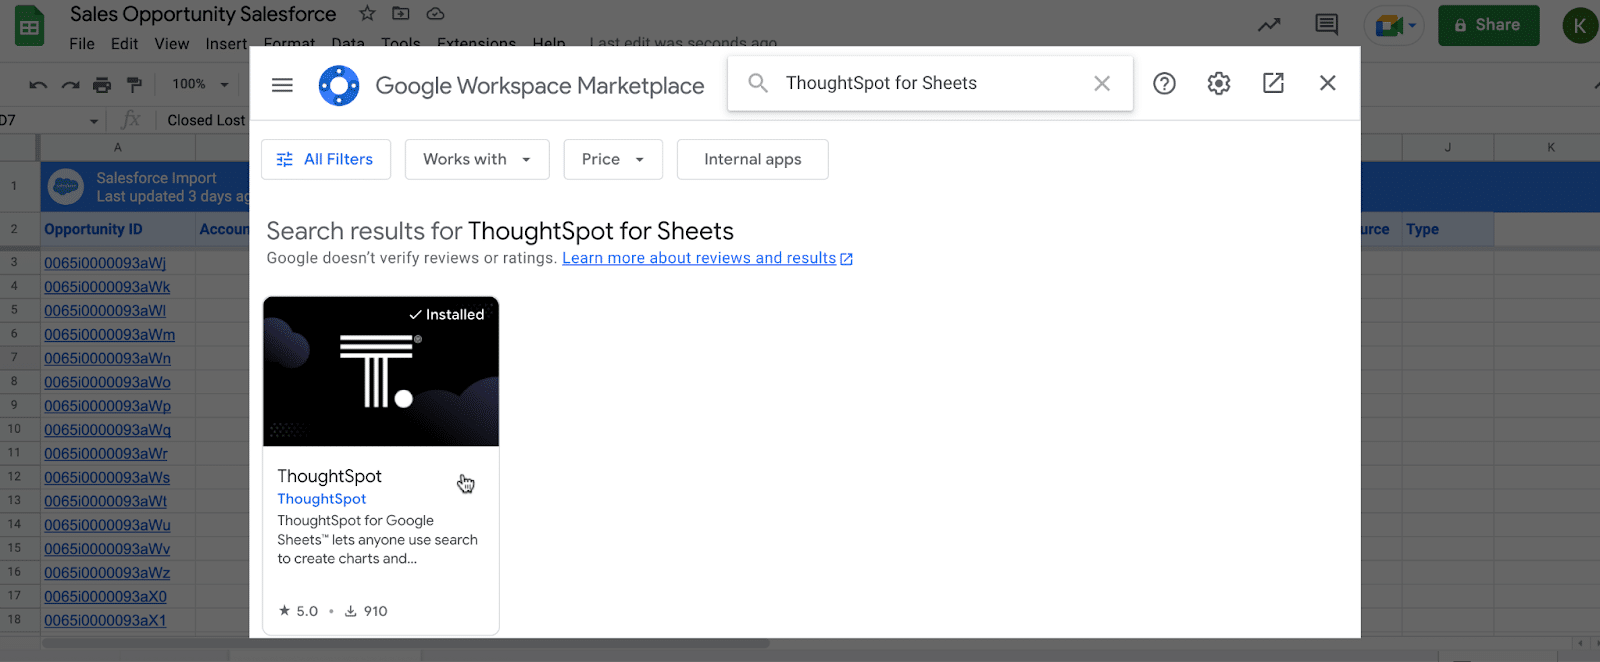
We’ll follow the same steps as we did for installing Coefficient, but search for ‘ThoughtSpot for Sheets’ in Google Workspace Marketplace instead.
Click on the app listing and install the app.
Launch ThoughSpot for Sheets by clicking Extensions > ThoughtSpot for Sheets > Launch.
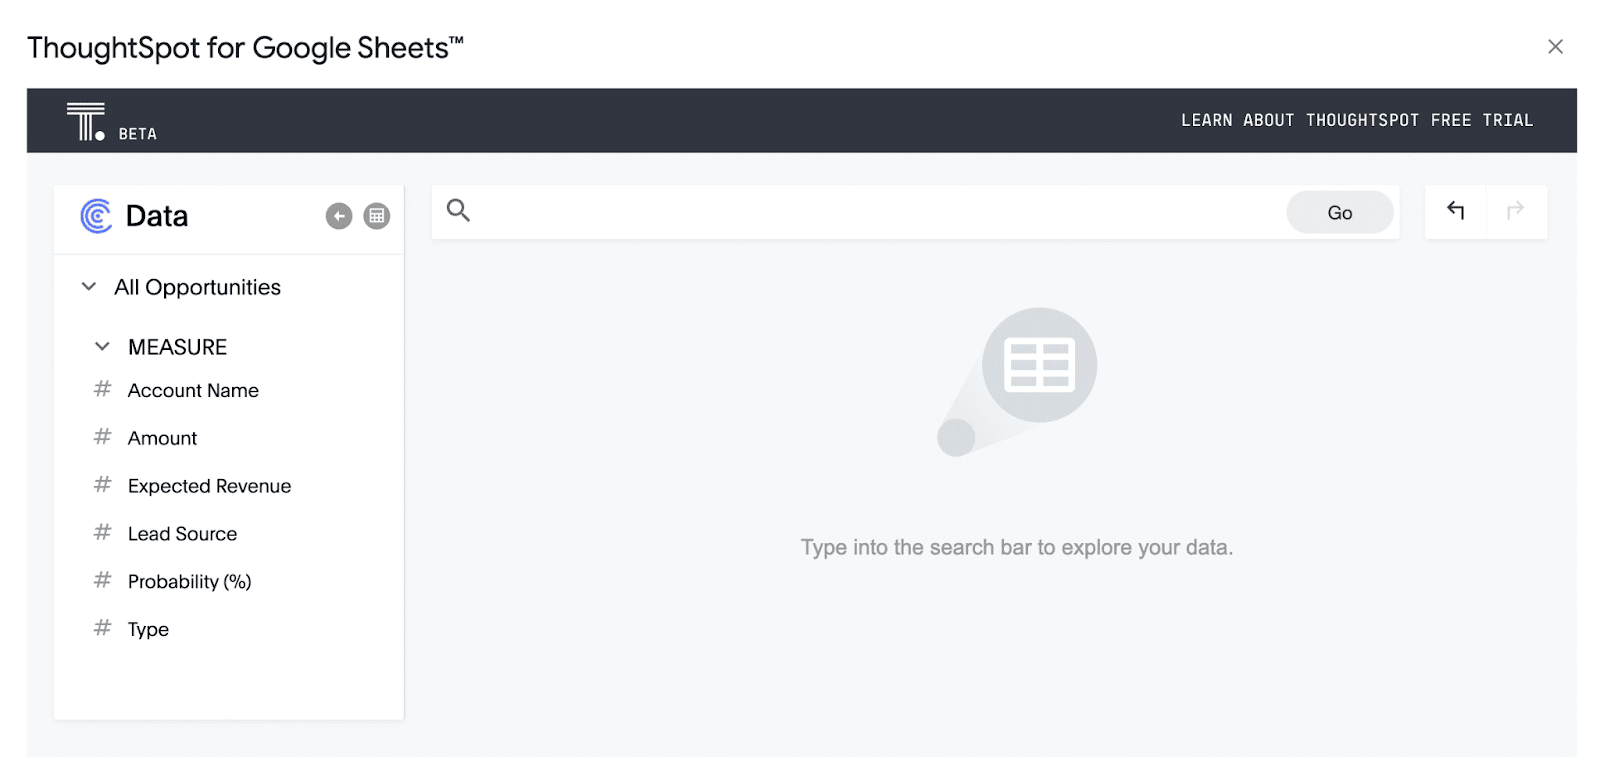
ThoughtSpot for Sheets will automatically detect the Coefficient Salesforce dataset associated with our sheet.
ThoughtSpot for Sheets will also auto-sort the Salesforce data into categories, in this case MEASURE, ATTRIBUTE, and DATE.
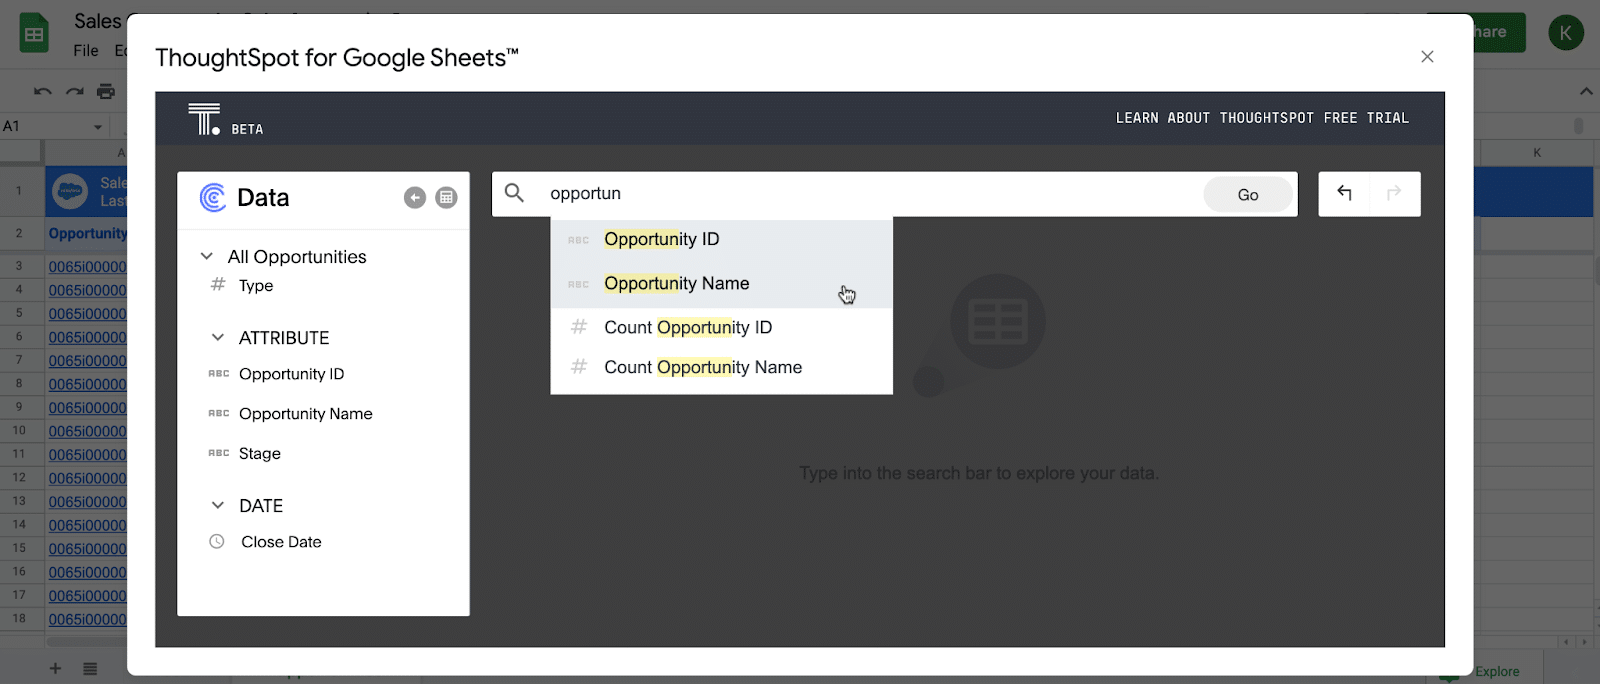
Now let’s use ThoughtSpot’s incisive search capabilities to isolate and combine data within the dataset.
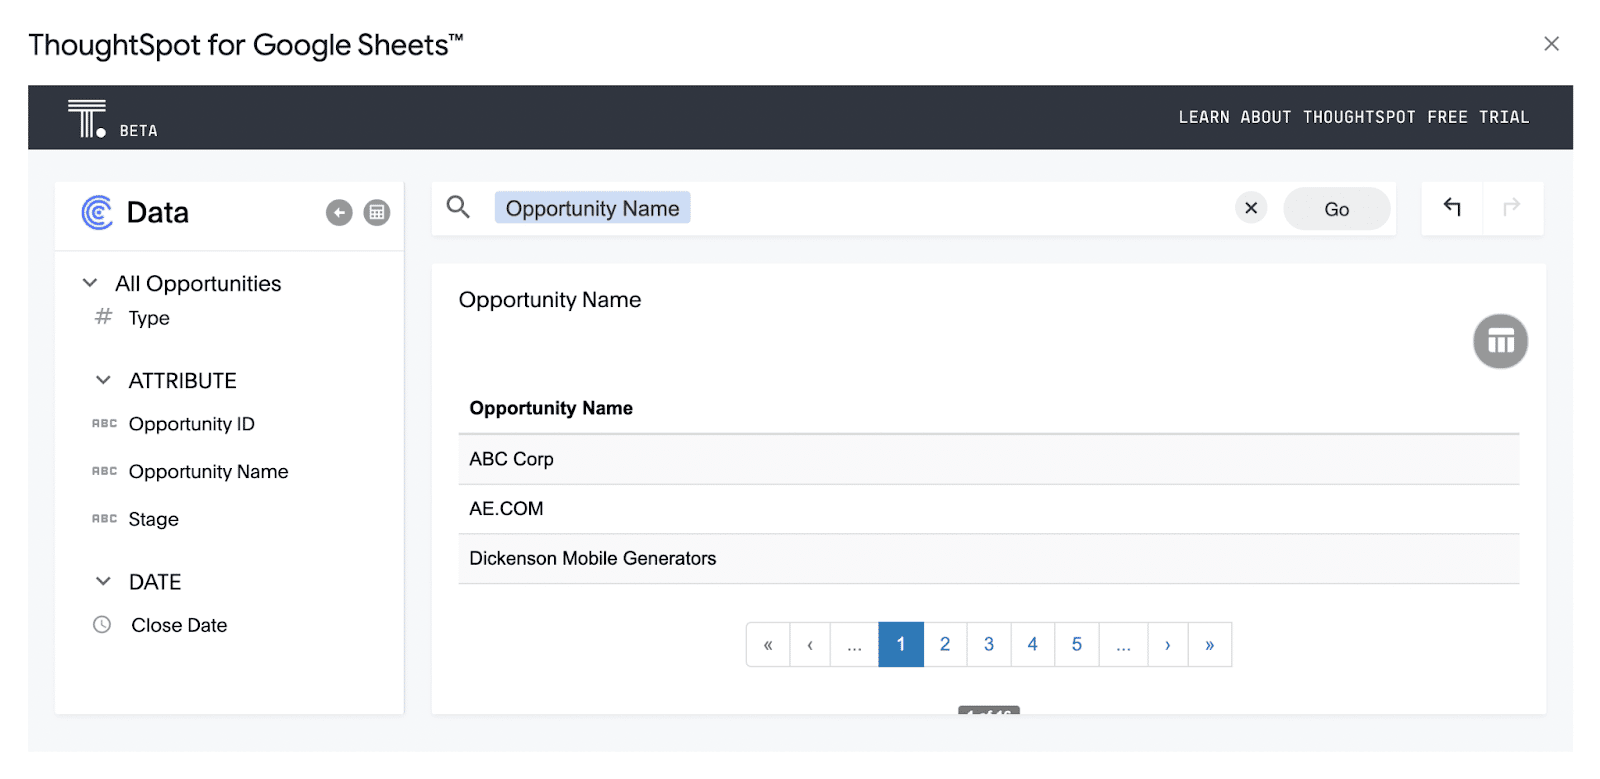
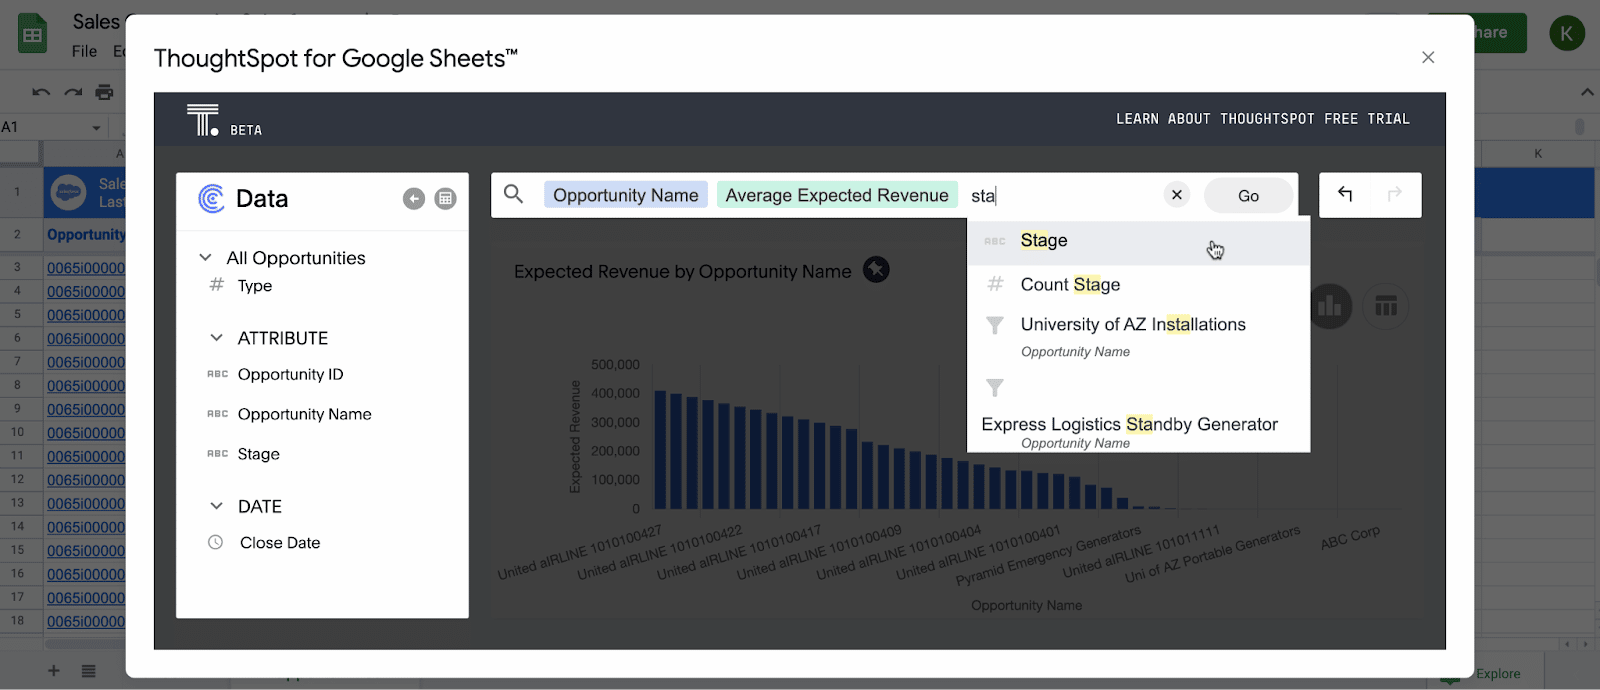
Let’s search for ‘Opportunity Name’. ThoughtSpot for Sheets offers auto-complete suggestions based on the dataset.
This will return a table listing each Opportunity Name in the Salesforce dataset.
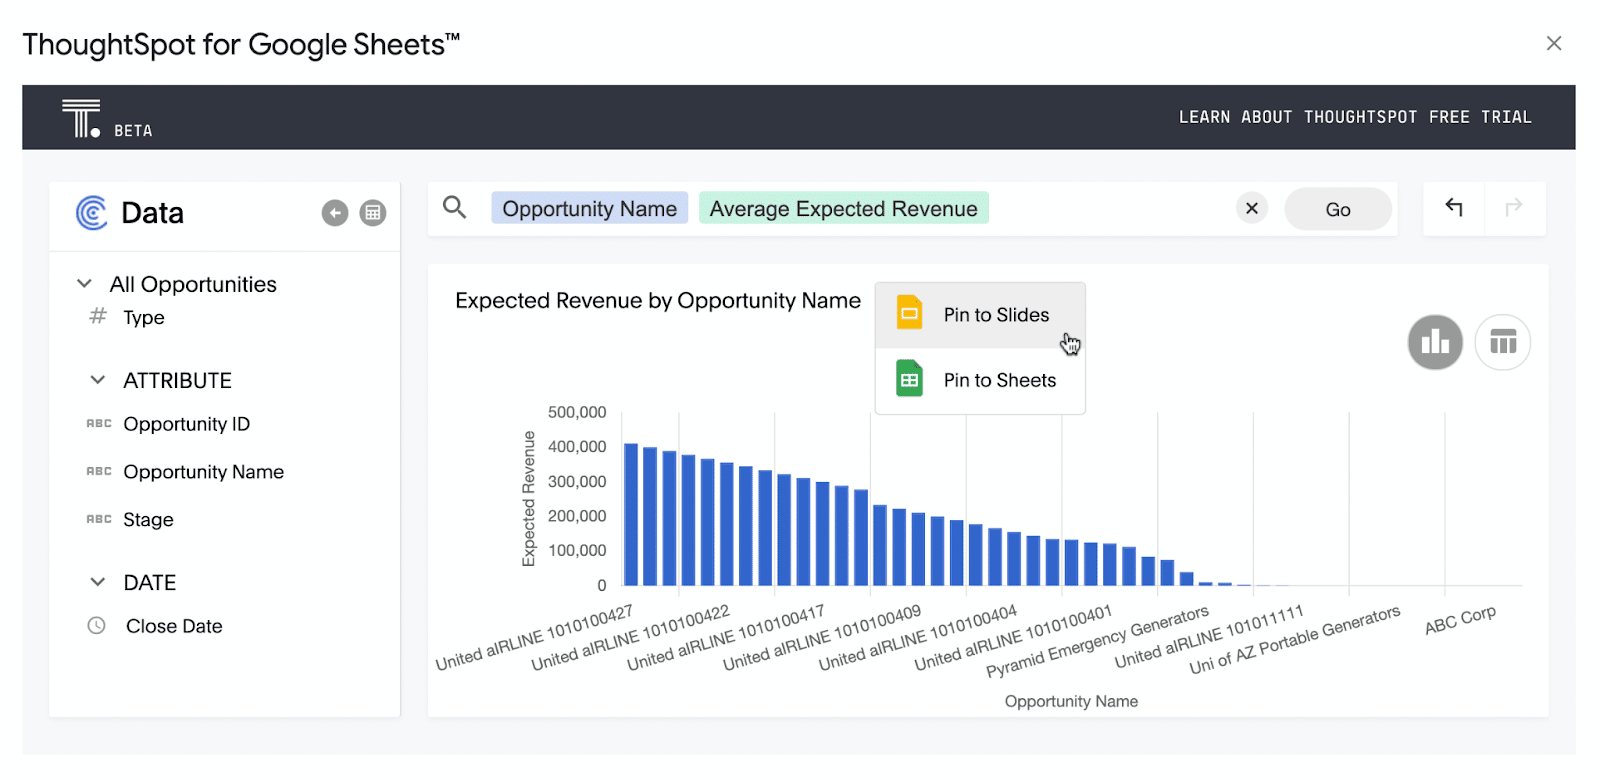
Now search for ‘Average Expected Revenue’.
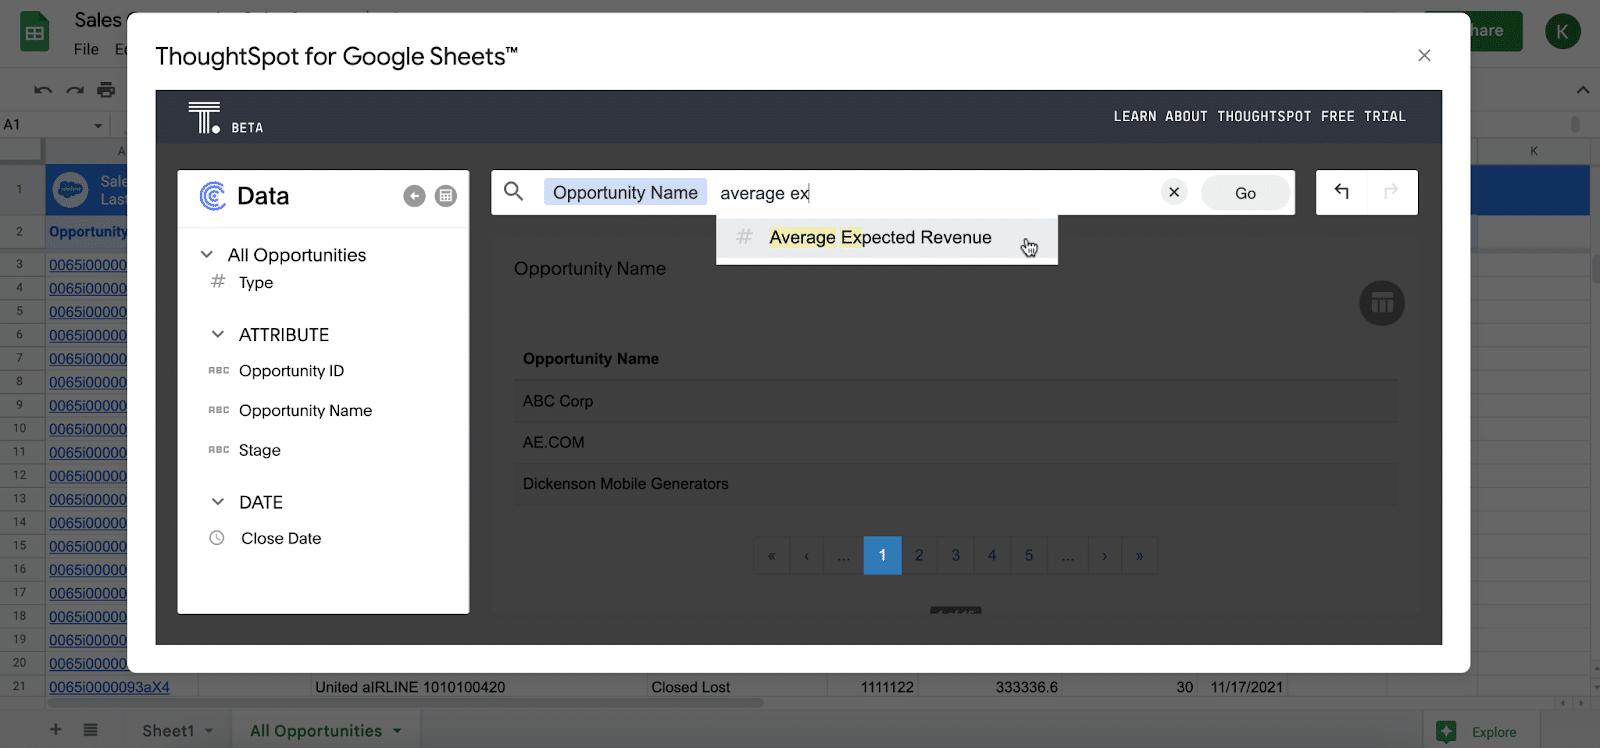
ThoughtSpot will automatically populate a graph featuring Average Expected Revenue by Opportunity Name.
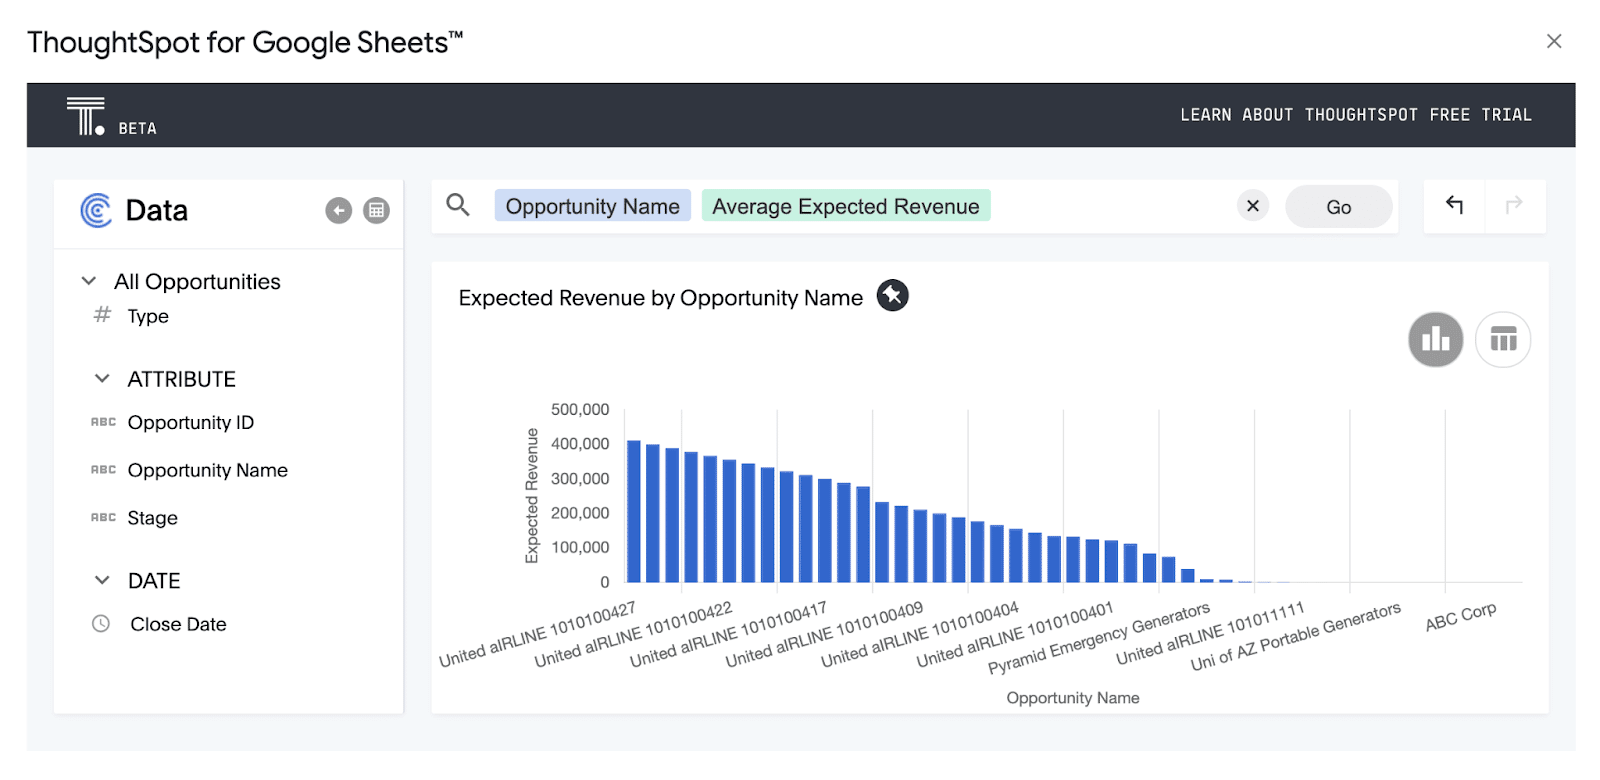
This allows you to see the average revenue expectations for each account that sales is working on.
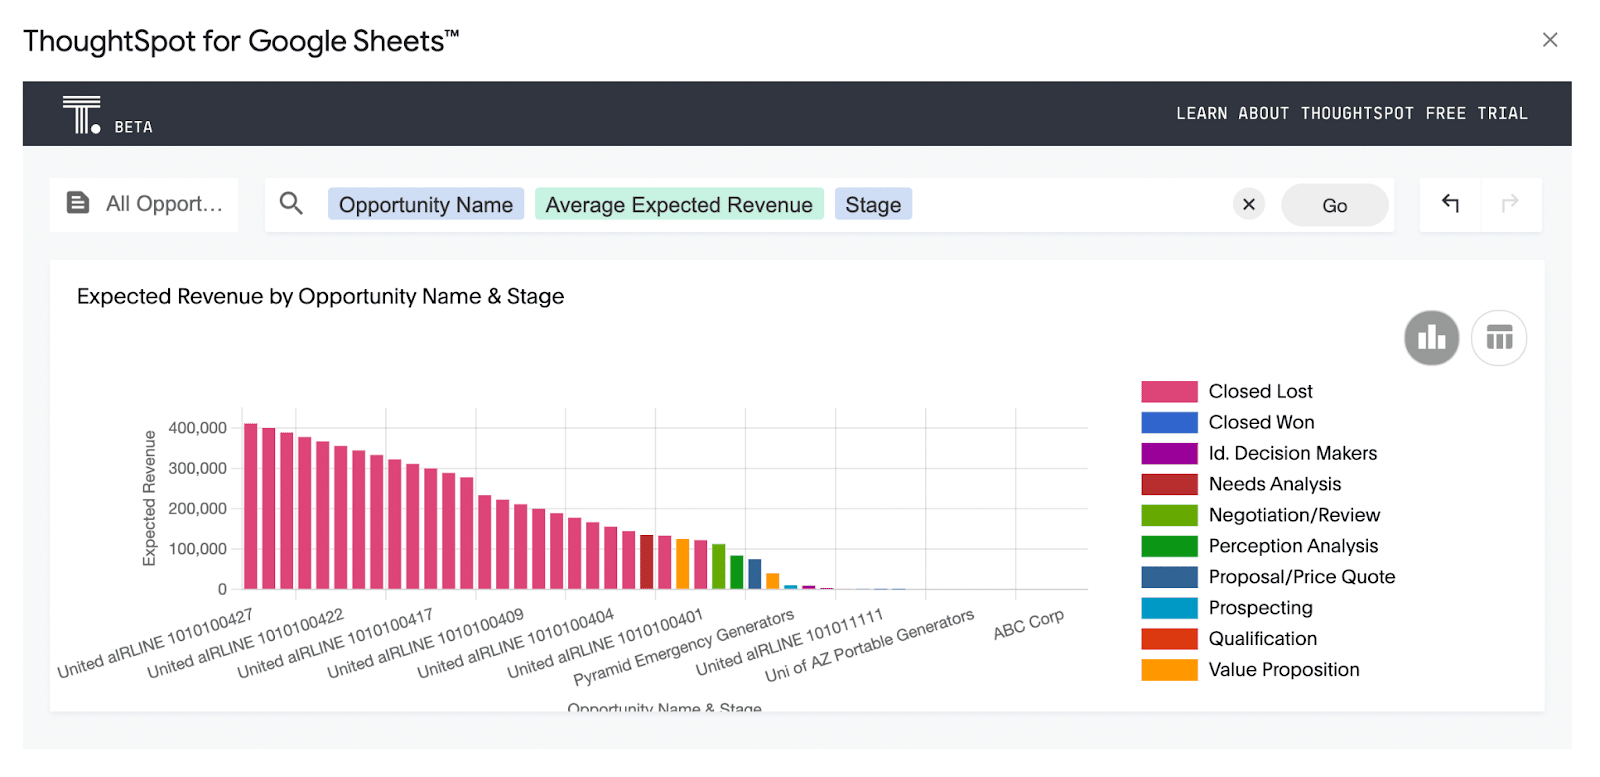
Now take it a step further — search for ‘Stage’ to associate each account with its stage in the sales cycle.
This will result in a graph that allows you to monitor average expected revenue and sales cycle stage for each account simultaneously.
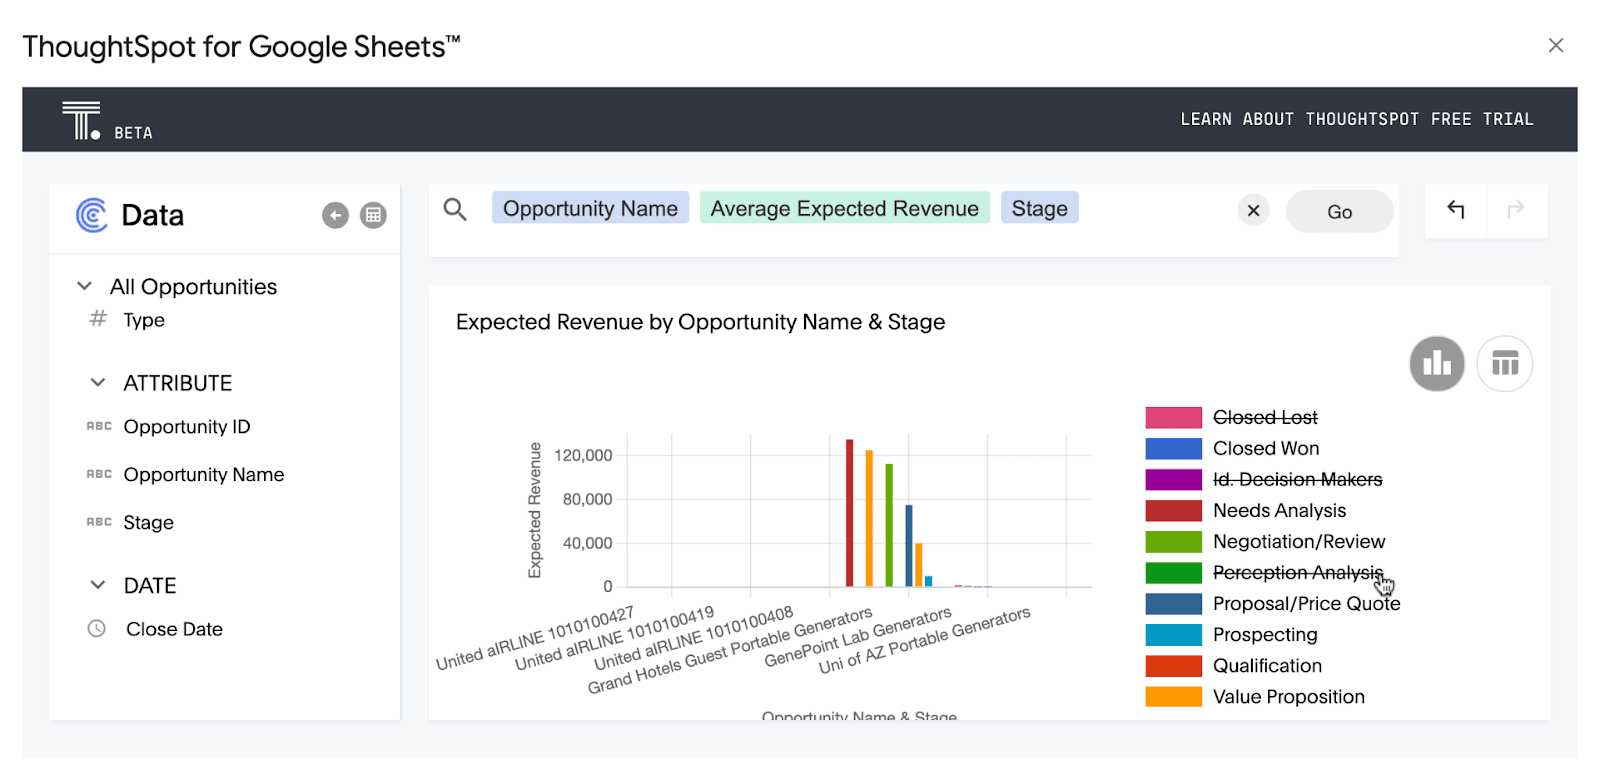
You can also remove dimensions from the graph with simple point-and-click functionality.
ThoughtSpot for Sheets makes it easy to share your findings with colleagues. Simply click the thumbtack icon above and share your analytics/visualizations to Google Slides or Google Sheets.
The entire process, from importing real-time data with Coefficient, to generating smart analytics with ThoughtSpot for Sheets, takes just a few clicks. That means no SQL, and no fancy BI tool. Business users can produce the insights they need to make critical decisions, directly from their spreadsheets.
Coefficient & ThoughtSpot: A New Frontier for Spreadsheets
The integration of Coefficient and ThoughtSpot for Sheets helps business users close the data gap. The combo allows Google Sheets users to import the real-time data and generate analytics with powerful search capabilities in a matter of clicks. For business users that don’t know SQL, the integration allows them to replicate core elements of the modern data stack without writing a single line of code.
The combination of Coefficient and ThoughtSpot is a significant leap forward in the movement toward self-service analytics. We look forward to our continued partnership with ThoughtSpot in the red-hot sector of connected spreadsheets.


