


Table of Contents
![]()
- 1. The way you manage sales pipeline is broken—here’s how to fix it for good
- 2. If your sales pipeline stages don’t make sense, your forecast won’t either
- 3. Creating a Sales Pipeline Dashboard in Google Sheets
- 4. Top 7 Sales Pipeline Metrics You Can’t Ignore
- 5. How to Build a Sales Pipeline Tracker in Google Sheets (Free Template)
- 6. Sales Funnel Templates You Can Sync Live Data Into in A Few Clicks
- 7. B2B Sales Pipeline Coverage – From Prospect to Profits (Insights from RevOps Expert)
- 8. Comparing Best Free and Paid Sales Pipeline Management Tools
- 9. 3 Quick Tips to Improve Sales Pipeline Management & Tracking
- 10. Bad CRM pipeline management slows you down. Here’s how to fix it.


Sales pipeline tracking is an integral part of any sales team. The dashboard visually represents every step of your sales process to help you understand if you’re approaching your strategic sales goals.
However, creating an automated and dynamic sales pipeline tracker is a sometimes difficult task. Core challenges like data integration and maintaining real-time updates often disrupt the process.
In this guide, we’ll demonstrate how you can easily build a sales pipeline tracker in Google Sheets by leveraging your Salesforce data.
And to make things easier, we’ve developed a free sales pipeline tracking template for Google Sheets that you can use right now!
That way, you can bypass the building process and start tracking your sales process in Google Sheets right away.
Let’s get started! Here’s a step-by-step guide on how to create a sales pipeline tracker in Google Sheets.
Video Walkthrough: How to Create a Sales Pipeline Tracker in Google Sheets
Sales Pipeline Tracking: A Step-by-Step Guide to Visualizing Your Salesforce Data
To build the sales pipeline tracker, you’ll need to import your Salesforce CRM data into Google Sheets.
But don’t waste your time manually copying-and-pasting Salesforce data into Google Sheets — use Coefficient instead.
Coefficient allows you to automatically import real-time data from your company systems into Google Sheets.
With Coefficient, you can pull live Salesforce data into Sheets and build a sales pipeline tracker on top of it. That way, your tracker is always up-to-date and ready-to-share.
Let’s install Coefficient so we can import real-time Salesforce data into Sheets and build our sales pipeline tracker.
Step 1: Install Coefficient
First, let’s install Coefficient.
Coefficient allows you to directly connect Salesforce to Google Sheets without coding or a complicated setup. The app makes exporting, importing, and syncing your live Salesforce data in Sheets easy.
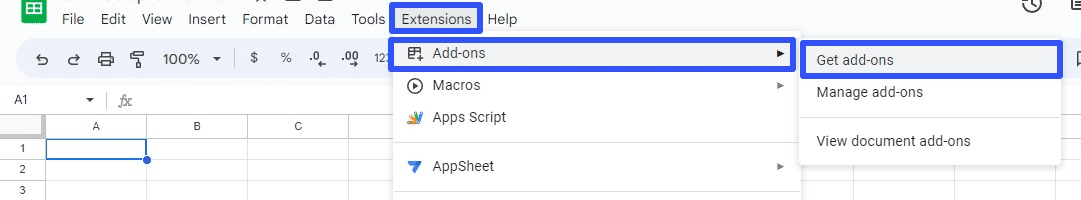
Install the Coefficient add-on by clicking the Extensions menu tab on Google Sheets. Then, select Add-ons and Get add-ons.
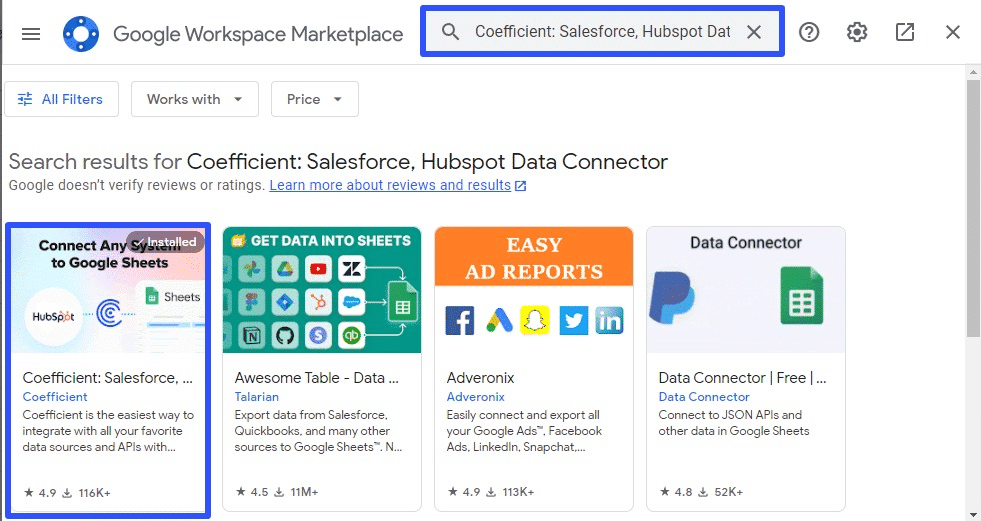
Enter “Coefficient” on the Google Workspace Marketplace pop-up window’s search bar. Select Coefficient, and go through the prompts to complete the installation.
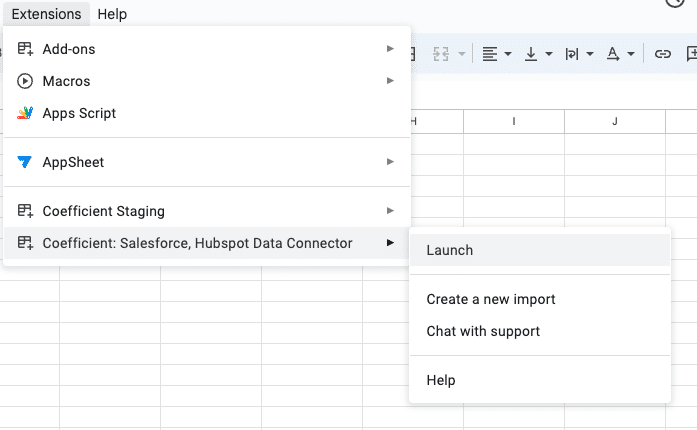
After installing the Coefficient Google Sheets add-on, return to the Extensions menu tab and launch the app.
Kick things off by launching the Coefficient app from the extensions menu in Google Sheets. Navigate to Extensions -> Coefficient -> Launch.
Step 2: Import Salesforce Data
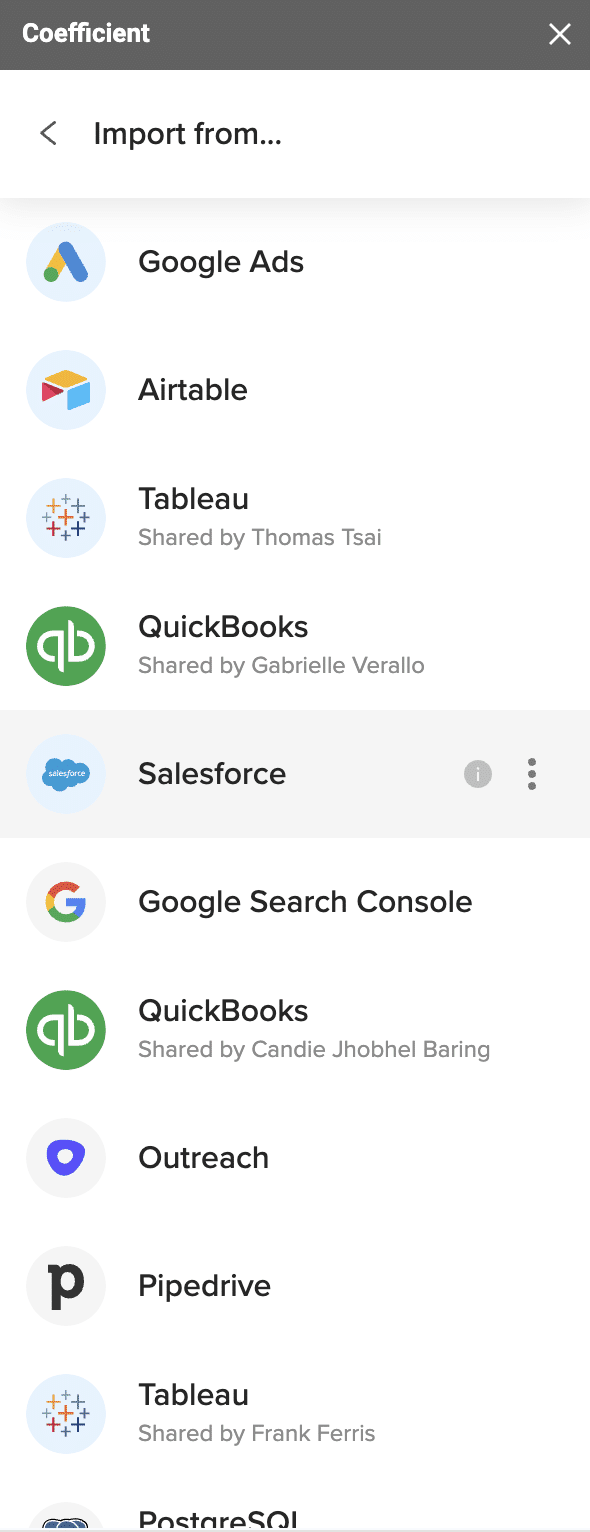
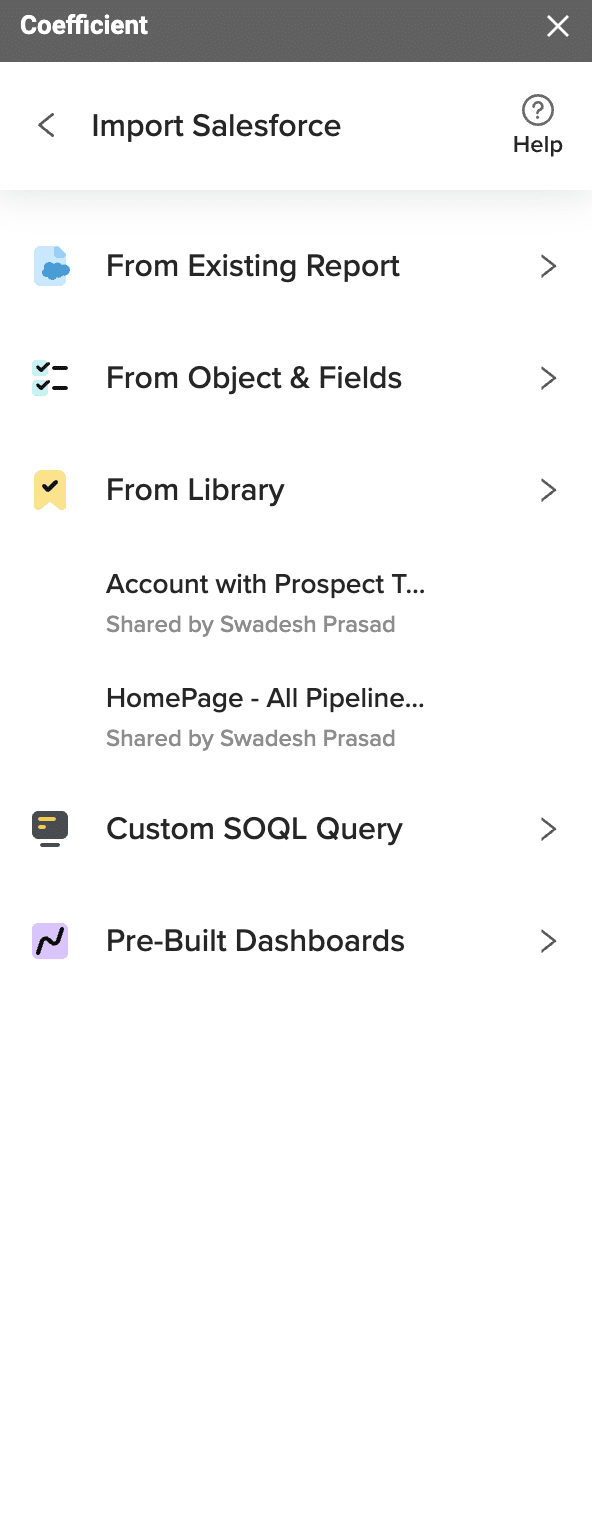
Choose ‘Import from…’ once the Coefficient sidebar launches.

Next, select Salesforce as your data source.
Click From Objects & Fields.
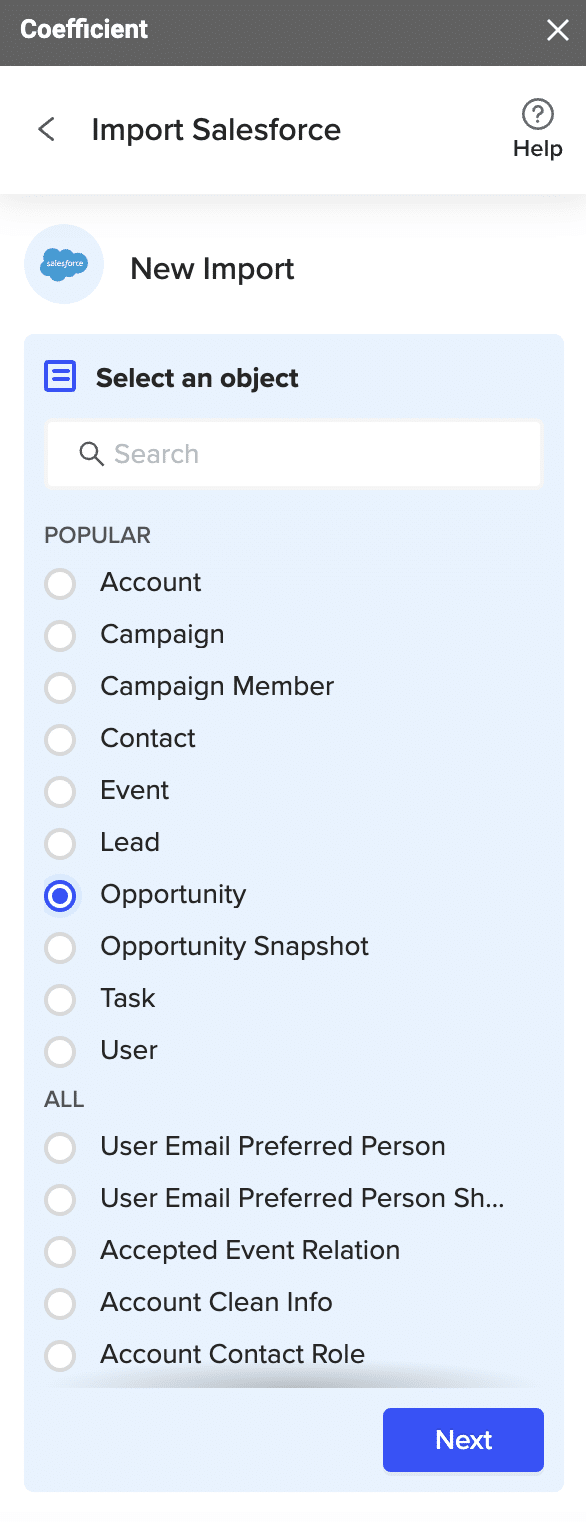
Under New Import, choose the Opportunity object.
Choose the fields you want to import. For this example, we’ll select ‘Forecast Category,’ ‘Amount,’ and ‘Close Date.’
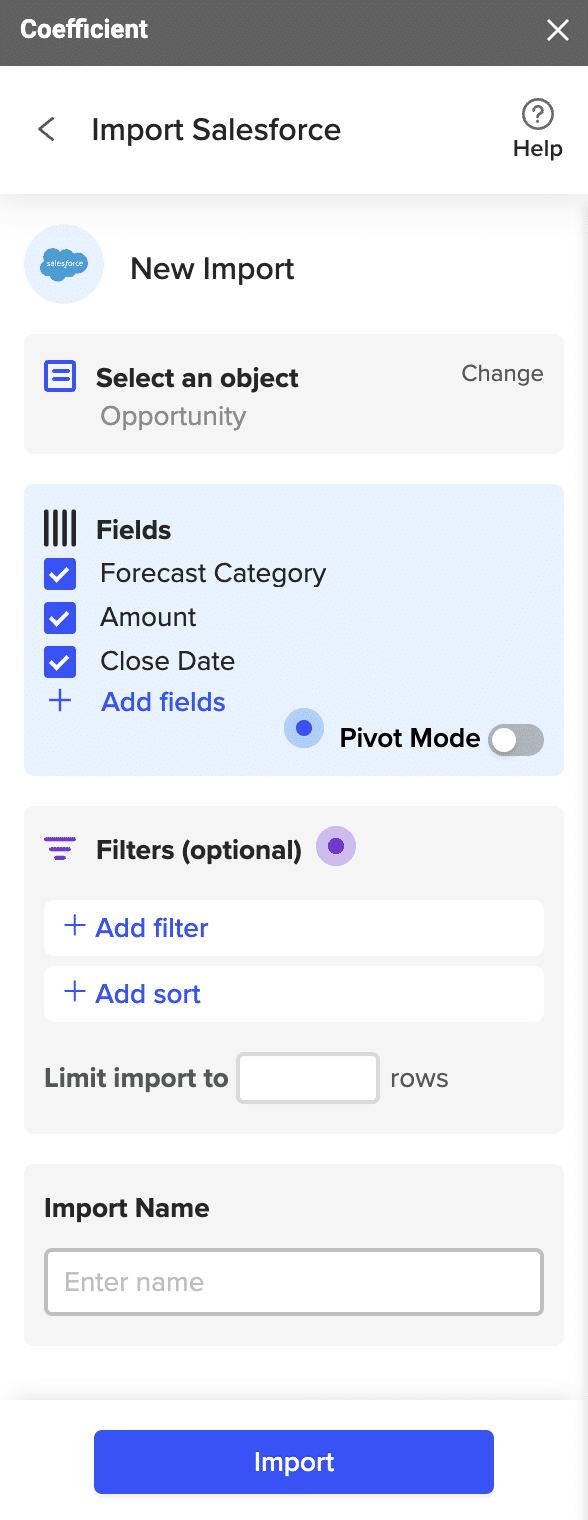
Once you’re done selecting fields, toggle Pivot Mode on.
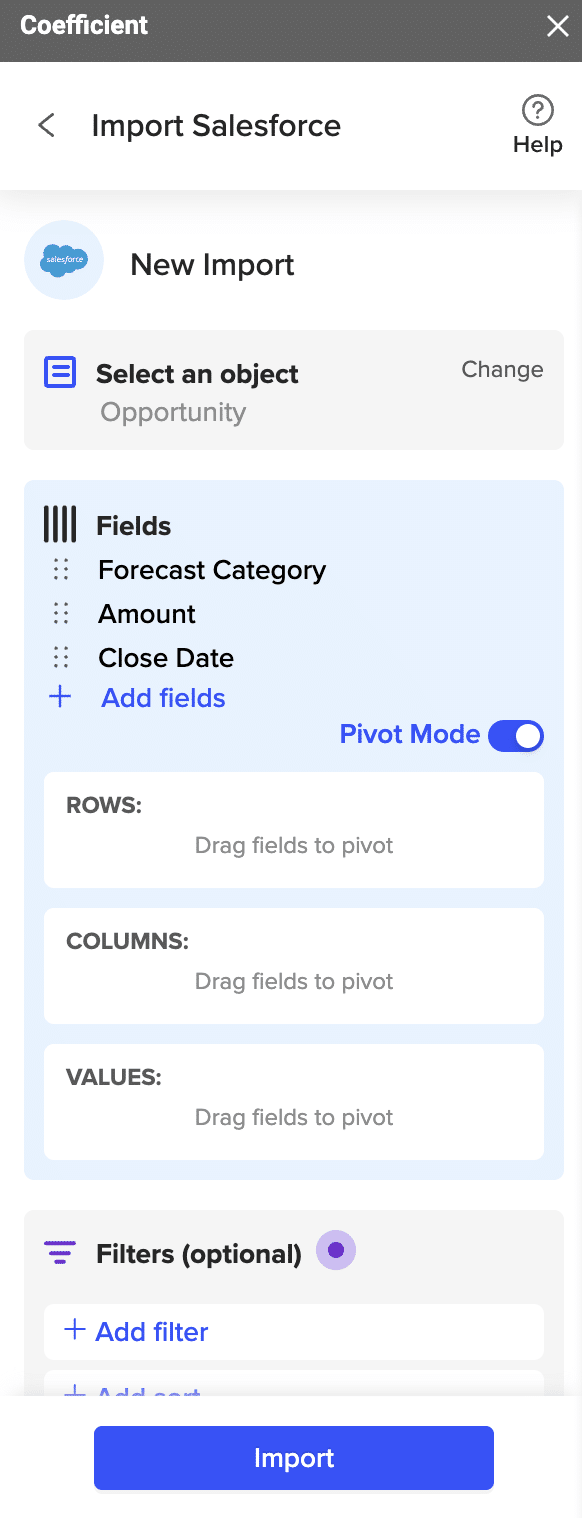
Set ‘Forecast Category’ as your row and ‘Close Date’ as your columns going across the pivot table.
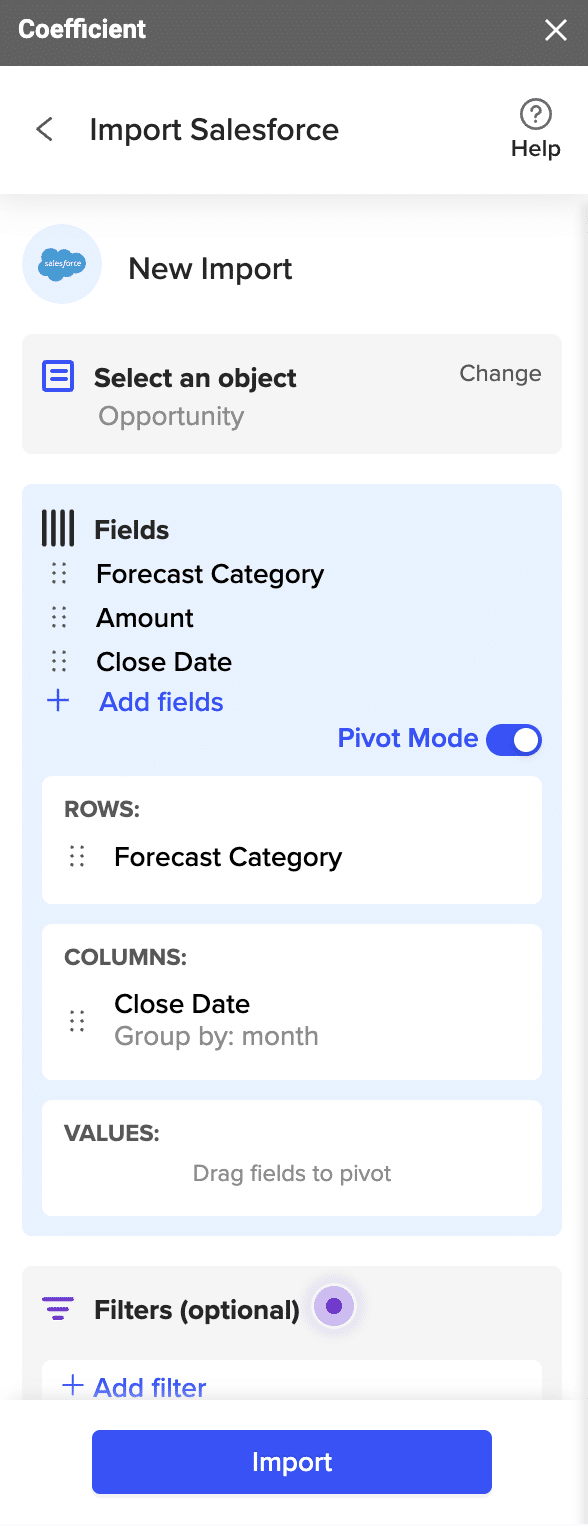
Group by month with ‘Amount’ as your value and change the dropdown to ‘Sum.’
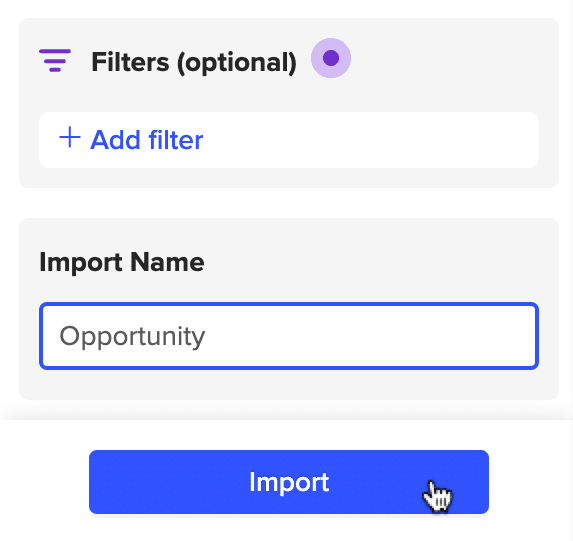
Name your import and click ‘Import.’
Step 3: Build Your Sales Pipeline Tracker
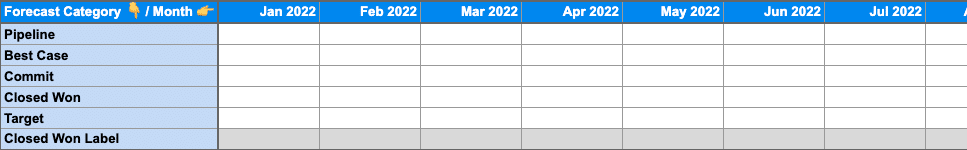
To start building your sales pipeline tracker, open a separate tab in your Google spreadsheet.
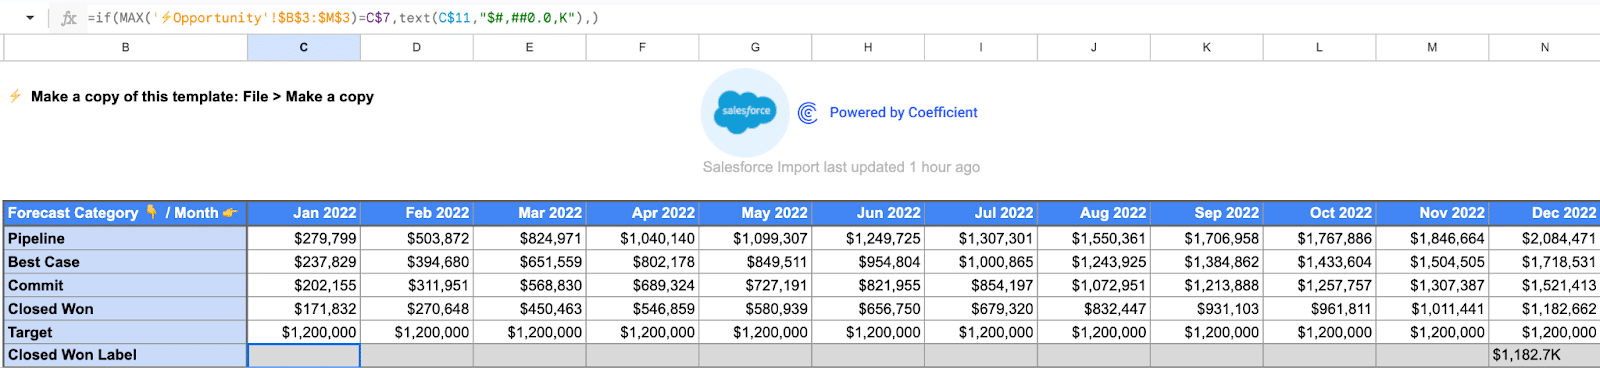
Build a table referencing your Salesforce import where ‘Forecast Category’ is in column A, and your months run across the first row.
Next, use the following formula to calculate amounts for your sales pipeline categories. Drag the formula across the months to generate the totals:
=iferror(INDEX(‘⚡️Opportunity’!$A$3:$M$7,match($B8,’⚡️Opportunity’!$A$3:$A$7,0),match(C$7,’⚡️Opportunity’!$A$3:$M$3,0)),)’=iferror(INDEX(‘⚡️Opportunity’!$A$3:$M$7,match($B8,’⚡️Opportunity’!$A$3:$A$7,0),match(C$7,’⚡️Opportunity’!$A$3:$M$3,0)),)
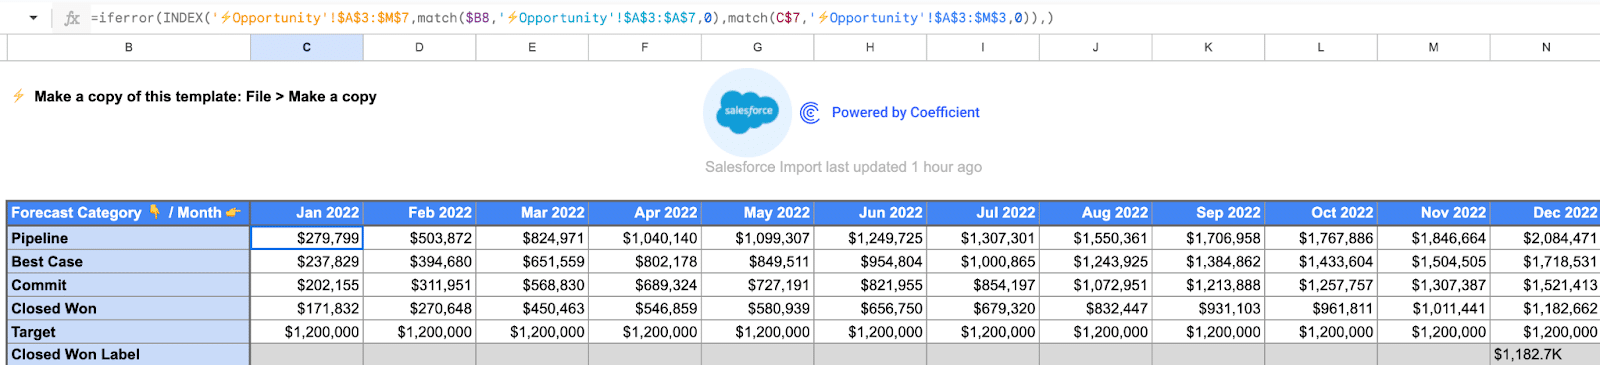
Copy this formula across the closed won label row:
=if(MAX(‘⚡️Opportunity’!$B$3:$M$3)=C$7,text(C$11,”$#,##0.0,K”),)
Step 4: Create Your Charts
Now chart your sales pipeline tracker. Highlight the entire range and go to the top nav and click ‘Insert’ -> ‘Chart.’

Change the chart from the default ‘area chart’ to a ‘combo chart.’
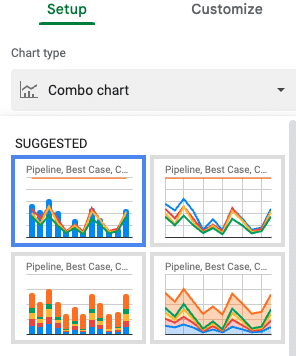
This allows us to customize the chart to showcase the sales pipeline evolution as an area chart in conjunction with a line for your target.
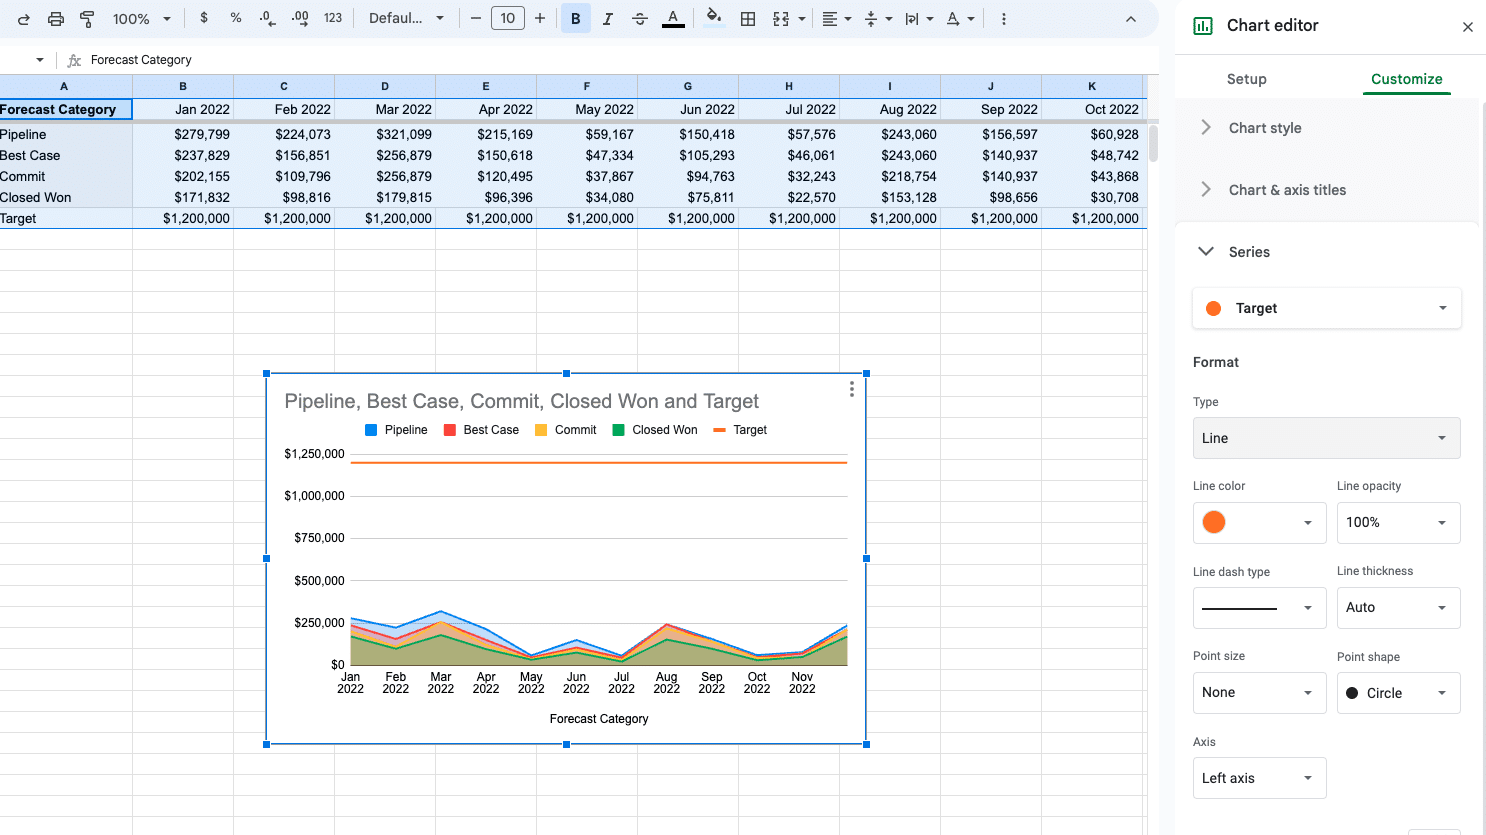
To do so, click the ‘Customize’ tab and select ‘Series.’
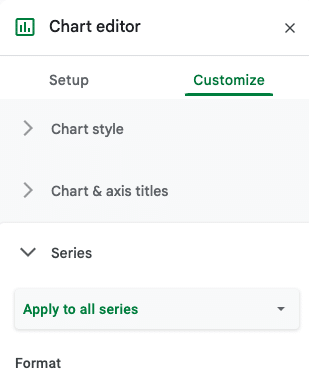
Now click the drop-down and select ‘Target.’
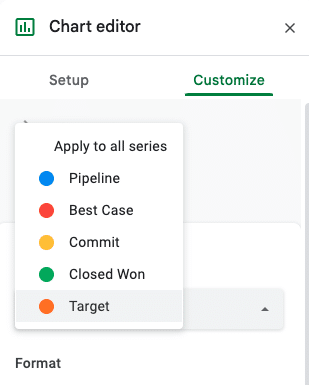
Then navigate to Format -> Type -> Line.
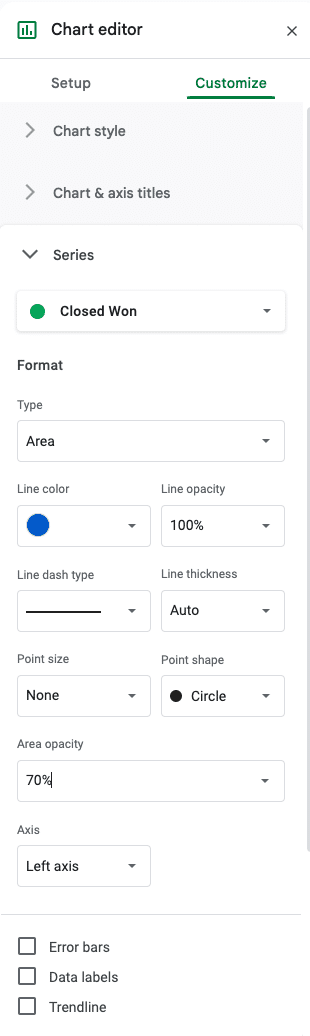
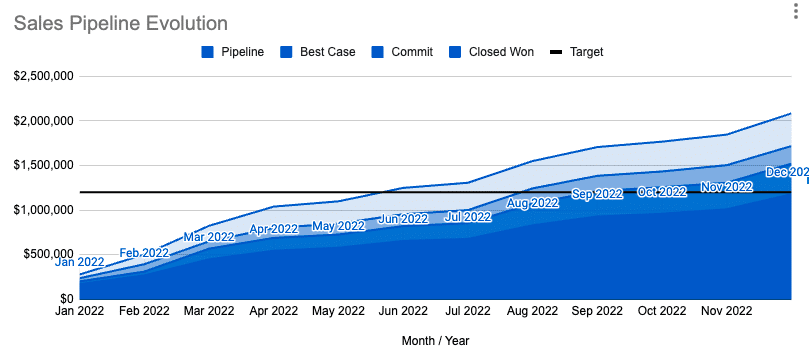
Now, go through each one of the forecast categories. Change the area opacity to differentiate between the dollar amounts between each forecast category. Select ‘Closed Won’ as the heaviest opacity like below.
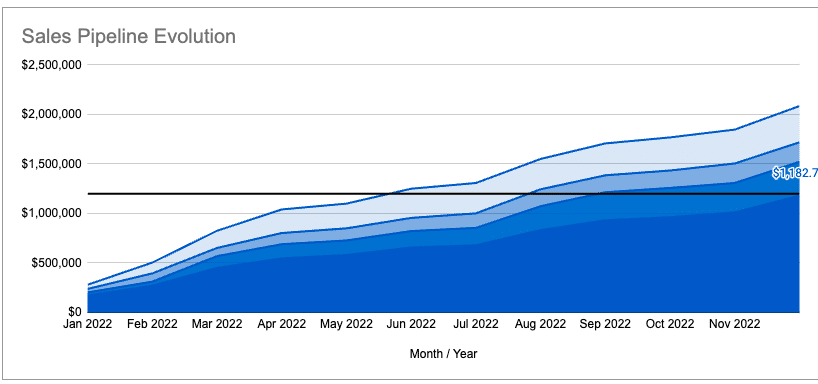
And now, as your Salesforce import grows throughout the year, you can see how the pipeline evolves with it, like below.
Let’s add the chart label. Click the 3-column periods in the top right corner.
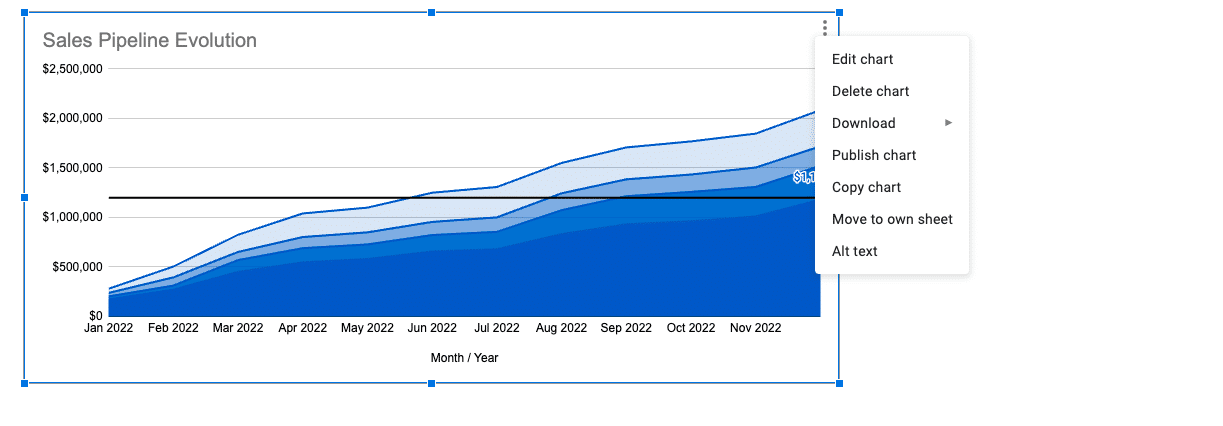
Then select ‘Edit Chart’ -> ‘Setup’ -> Scroll down to ‘Series’ -> Go to ‘Closed Won’ -> ‘Add labels.’
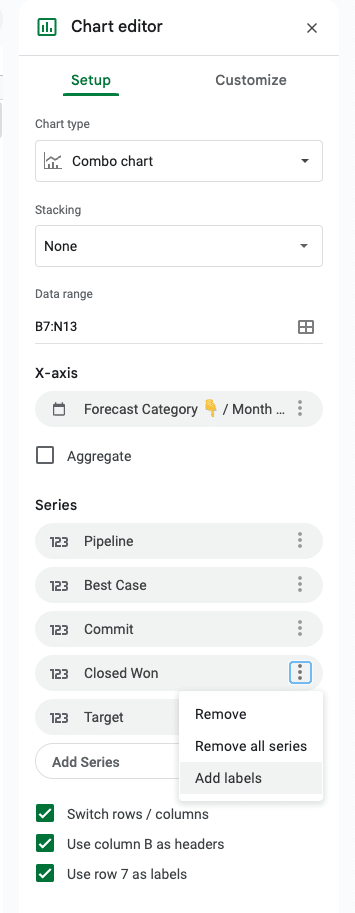
Then add the Closed Won label to the series.
In just a few minutes, you’ve brought your Salesforce data to life using the Coefficient app and Google Sheets. You can now track how your sales pipeline evolves throughout the year.
Visualize Your Sales Pipeline Tracking Faster Than Ever with Coefficient
The combined power of Coefficient and Google Sheets makes visualizing your sales pipeline tracking a breeze, offering fresh, valuable insights on your sales progress throughout the year.
Curious about how Coefficient can help streamline analysis of your Salesforce data? Get started for free with Coefficient to start leveraging your real-time Salesforce data in Google Sheets.
