The framing that gets teams into trouble: spreadsheets are bad, buy a BI tool. That is often the wrong answer. The right question is what specific problem you are trying to solve. Here is a direct answer.
Where Spreadsheets Win
Ad-hoc analysis and one-off calculations. A spreadsheet is the fastest way to answer a question nobody thought to build a dashboard for. Pull the data, run the numbers, share a tab. No setup, no waiting.
FP&A modeling where formula logic must be visible. Financial models built in Excel or Google Sheets have one property BI tools lack: the logic is transparent. Every formula is inspectable. Auditors and CFOs can trace every number back to its source.
Operational workflows where users edit data. When the job is not just viewing data but updating it, adjusting forecasts, flagging records, or approving line items. A spreadsheet is the natural interface. BI dashboards are read-only.
Small datasets where one analyst owns the file. For a team of one building a weekly report from a 5,000-row export, a spreadsheet is fast, free, and good enough.
Where Spreadsheets Break
Data is never fresh. A spreadsheet built on manual exports shows data as it was when someone last pasted it. This is the number one reason teams lose trust in spreadsheet dashboards.
Version chaos kills collaboration. The moment two people edit different copies of the same file, you have a data governance problem. Multiple versions, conflicting formulas, no audit trail.
No live view for many stakeholders. Sharing a Google Sheet with 50 executives gives them access to a file they can break. Sharing a static export gives them a snapshot they cannot trust.
Formulas break when data structure changes. If Salesforce adds a new field or changes a column order, every dependent VLOOKUP breaks silently. Someone discovers this at the worst moment.
Where BI Tools Win
Governed dashboards for large organizations. Power BI, Tableau, and Looker are built for centrally managed, access-controlled reporting. One data team publishes, hundreds of users consume, everyone sees the same governed numbers.
Visualizing massive datasets. A well-optimized Tableau workbook connected to a Snowflake query can render 50 million rows in seconds. A Google Sheet pivot table cannot.
Standardized metric definitions. BI tools with a semantic layer enforce that ‘Revenue’ means the same thing everywhere. No more conflicting definitions across teams.
Embedded analytics in customer-facing products. If your SaaS product needs to show customers their own data in a dashboard, you need an embedded BI solution.
Where BI Tools Break
Cost compounds fast. Tableau Cloud Standard: Creator $75/user/month, Explorer $42, Viewer $15. Enterprise: Creator $115, Explorer $70, Viewer $35. All billed annually. 100 viewer-only stakeholders on Standard costs $18,000/year for read-only access. Looker adds a platform fee of around $5,000/month before per-user costs.
Adoption fails without self-service. When business users cannot build their own views without filing a ticket, they stop using the tool. Research consistently shows 60 to 80% of BI dashboards go unused after the first month.
Read-only is a hard limit. BI tools show data. They do not update it. Sales leaders flagging a deal, finance managers adjusting a budget line, RevOps bulk-cleaning a CRM field: none of these are possible from a BI dashboard.

Stop exporting data manually. Sync data from your business systems into Google Sheets or Excel with Coefficient and set it on a refresh schedule.
Get Started
FP&A and modeling work does not fit. Financial models require formula-level transparency, scenario branching, and human edits. BI tools are not modeling environments.
The Middle Ground: Live Spreadsheets with AI Dashboards
Most of the reasons teams leave spreadsheets are not about spreadsheet limitations. They are about stale data. Fix the data freshness problem and Sheets or Excel covers most of what most teams actually need.
Coefficient connects 150+ data sources into Google Sheets and Excel with scheduled auto-refresh. Two-way sync is available for Salesforce, HubSpot, NetSuite, QuickBooks, Snowflake, MySQL, MS SQL Server, PostgreSQL, BigQuery and Redshift.
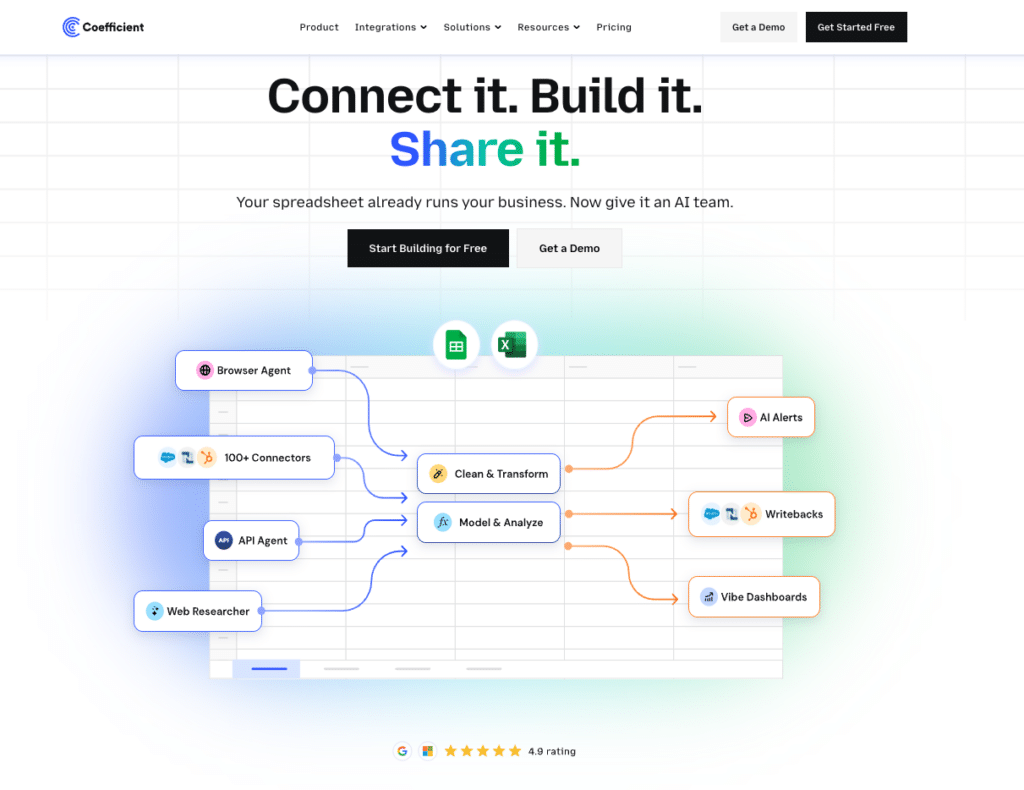
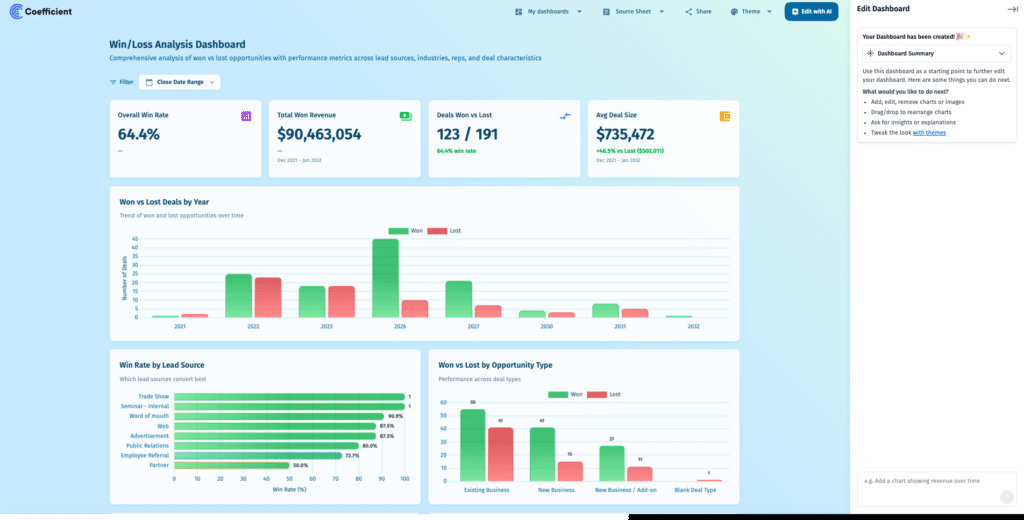
AI web dashboards can be published from spreadsheet data in plain English using Coefficient’s AI Chat. Available in both Google Sheets and Excel. Viewer seats are free. No per-user licensing for the 50 stakeholders who need to see the numbers.
Snowflake Semantic Views are surfaced directly in Sheets and Excel. Finance and ops teams query governed metrics without SQL.
Decision Framework
| Scenario | Best Answer | Key Reason |
| FP&A modeling, formula logic | Sheets + Coefficient | Auditable formulas, two-way sync |
| 50M+ row warehouse queries | BI tool | Built for scale |
| Live CRM dashboard, sales team | Sheets + Coefficient | No per-user licensing |
| Share dashboards free to 50+ people | Sheets + Coefficient | Viewer seats are free |
| Customer-facing embedded analytics | BI tool | Row-level security, embedding |
| RevOps pipeline reporting | Sheets + Coefficient | Live Salesforce/HubSpot sync |
| Enterprise governed metrics at scale | BI tool | Semantic layer, strict governance |
Pricing Comparison
| Tool | Starting Price | Per-User Fee | Free Viewer Seats | Two-Way Sync |
| Tableau (Standard) | $75/user/mo Creator | Yes | No | No |
| Power BI | $14/user/mo Pro | Yes | No | No |
| Looker | ~$5,000/mo platform | Yes | No | No |
| Coefficient | Free / $49/mo | No | Yes | Yes |
Frequently Asked Questions
When should a small business use a BI tool instead of spreadsheets?
When datasets exceed a few hundred thousand rows, when you need embedded analytics for external customers, or when enterprise row-level security is a requirement. For most teams under 200 people, live-connected spreadsheets handle the majority of reporting needs at a fraction of the cost.
Is Power BI better than Excel for reporting?
They serve different jobs. Excel is best for FP&A modeling, ad-hoc analysis, and workflows where users need to edit data. Power BI is better for governed dashboards shared across large organizations with standardized metrics. Many teams use both: Excel for modeling, Power BI for published dashboards.
Can spreadsheets connect to live data sources?
Yes. With Coefficient, Google Sheets and Excel connect to 150+ data sources including Salesforce, HubSpot, QuickBooks, Snowflake, and NetSuite. Data refreshes automatically on a schedule. No manual exports.
Bottom Line
If the problem is stale spreadsheet data and no budget for per-user licensing, try Coefficient before buying a BI tool.


