
Geckoboard is a good tool for one specific job: getting KPIs onto a TV screen or shared link with minimal setup. Its drag-and-drop interface, 90+ integrations and clean widget design make it fast to deploy for sales floors, support teams and operations leaders who want live metrics at a glance.
But it hits a ceiling quickly. Each extra dashboard, editor or viewer costs $25/month on top of your base plan. White-labeling is limited to a logo and color theme, with no custom domain. Cross-source data blending is not supported. And there is no AI-generated analysis or natural language querying at any plan level.
Here are ten alternatives covering the core Geckoboard use cases, with verified 2026 pricing and honest trade-offs for each.
| Tool | Starting price | Best for | Geckoboard capability traded |
| Coefficient | Free / $49/mo flat | Live dashboards from spreadsheet data; ops, sales, finance teams | TV display, 90+ native integrations |
| Databox | Free / $47/mo (Starter) | KPI dashboards with mobile app for business teams | TV-first layouts, flat-rate pricing |
| Klipfolio | ~$99/mo | Highly customizable dashboards for technical teams | Ease of setup, TV display |
| Whatagraph | From $229/mo | Marketing agencies needing client-ready automated reports | TV display, low-cost entry point |
| DashThis | From $49/mo | Agencies needing simple dashboard reports per client | TV display, cross-source blending |
| Looker Studio | Free | Free Google-connected dashboards | TV display, support, no white-label |
| Power BI | $14/user/mo (Pro) | Microsoft-stack enterprise BI | TV-native display, no-SQL simplicity |
| Zoho Analytics | $30/mo (Basic) | SMBs needing published-pricing BI with AI | TV display, real-time KPI focus |
| Plecto | From ~$149/mo | Gamified KPI dashboards for sales and support teams | Broader data depth, lower entry cost |
| SimpleKPI | From $99/mo | Straightforward KPI tracking for small teams | Scale, broader integrations |
Why Teams Move Off Geckoboard
Reviews on G2 and Capterra surface four consistent pain points:
• Cost at scale: each extra dashboard, editor or viewer adds $25/month to the bill. A team needing 5 dashboards, 3 editors and 20 viewers on the Essential plan can quickly hit $200+ per month.
• No cross-source data blending: you cannot merge or compare data from two different platforms in a single widget. Metrics from Salesforce and HubSpot, for example, must sit side by side rather than be combined.
• Limited customization ceiling: even on the most expensive plan, white-labeling is restricted to a logo and preset color palette. No custom domain. No removal of Geckoboard branding.
• No AI analysis: there is no natural language querying, AI-generated insight or anomaly detection at any plan level. Geckoboard displays data. It does not help you understand it.
1. Coefficient
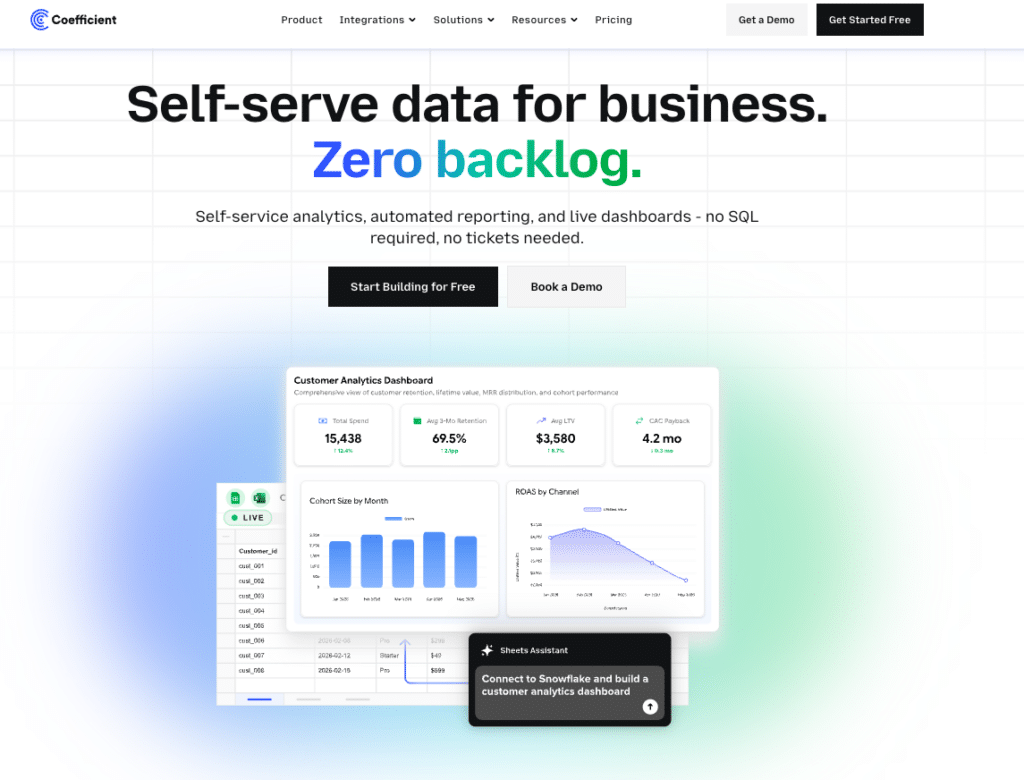
Best for: Operations, sales and finance teams that need live dashboards from their business systems without a dedicated dashboarding platform
Coefficient connects Google Sheets and Excel to 100+ business systems, including Salesforce, HubSpot, QuickBooks, NetSuite and Snowflake, with scheduled auto-refresh and two-way sync.
The standout feature in 2026 is Live Web Dashboards: describe a dashboard in plain English and Coefficient publishes it as a live, shareable web dashboard directly from your spreadsheet data. No separate dashboarding license. No platform to learn. The dashboard stays current automatically as your connected data refreshes on schedule.
Where this directly addresses Geckoboard’s limits: there are no per-viewer fees. Sharing a live dashboard link with a sales floor, an executive team or external stakeholders does not change your monthly bill. The data layer is richer too. Because Coefficient pulls live data from the same source systems your team uses, not just the data Geckoboard’s limited connector can surface, the dashboards reflect what is actually in your CRM or ERP rather than a snapshot of selected fields.
Finance managers, RevOps leads and operations teams get BI-quality dashboards through the spreadsheet environment they already work in. No new interface to learn. No server to maintain.
Pros
• Live Web Dashboards publishes live, shareable web dashboards from spreadsheet data with no separate platform license.
• No per-viewer fees. Share a dashboard with 50 people and the monthly bill does not change.
• Two-way sync pulls live data from 100+ systems and pushes updates back to source systems.
• No infrastructure to manage. Installs as a browser extension with no hosting or upgrade cycle.
• Flat-rate pricing. Predictable cost regardless of viewer count or dashboard count.
Cons
• Not a dedicated TV display platform. No native TV pairing mode like Geckoboard’s Send to TV feature.
• Requires Google Sheets or Excel as the working environment.
• 90+ Geckoboard-native integrations are not directly replicated; Coefficient connects to systems via its own connector library.
Pricing: Free plan available. Paid plans from $49/month flat, no per-viewer fees. See coefficient.io/pricing.
“Coefficient automated everything. Instead of manually exporting data every day, I just sit back and watch the data update automatically.” — Christian Budnik, FP&A Analyst, Solv
2. Databox
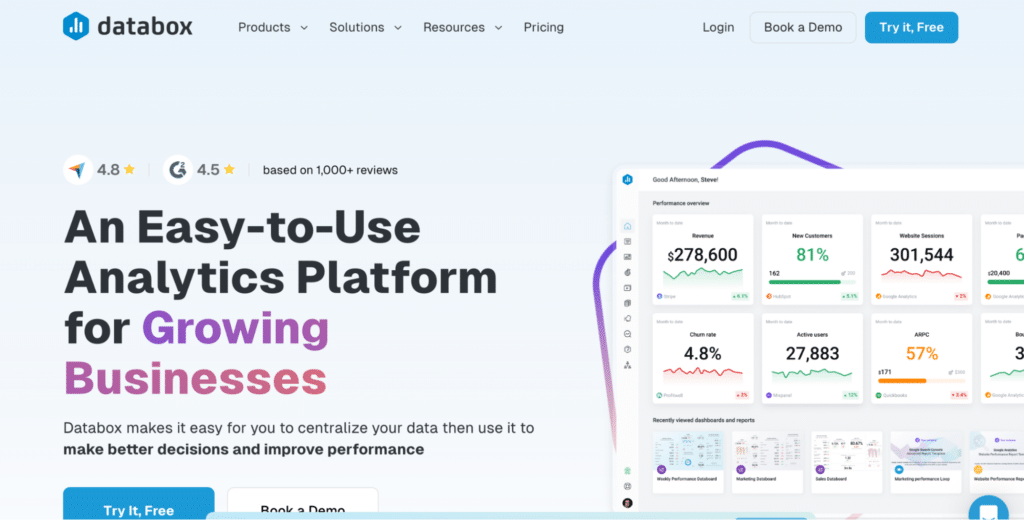
Best for: Business teams and agencies that need KPI dashboards with a mobile app, goal tracking and AI analysis
Databox is the most direct Geckoboard alternative for teams that want a dedicated KPI dashboarding tool with more analytical depth. It connects to 120+ data sources and includes a free tier with 3 data sources and basic metrics. Paid plans add unlimited dashboards, hourly data refresh, goal tracking, anomaly alerts and, on higher tiers, AI-generated performance summaries.
The key advantage over Geckoboard: no per-viewer fees on any plan. Unlimited users are included at every paid tier. The mobile app is genuinely strong, with clean iOS and Android apps that give executives live KPI access without opening a laptop. Databox also has a larger connector library than Geckoboard and includes a data prep layer for merging and transforming data across sources.
The watch point is per-data-source billing. Starter and Professional plans include 3 sources. Each additional source costs $5.60/month on annual billing. A marketing team connecting 8 platforms is already paying $28/month in source fees on top of the plan price. AI summaries are only available on the Growth plan ($399/month annually) and above.
Pros
• No per-viewer fees. Unlimited users on all paid plans.
• Strong mobile app for iOS and Android with live metric access.
• 120+ data source connectors including Google Analytics, HubSpot, Salesforce and Shopify.
• Goal tracking, anomaly alerts and AI performance summaries (Growth and above).
• Free tier available for light evaluation.
Cons
• Per-data-source billing adds up fast. Each source beyond the plan limit costs $5.60/month.
• AI summaries locked to Growth plan at $399/month, not available on Starter or Professional.
• No TV display mode as polished as Geckoboard’s native TV pairing.
• Support responsiveness on lower tiers draws consistent criticism in reviews.
Pricing: Free (3 data sources); Starter $47/month (annual); Professional $159/month; Growth $399/month. Extra sources $5.60/month each. See databox.com/pricing.
3. Klipfolio
Best for: Technical teams that need highly customizable dashboards with formula-based data transformation
Klipfolio is the most technically flexible Geckoboard alternative on this list. Its Klips product connects to 130+ data sources and allows formula-based data transformations, custom REST API connections and SQL queries for pulling and manipulating data. Analysts who want to apply calculations, filter logic and cross-source comparisons directly in the dashboard have more control in Klipfolio than in Geckoboard.
The tradeoff is setup time. Building a custom connection in Klipfolio requires SQL query knowledge, REST API configuration and familiarity with Klipfolio’s formula syntax. Each visualization is built individually before being added to a dashboard. Reviews consistently note that initial setup takes significantly longer than Geckoboard, and that teams often need a data analyst or developer to maintain more complex dashboards.
PowerMetrics, Klipfolio’s newer product, is designed to be more accessible for non-technical users and focuses on centralized metric definitions rather than custom-built widgets.
Pros
• 130+ data source connectors with SQL query and REST API support for custom connections.
• Formula-based data transformation inside the platform without a separate ETL tool.
• Both Klips (flexible/technical) and PowerMetrics (metric-centric) products in one subscription.
• Long track record and active community with extensive documentation.
Cons
• Steep setup learning curve. Custom connections require SQL and API knowledge.
• Building each visualization individually before placing on a dashboard takes time.
• Pricing is not fully transparent. Plans require contacting Klipfolio for exact current rates.
• Less intuitive than Geckoboard for non-technical users.
Pricing: Klips from approximately $99/month. PowerMetrics plans vary. See klipfolio.com/pricing.
4. Whatagraph
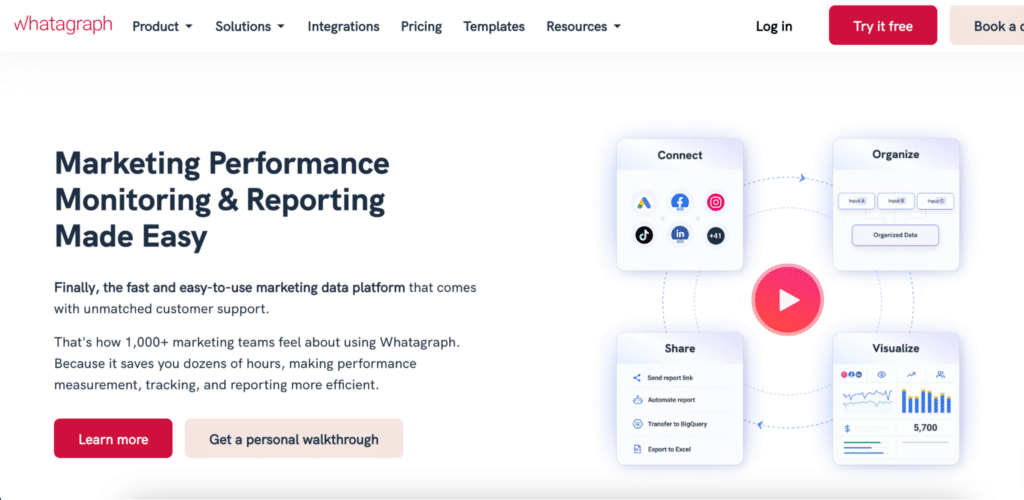
Best for: Marketing agencies that need automated, client-ready cross-channel reports with white-label branding
Whatagraph is built for marketing agencies running reporting at scale. It connects to 60+ marketing platforms, blends data across sources (combining Google Ads and Meta Ads spend into a single ROAS metric, for example), and delivers automated, branded reports to clients on a schedule. Unlimited users and unlimited dashboards are included on all plans.
The key advantage over Geckoboard: full white-labeling. Custom domain, custom colors, custom headers, custom fonts and the ability to remove Whatagraph branding entirely. For agencies whose clients see the reports, this matters. Whatagraph also supports cross-source data aggregation, custom formulas and a data organization layer for standardizing metrics across different clients with different tool stacks.
The main trade-off is price. Plans start at $229/month and require a custom quote beyond the entry tier. Whatagraph is not positioned as a lightweight TV dashboard tool. It is a reporting platform for agencies, not a real-time operations display.
Pros
• Full white-labeling including custom domain, branding removal and custom colors.
• Cross-source data blending for unified metrics across platforms.
• Unlimited users and unlimited dashboards on all plans.
• Automated client report delivery via email, link or scheduled PDF.
• 60+ marketing platform integrations with stable, maintained connectors.
Cons
• Entry pricing at $229/month puts it well above Geckoboard for small teams.
• Not a real-time TV display tool. Optimized for scheduled client reporting, not live operational dashboards.
• Connector coverage focuses on marketing. Less useful for operations, sales CRM or finance data.
Pricing: From $229/month. Custom pricing on higher tiers. See whatagraph.com/pricing.
5. DashThis
Best for: Agencies and marketers that need fast, template-driven dashboard reports per client
DashThis is the simplest agency reporting tool on this list. It connects to 30+ marketing platforms and gives teams pre-assembled templates for SEO, PPC, social and email reporting. Unlimited users and unlimited data sources are included on all plans. The main appeal is speed: most users can build a complete client dashboard from a template in under 30 minutes.
Pricing is based on the number of dashboards, not users. As of April 2026, DashThis is updating its pricing model to scale by both data sources connected and dashboard count. The starting plan covers 3 dashboards from $49/month. For agencies that need dozens of client dashboards, costs scale accordingly.
DashThis does not support cross-source data blending, custom formulas or deep data transformation. It is a clean, fast reporting surface, not a data analysis platform. For teams that need metric calculations across sources, Whatagraph or Klipfolio are more capable options.
Pros
• Plug-and-play templates for common marketing reports mean fast setup.
• Unlimited users on all plans.
• Clean, client-presentable output with white-label options.
• AI Insights layer automatically generates narrative analysis for dashboards.
Cons
• No cross-source data blending or custom calculated metrics.
• Pricing scales by dashboards, which can become expensive for agencies managing many clients.
• 30+ integrations covers marketing well but excludes CRM, finance and operations tools.
• Not suited for real-time operational KPI display.
Pricing: From $49/month (3 dashboards). Scales by dashboard count. See dashthis.com/pricing.
6. Looker Studio
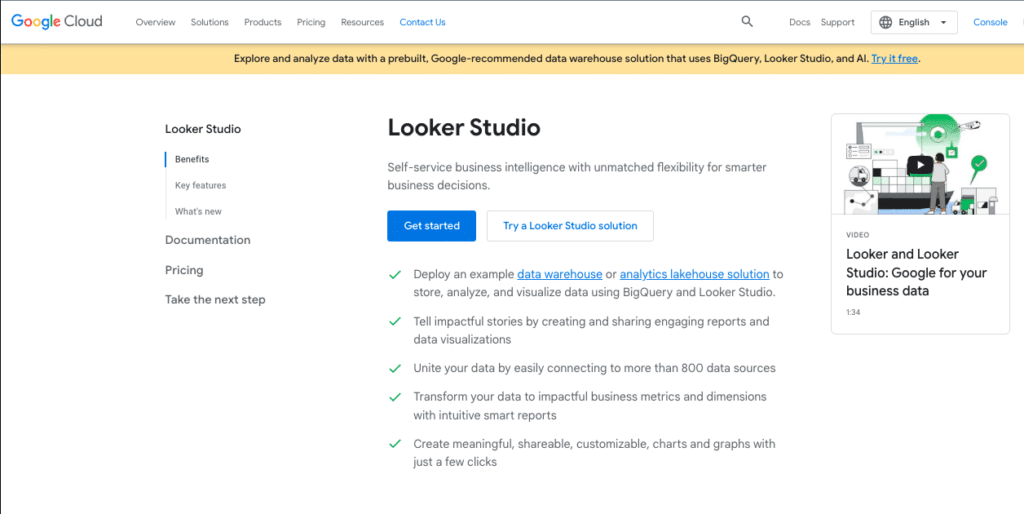
Best for: Teams that need free, shareable dashboards built primarily on Google-connected data sources
Looker Studio (formerly Google Data Studio) is completely free with no user limit and no feature tiers. It connects to 200+ data sources including Google Analytics, Google Ads, BigQuery, Salesforce and MySQL. For teams whose dashboards primarily rely on Google data, setup is frictionless.
It does not have TV display mode, white-label capability, row-level security or AI-generated insights. Connector quality drops significantly for non-Google sources. It is a good fit for teams that need simple, shareable dashboards at zero cost. For teams that need live CRM or ERP data alongside marketing data, the connector reliability outside the Google ecosystem is a recurring issue.
Note: Looker Studio and Looker (Google’s enterprise BI platform) are entirely different products with different pricing and capabilities. Looker Studio is free. Looker starts at approximately $5,000/month.
Pros
• Completely free. No user limit, no feature tiers.
• 200+ data source connectors, especially strong for Google products.
• Easy collaboration inside Google Workspace.
• No hosting or maintenance required.
Cons
• No TV display mode for office screens.
• No white-label, no custom domain, no branding removal.
• Connector reliability outside the Google ecosystem is inconsistent.
• No AI analysis, no anomaly detection, no natural language querying.
Pricing: Free. Looker Studio Pro at $9/user/month for additional governance. See lookerstudio.google.com.
7. Microsoft Power BI
Best for: Microsoft-stack organisations that need enterprise BI depth rather than a simple KPI display tool
Power BI is the most capable BI platform on this list. Pro at $14/user/month makes it the most affordable per-user enterprise option. It connects natively to Excel, SharePoint, Teams, Dynamics 365 and Azure, and includes DAX-based data modeling, calculated columns and complex metric definitions.

Stop exporting data manually. Sync data from your business systems into Google Sheets or Excel with Coefficient and set it on a refresh schedule.
Get Started
Compared to Geckoboard, Power BI offers significantly more analytical depth: cross-source joins, complex calculated measures, row-level security, and Copilot AI for natural language querying and report generation. The tradeoff is the learning curve. Non-technical users need training before building their first report. The interface is more complex than Geckoboard and not optimized for simple TV display out of the box.
Power BI is worth considering when a team needs more than KPI display, particularly when analytical depth, governance and integration with Microsoft 365 are requirements.
Pros
• Most affordable enterprise BI per-user pricing at $14/user/month.
• Native Microsoft 365 integration: Excel, Teams, SharePoint and Dynamics.
• DAX data modeling and cross-source joins for complex metric definitions.
• Copilot AI generates reports from natural language prompts.
Cons
• Significant learning curve for non-technical users.
• Not optimized for simple TV KPI display.
• Copilot AI add-on costs an additional $30/user/month.
• Overkill for teams that only need live KPI visibility without analytical depth.
Pricing: Free Desktop; Pro $14/user/month; Premium Per User $24/user/month (annual). Copilot add-on $30/user/month. See powerbi.microsoft.com/pricing.
8. Zoho Analytics
Best for: SMBs and Zoho ecosystem users that need affordable published-pricing BI with AI included
Zoho Analytics is one of the few BI platforms with fully transparent pricing. Plans run from $30/month to $575/month on annual billing, based on per-account user pools rather than per-seat fees. Zia AI provides natural language querying across all plan tiers at no additional cost.
It supports 500+ connectors, cross-source data blending, pivot tables and formulas. For teams already using Zoho CRM, Zoho Books or Zoho Desk, the integration overhead is minimal. It also has TV mode for office display, making it one of the few tools on this list that covers both the analytical depth gap and the TV display use case that Geckoboard serves well.
Performance degrades noticeably at very large row counts (10M+), per consistent G2 feedback. Visualization depth falls short of Power BI or Tableau for complex charts. But for SMBs that need more analytical capability than Geckoboard at a transparent, predictable price, Zoho Analytics is a strong candidate.
Pros
• Fully published, transparent pricing. No sales call needed for standard plans.
• Zia AI included on all plans for natural language querying at no extra cost.
• 500+ connectors with cross-source data blending.
• Supports TV display mode for office screens.
• Per-account pricing, not per-seat, keeps cost predictable.
Cons
• Performance degrades noticeably above 10 million rows per G2 reviewers.
• Visualization depth falls short of Tableau or Power BI for complex charts.
• Deeper integration of third-party tools outside the Zoho ecosystem requires more configuration.
Pricing: Free (2 users, 10K rows); Basic $30/month; Standard $60/month; Premium $145/month; Enterprise $575/month (annual). See zoho.com/analytics/pricing.
9. Plecto
Best for: Sales and customer support teams that want gamified KPI dashboards with leaderboards, badges and live contest features
Plecto takes a different angle to KPI dashboards: it turns performance metrics into a game. Leaderboards, badges, real-time competitions and animated scoreboards sit alongside standard KPI widgets. For sales floors and support teams where individual performance visibility drives motivation, this is a meaningful differentiator over Geckoboard’s straightforward display approach.
It supports 100+ integrations including Salesforce, HubSpot, Zendesk, Aircall and Pipedrive. TV display is natively supported. The mobile app gives reps live visibility into their own scores without opening a dashboard on a shared screen.
Plecto positions itself as a motivation platform more than a dashboarding tool. If the primary goal is to get a sales team competing against each other and watching live rankings update in real time, it does this better than any other tool on this list. Pricing starts around $149/month for small teams; see plecto.com/pricing for current plan details.
Pros
• Leaderboards, badges and real-time competitions built into the core product.
• Native TV display optimized for office screens and sales floors.
• 100+ integrations including Salesforce, HubSpot, Zendesk and Aircall.
• Mobile app gives individual reps visibility into their own performance.
Cons
• Gamification focus makes it less suitable for finance, operations or executive reporting use cases.
• Higher entry price than Geckoboard for small teams.
• Less flexibility for cross-source data analysis or custom metric calculations.
Pricing: From approximately $149/month for small teams. See plecto.com/pricing.
10. SimpleKPI
Best for: Small teams that want dedicated KPI tracking software with a clean interface and no technical setup
SimpleKPI is built specifically around KPI tracking rather than general dashboarding. Teams define their KPIs, set targets and track progress over time with trend charts and historical comparisons. The interface is clean and accessible for non-technical users. It connects to the key data sources most small business teams need: spreadsheets, databases and common SaaS tools.
Compared to Geckoboard, SimpleKPI puts more emphasis on goal-setting and performance tracking against targets rather than live real-time display. It is a better fit for monthly or weekly business review meetings than for a continuously updating office TV screen.
Plans start at $99/month and include unlimited users. See simplekpi.com/pricing for current details. A 10-day free trial is available.
Pros
• Built specifically for KPI tracking with goal-setting and target progress built in.
• Unlimited users on all plans.
• Clean, accessible interface for non-technical team members.
• 10-day free trial without a credit card.
Cons
• Not optimized for real-time TV display of live operational metrics.
• Fewer integrations than Geckoboard or Databox.
• Less suited for teams that need marketing, CRM and operational data in a single view.
Pricing: From $99/month. Unlimited users. See simplekpi.com/pricing.
Which Geckoboard Alternative Should You Choose?
The right replacement depends on what Geckoboard is failing to deliver for you.
• Viewer-heavy team paying per-editor and per-dashboard: Databox or Coefficient. No per-viewer fees on either.
• Marketing agency needing client-ready reports with white-label: Whatagraph or DashThis or Coefficient.
• Technical team needing formula-based data transformation: Klipfolio.
• Free dashboards for Google-connected data: Looker Studio or Coefficient.
• Microsoft-stack team needing more analytical depth: Power BI.
• SMB wanting published BI pricing with AI and TV mode: Zoho Analytics.
• Sales or support team wanting gamified KPI competitions: Plecto.
• Small team needing dedicated KPI tracking with targets: SimpleKPI.
• Operations or finance team needing live dashboards from CRM or ERP without a new platform: Coefficient Live Web Dashboards.
If the core need is live operational data displayed in a shareable dashboard that updates automatically, with no per-dashboard and no per-viewer fees, Coefficient is worth trying before committing to another paid dashboarding subscription. Connect your first data source free and describe the dashboard you need in plain English.
Coefficient connects Google Sheets and Excel to 100+ business systems with scheduled auto-refresh and two-way sync. Live Web Dashboards publishes live, shareable web dashboards from your spreadsheet data. Free plan available. Paid plans from $49/month flat, no per-dashboard or per-viewer fees.


