


Table of Contents
![]()
- 1. 10 Best CRM Reporting Tools for 2026
- 2. Sales Velocity Tracking: How to Calculate and Track Overtime in Google Sheets
- 3. Average Deal Size: How to Measure + Optimize Forecasting (With Template)
- 4. How You Can Measure and Optimize Pipeline Velocity
- 5. How You Can Measure and Optimize Win Rate Today (2024 Guide)
- 6. Quota Attainment: How to Measure in 2026 (With Template)
- 7. Top 10 Sales Metrics to Track in 2025
- 8. How to Analyze Sales Rep Performance in Google Sheets
- 9. 5 Sales Revenue Metrics to Measure Success in 2024 (With Templates)


Average deal size is a crucial metric for sales operations. It guides strategic decisions, provides insights into sales efficiency, and helps forecast revenue.
Coefficient’s spreadsheet dashboard templates give you real-time access to this critical data, making it easy to track, analyze, and act on.
In this blog, we’ll explore what average deal size is, how to calculate it, and how Coefficient can help you leverage it to supercharge your sales strategy.
Understanding Average Deal Size
Average deal size represents the average revenue your company expects from each closed deal. It’s a key indicator of sales efficiency, product market fit, and customer value.
Here are the factors influencing average deal size:
- Product/Service Value: Higher-value offerings lead to larger deals, as customers invest more for solutions that provide substantial benefits or solve critical pain points.
- Target Market and Customer Segments: Enterprise-level clients or customers in certain industries may have larger budgets and more complex needs, resulting in higher-value deals compared to small businesses or consumers.
- Sales Strategy and Pricing: Effective sales techniques (bundling, upselling, cross-selling) and competitive pricing can increase deal value and attract more customers, influencing average deal size.
How to Calculate Average Deal Size
To calculate average deal size, use this simple formula:
Average Deal Size = Total Revenue from Closed Deals / Number of Closed Deals
- Total Revenue from Closed Deals: This is the sum of all revenue generated from deals that were successfully closed within a specific time period, such as a month, quarter, or year.
- Number of Closed Deals: This represents the total number of deals that were successfully closed within the same time period used for calculating the total revenue.
Using Coefficient to Calculate Average Deal Size
Coefficient’s Sales Performance Dashboard for Google Sheets makes it easy to track and understand your average deal size.
Here’s how you can use it:
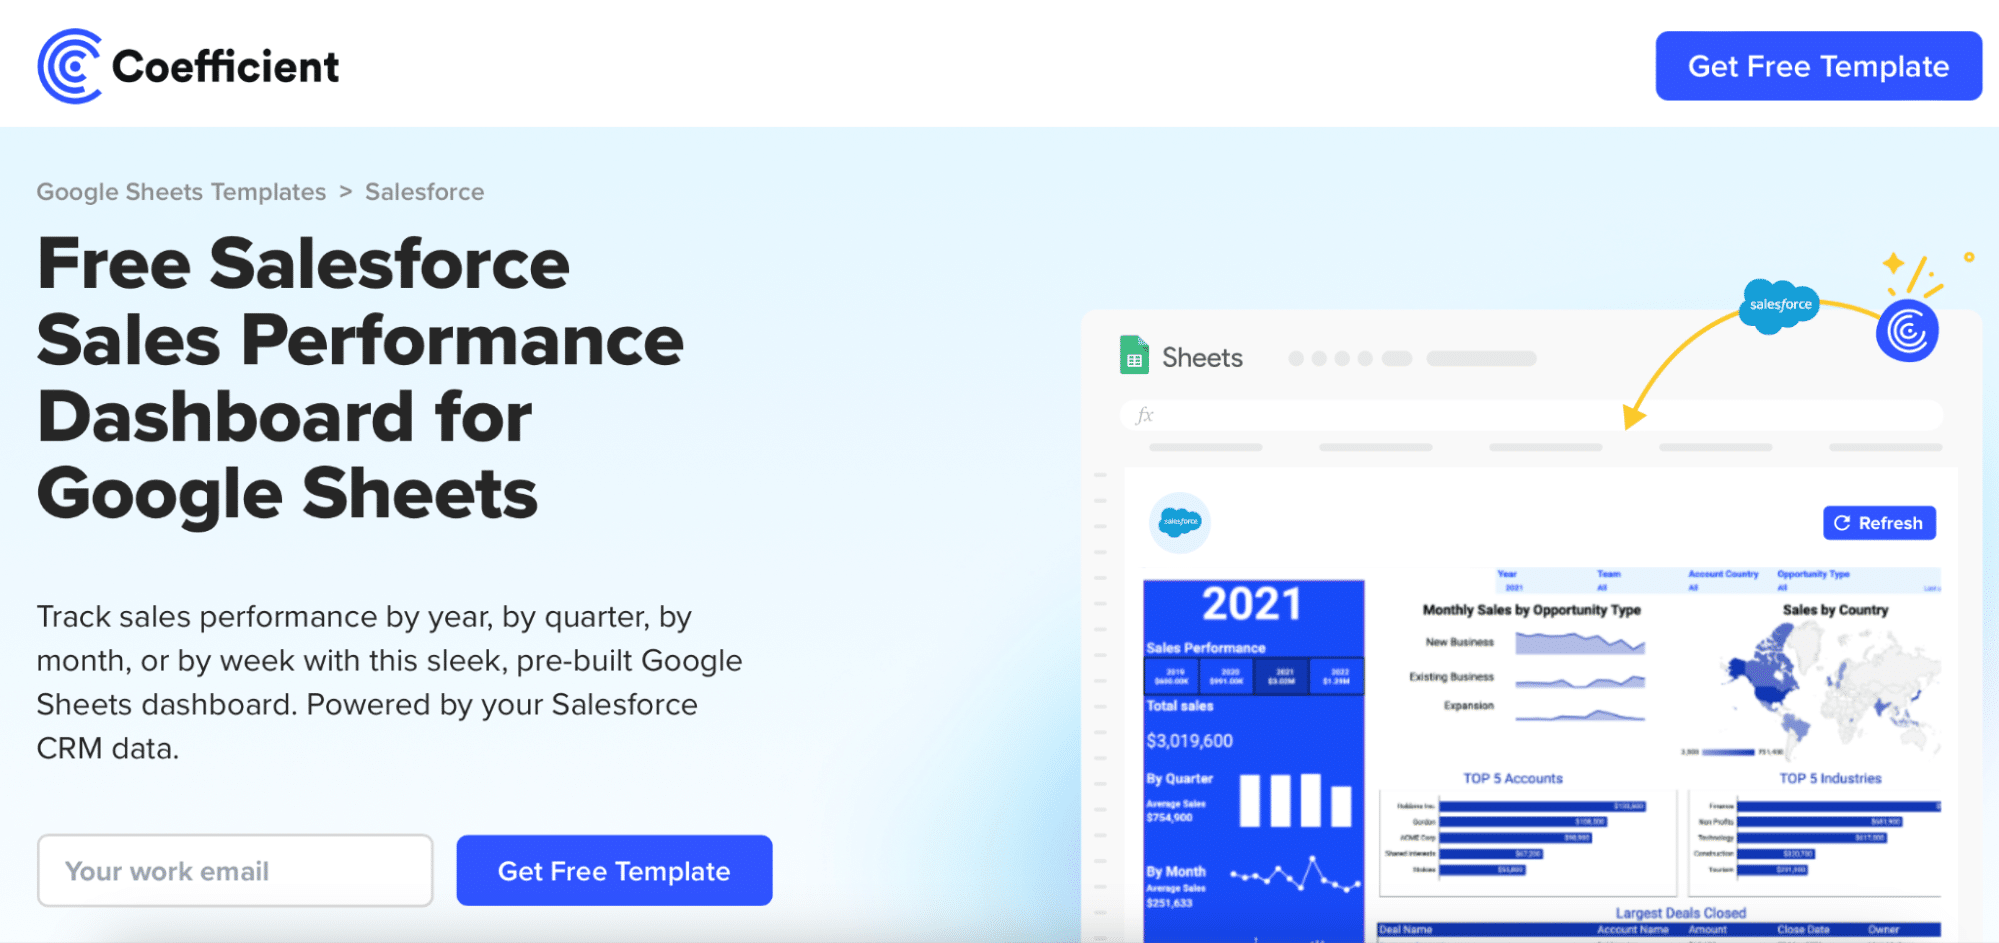
Step 1: Download the (Free) Average Deal Size Dashboard
To start, head to Coefficient.io. Enter your work email in the box and click ‘Get Free Template.’
You can save the template to your Google account by clicking the ‘Use Template’ button at the top right corner of your screen.
Coefficient will open in a new spreadsheet.
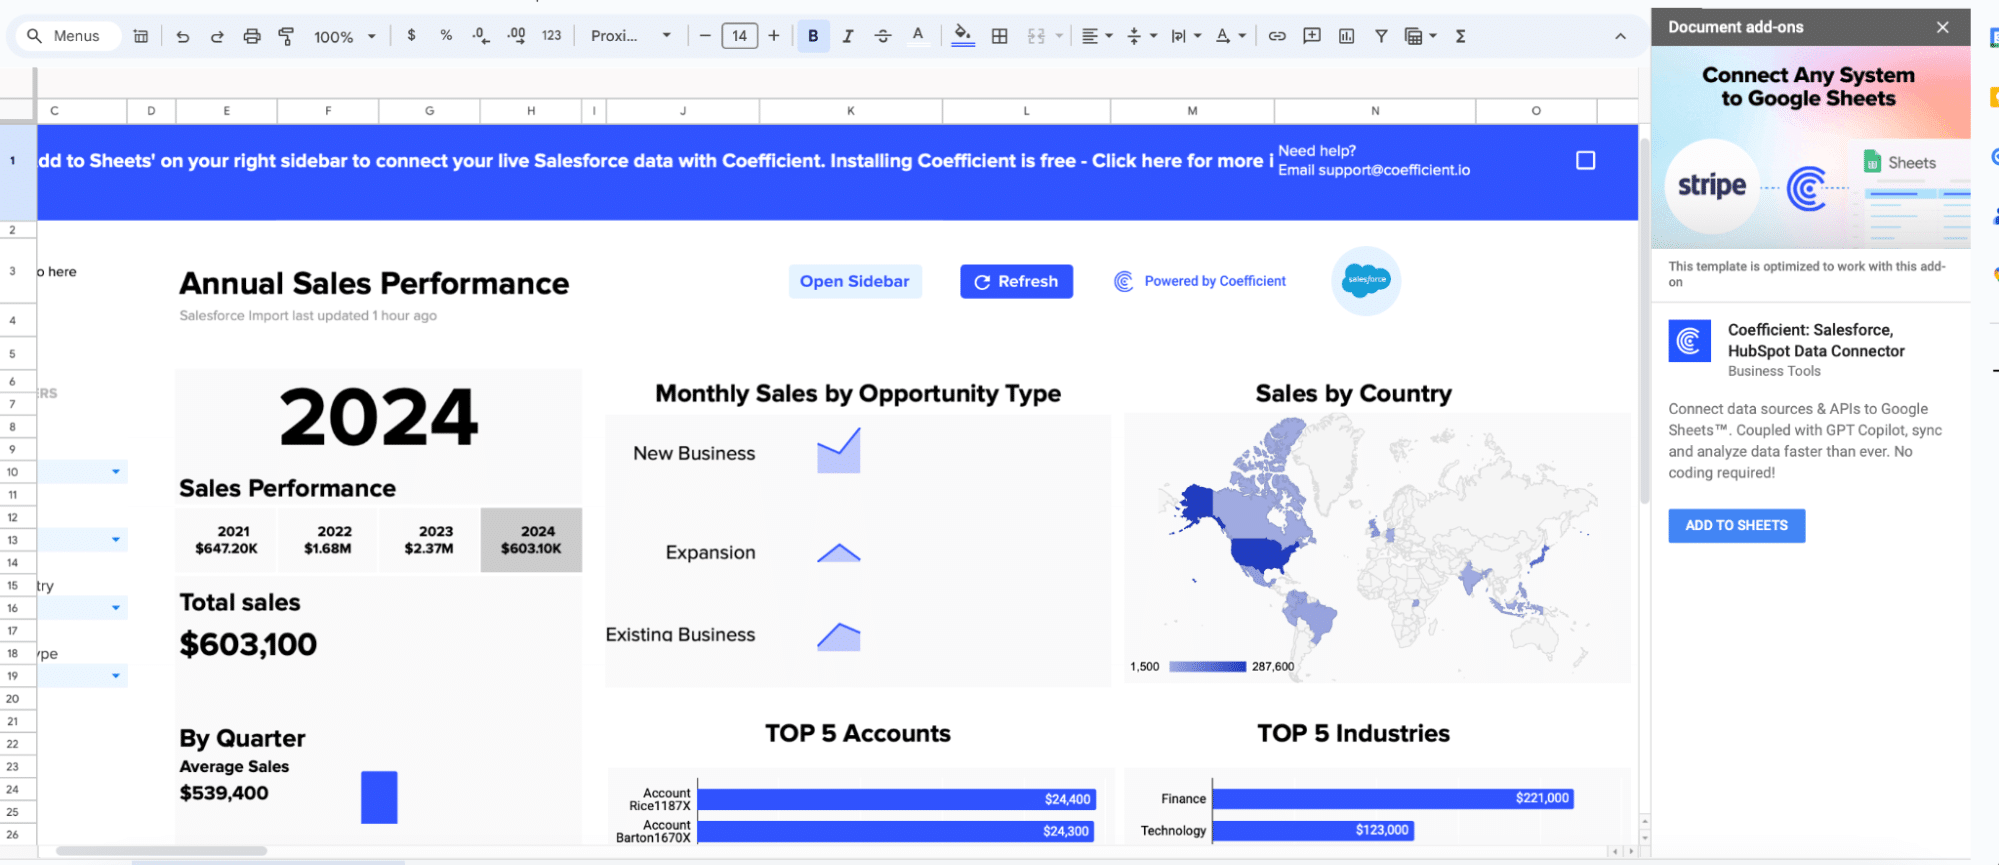
If this is your first time using Coefficient, you’ll need to add it as an add-on to Google Sheets.
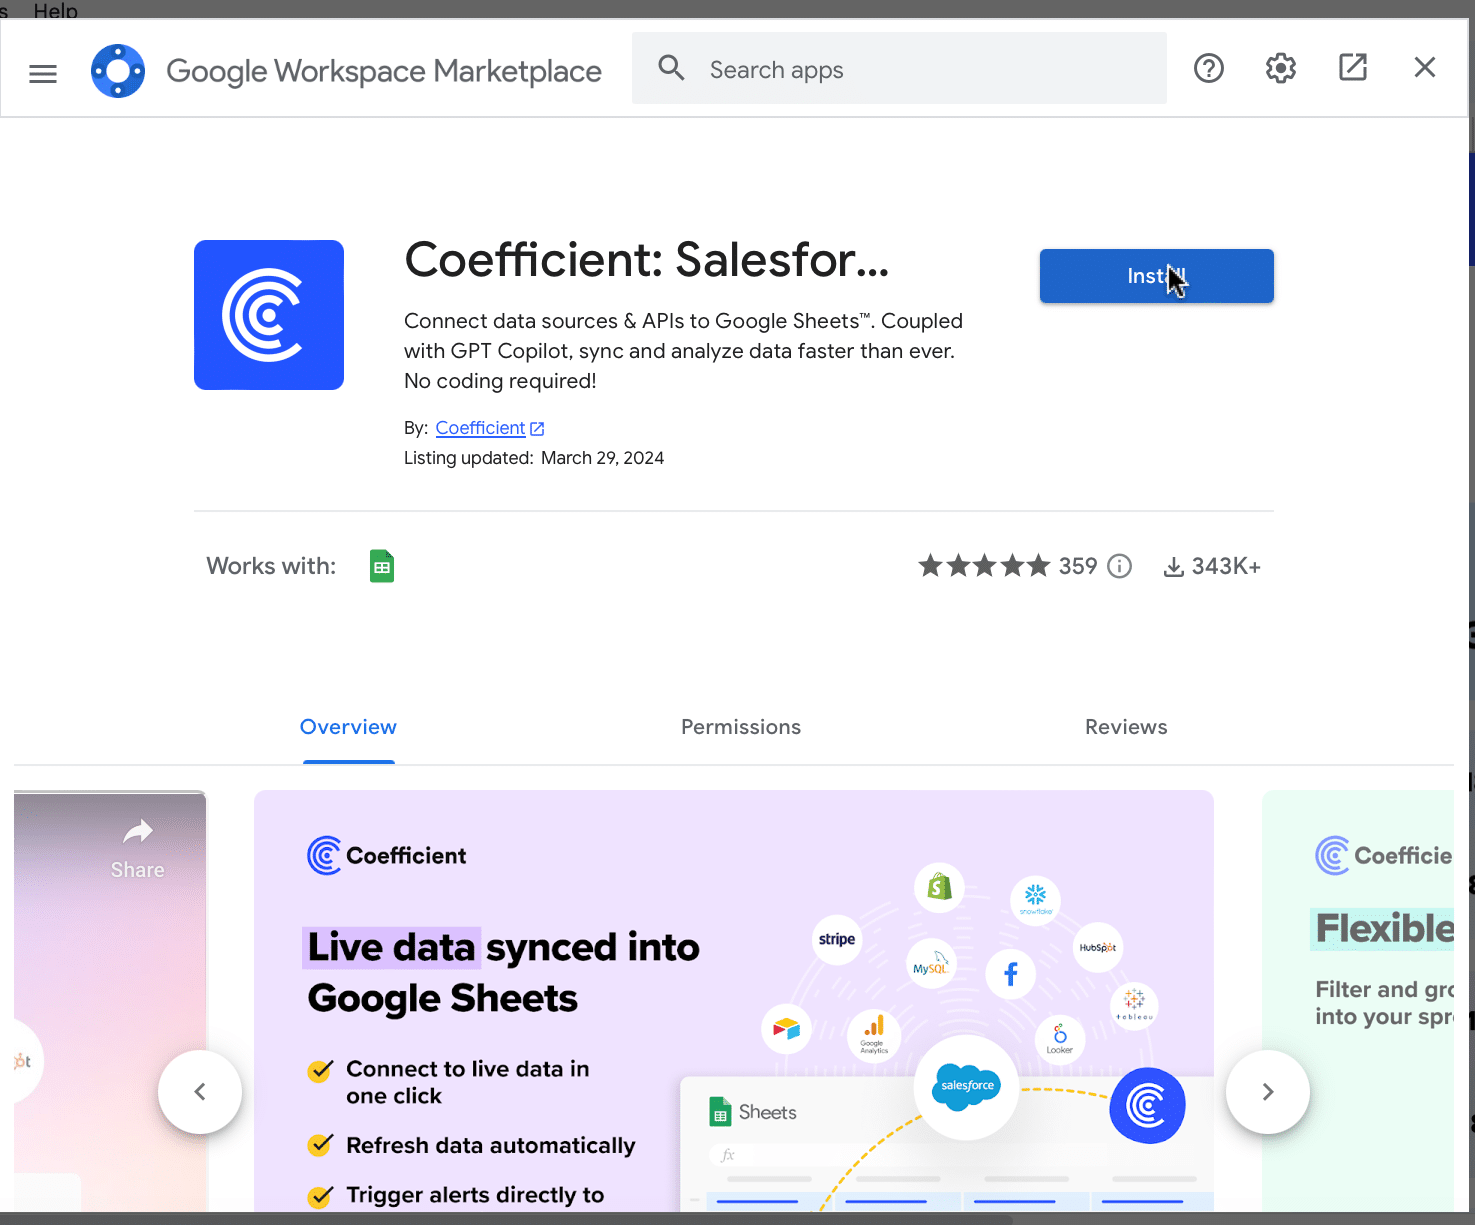
Click ‘Add to Sheets’ to continue.
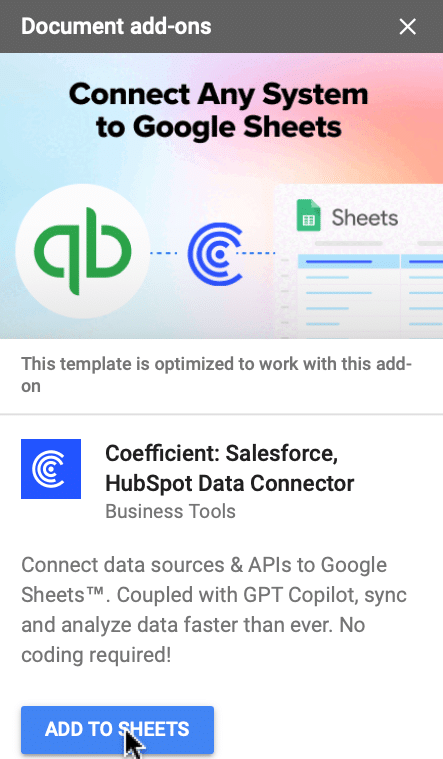
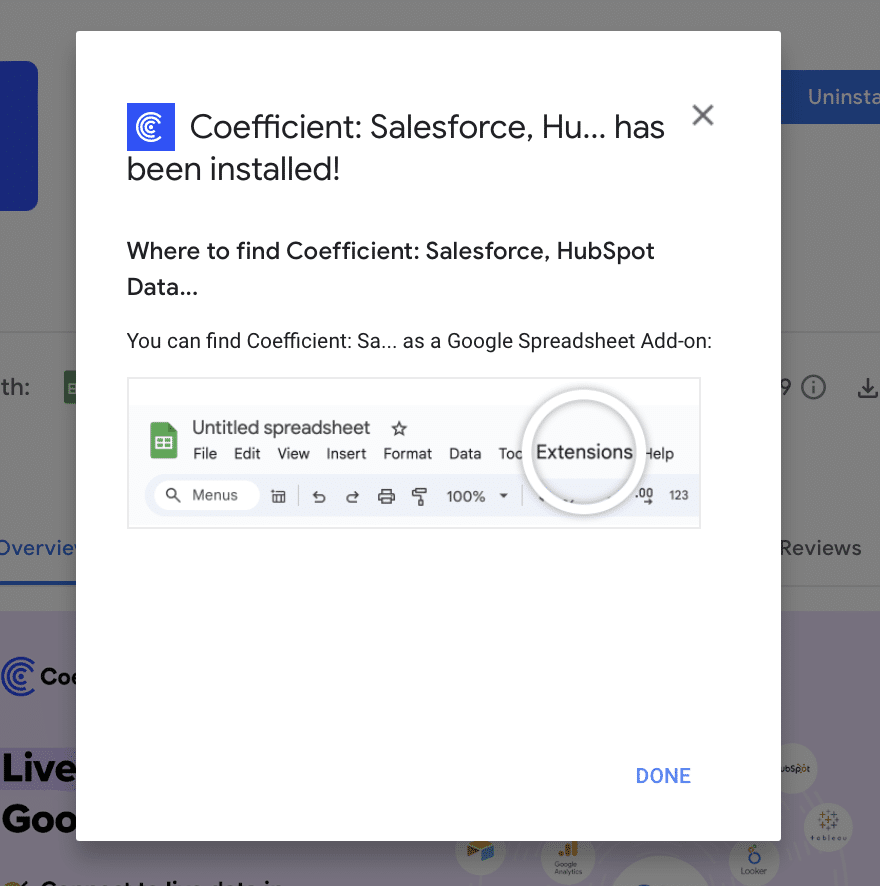
Hit the ‘Install’ button and follow the prompts to complete the installation.
Step 2: Connect Coefficient to Salesforce
After installation is complete, click ‘Done’ to return to your spreadsheet.
Click ‘Connect to Salesforce’ from the Coefficient menu on the right-hand side of your spreadsheet.
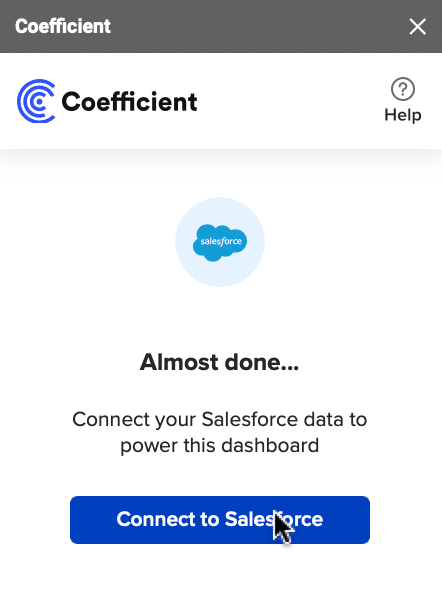
Follow the prompts to authorize Coefficient to your Salesforce account.
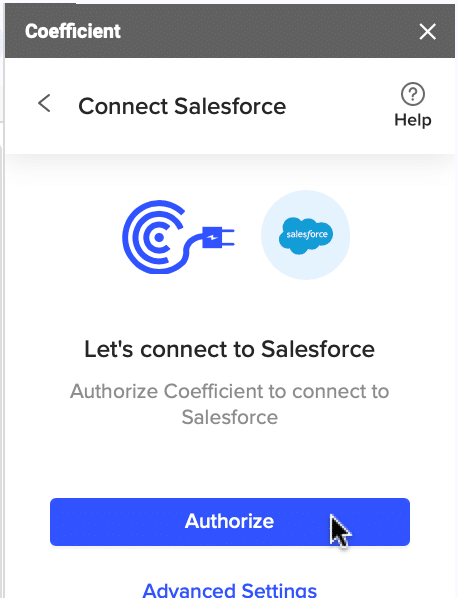
If successful, you’ll see the following notification at the top of your spreadsheet.

To update your data, navigate to the ‘Salesforce Import’ tab of your spreadsheet and click ‘Refresh.’
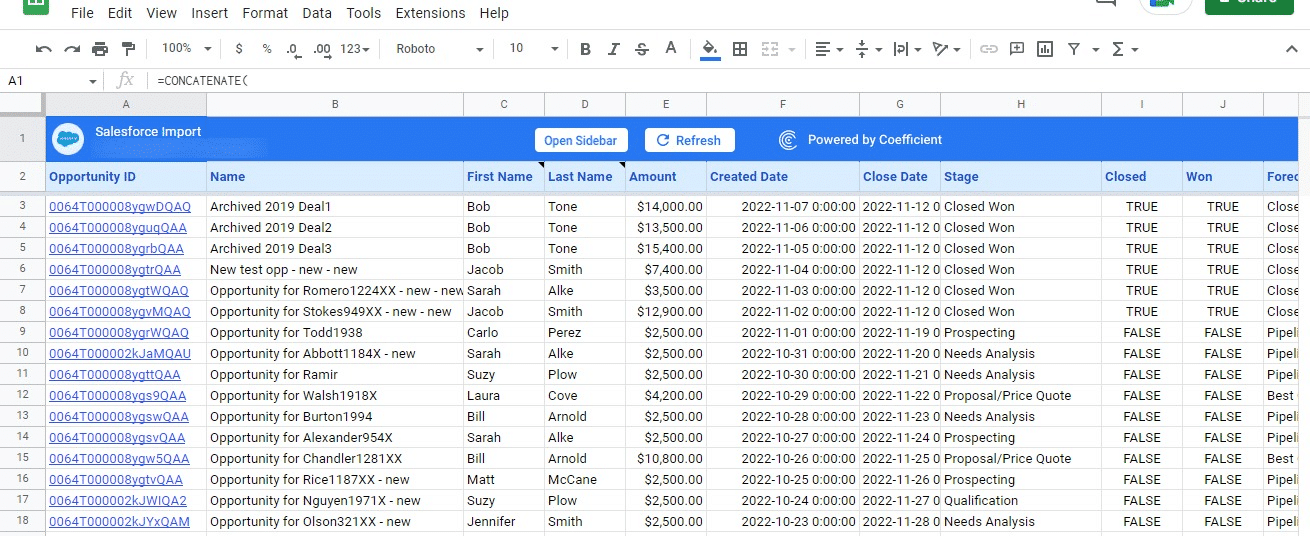
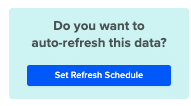
You can also auto-refresh your data by clicking ‘Set Refresh Schedule.’
Set up an hourly, daily, or weekly auto-refresh schedule, and Coefficient will automatically update your data based on that time interval.
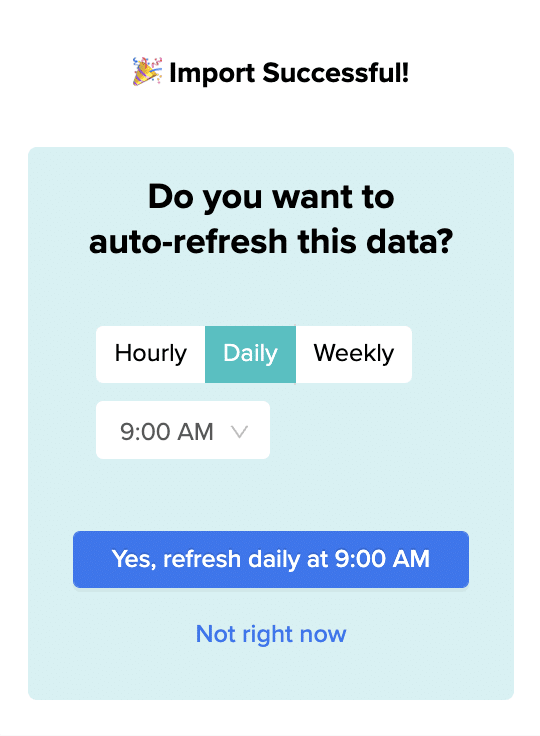
Set up an hourly, daily, or weekly auto-refresh schedule, and Coefficient will automatically update your data based on that time interval.
Step 3. Customize Your Dashboard
Tailor the template to your organization’s unique needs by navigating to the ‘Settings’ tab.
Company Information
Customize your dashboard by adding your company’s domain URL, logo, and fiscal year start date.
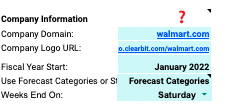
This ensures that the data and insights are specific to your organization and aligned with your financial reporting periods.
Pipeline Coverage Ratios
Fine-tune your pipeline coverage ratios based on your historical win rates.
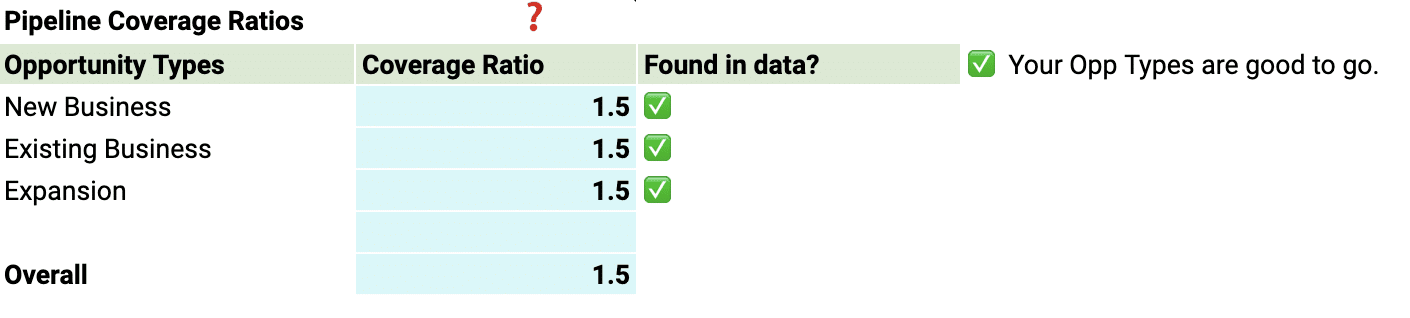
The pipeline coverage ratio is the total value of opportunities in your pipeline divided by your sales target for a given period. It helps you determine the number of opportunities needed in your pipeline to meet your sales goals.
Pipeline Stages
Tailor the pipeline stages in the template to mirror those in your Salesforce setup. This typically includes stages such as “Prospecting,” “Qualification,” “Proposal,” “Negotiation,” and “Closed Won” or “Closed Lost.
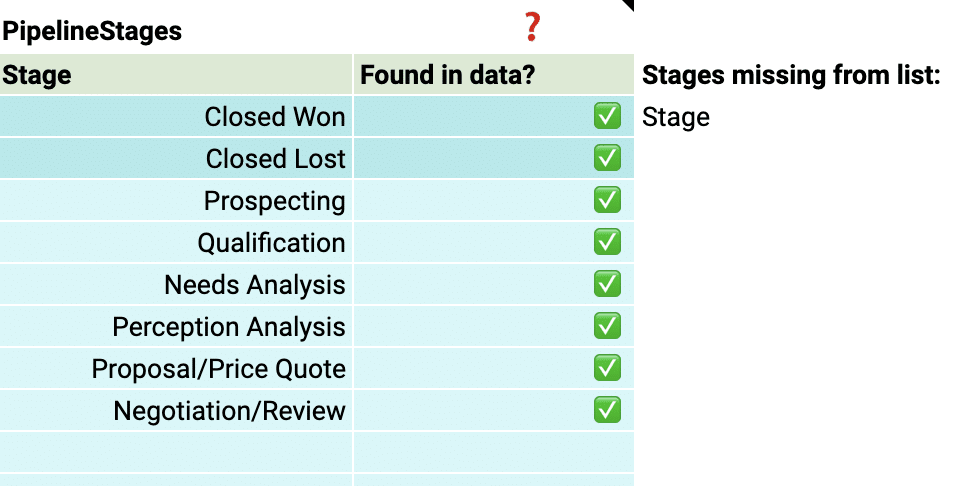
By aligning the stages in the dashboard with your sales process, you can gain accurate insights into the performance and velocity of your pipeline at each stage, identifying any bottlenecks or areas for improvement.
Team members
Add details about your sales team members to the dashboard for a more personalized analysis. Include information such as their names, roles, and any other relevant data.
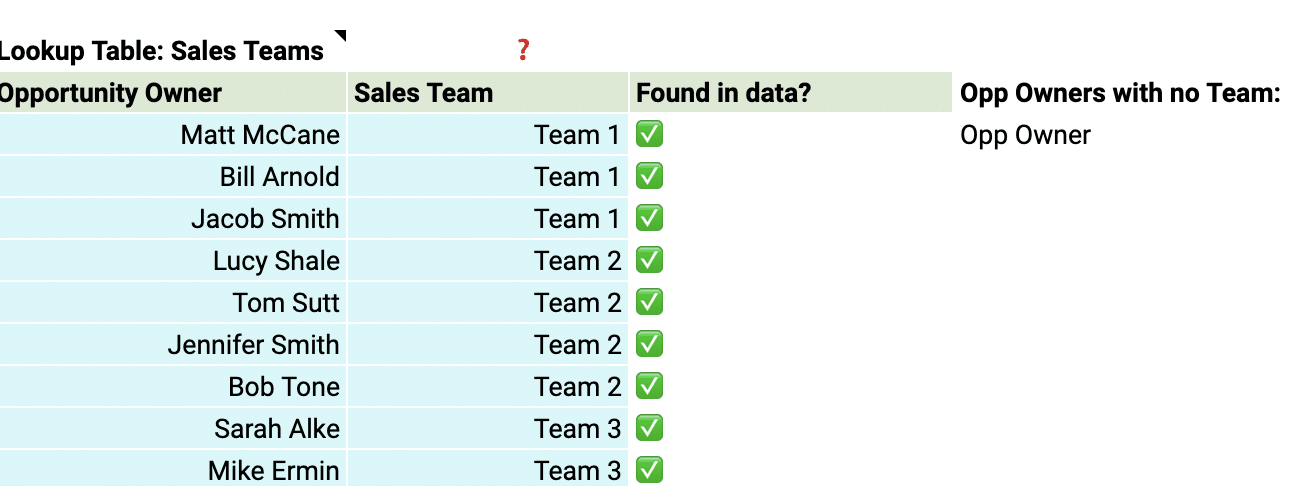
This allows you to track individual performance, identify top performers, and pinpoint areas where team members may need additional support or coaching.
With just a few simple customizations, you can transform the Sales Performance Dashboard into a powerful tool tailored to your organization’s specific needs.
Deep Dive into the Sales Performance Dashboard
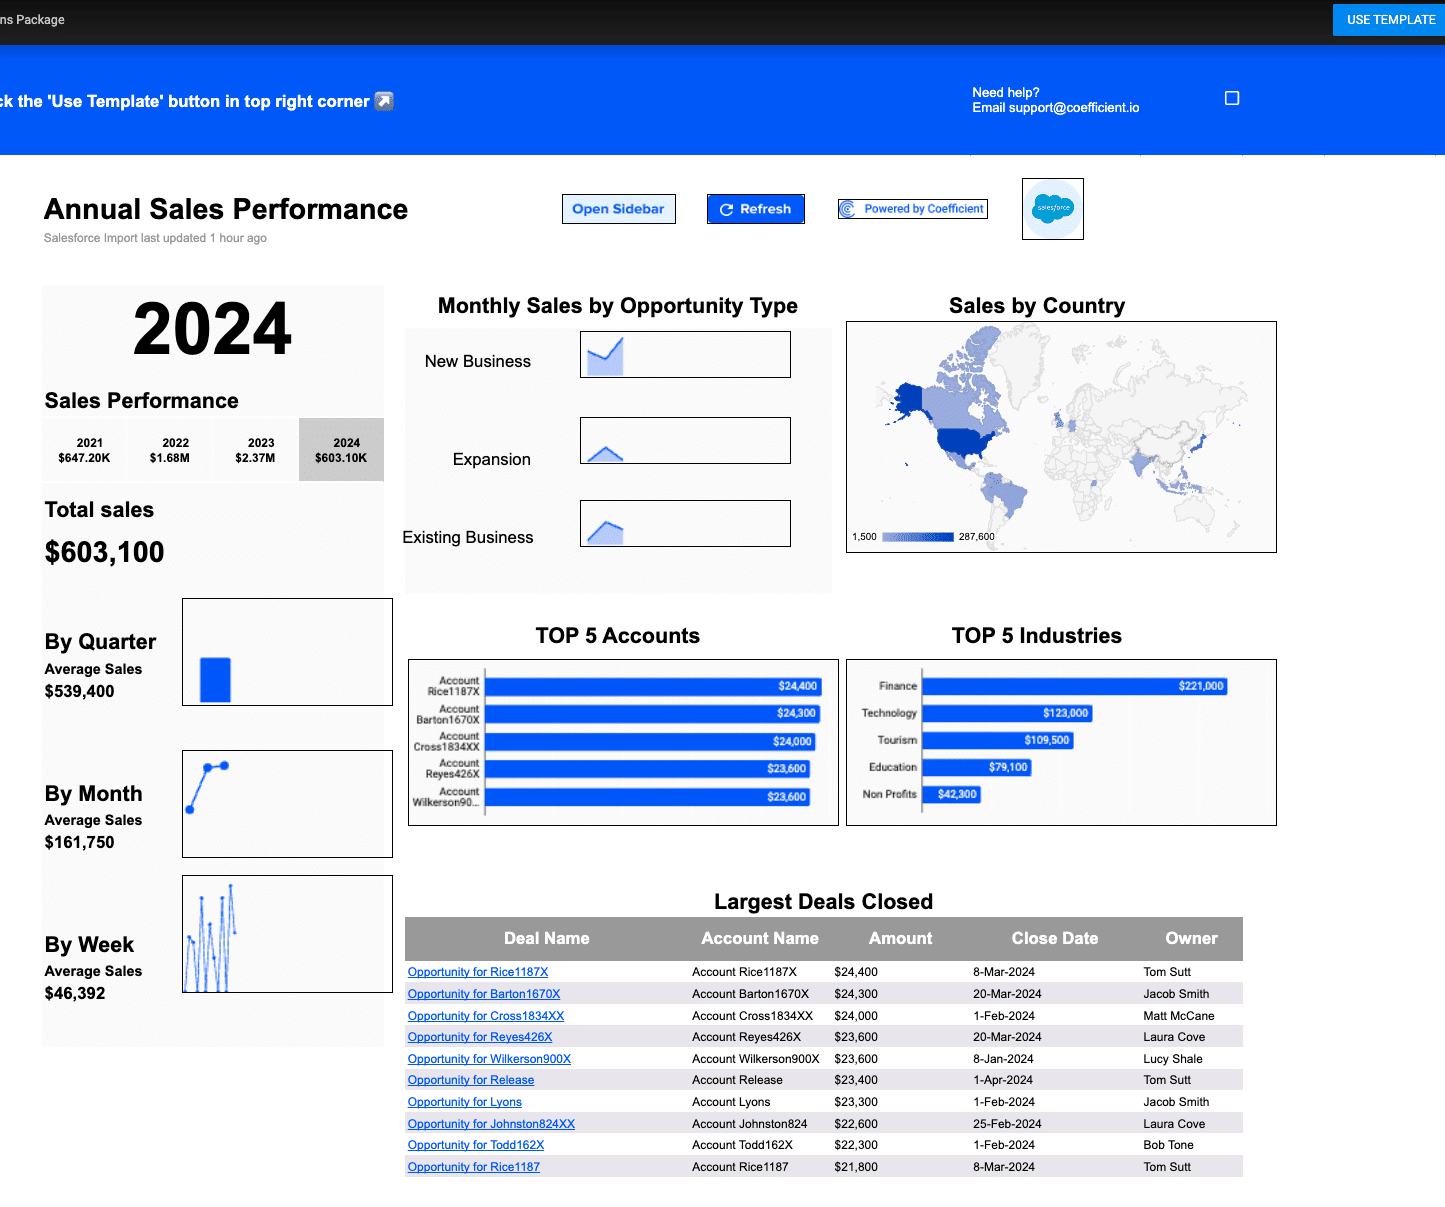
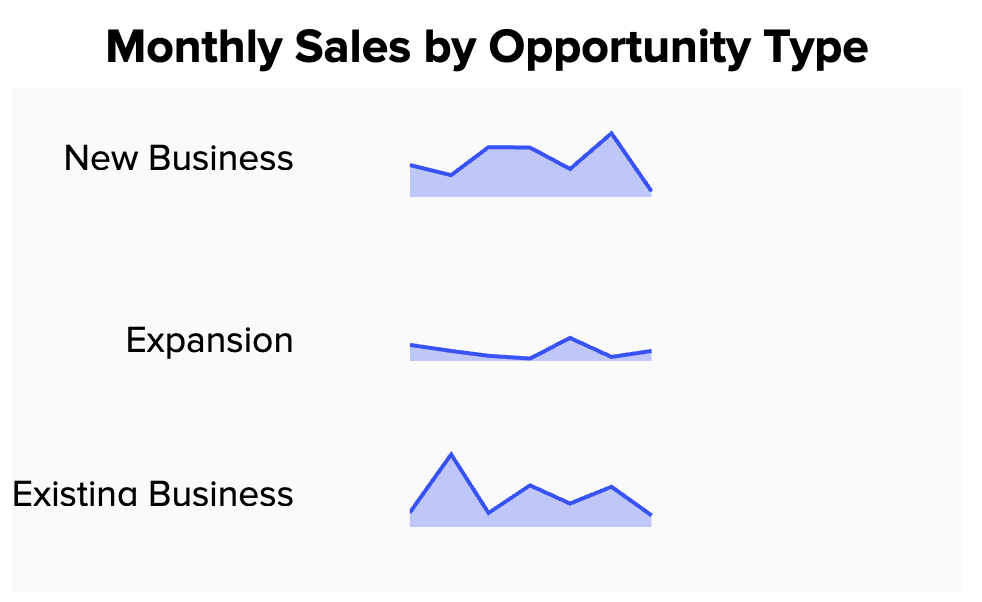
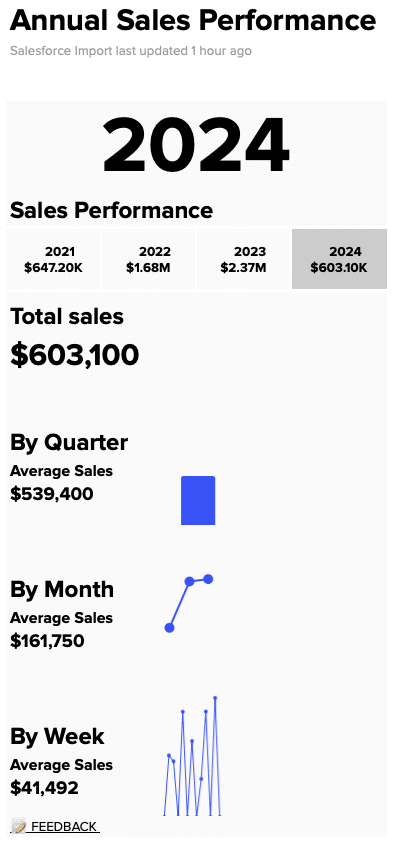
The Sales Performance Dashboard Template gives you a complete view of your sales team’s performance in one spreadsheet. Use the built-in charts and graphs to view sales performance by time period, opportunity type, and country, and filter data by year, team, opportunity, and geolocation.
Here’s an overview of the Sales Performance Dashboard’s key visualizations:
Easily visualize monthly sales by opportunity type new business, upsells, or renewals.
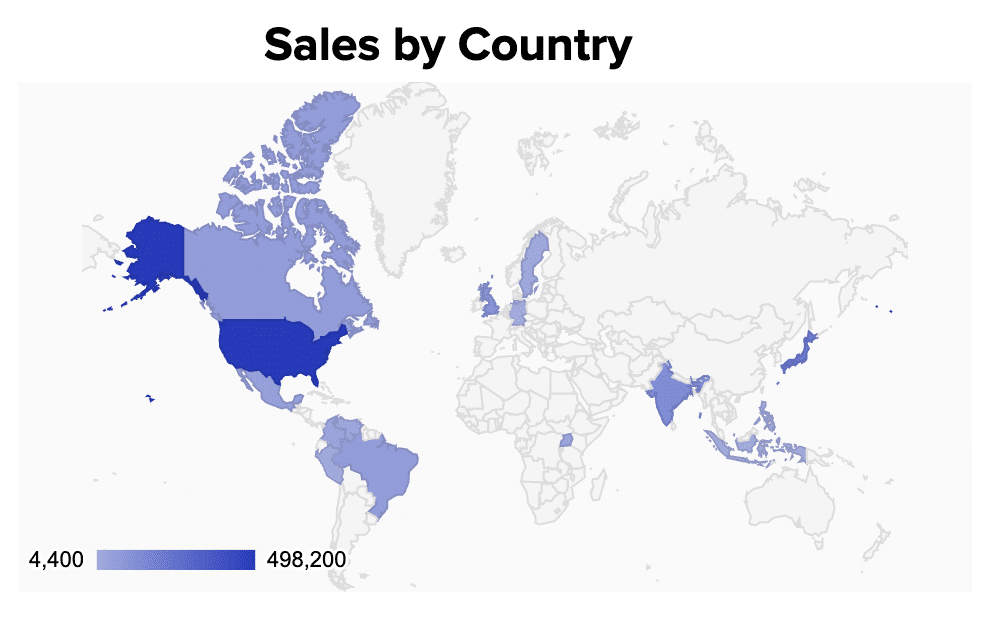
Breakdown your market by geography in the beautiful ‘Sales by Country.’
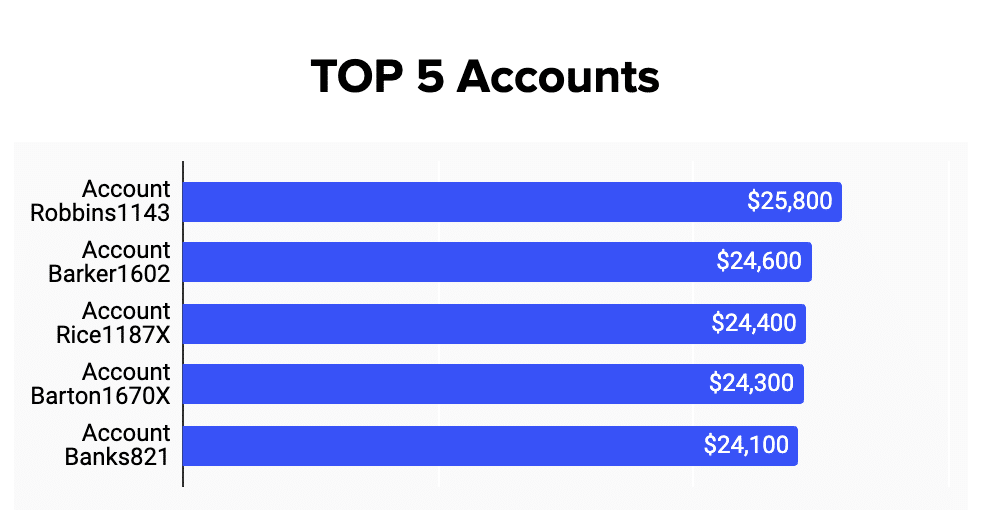
Rapidly display your top five accounts.
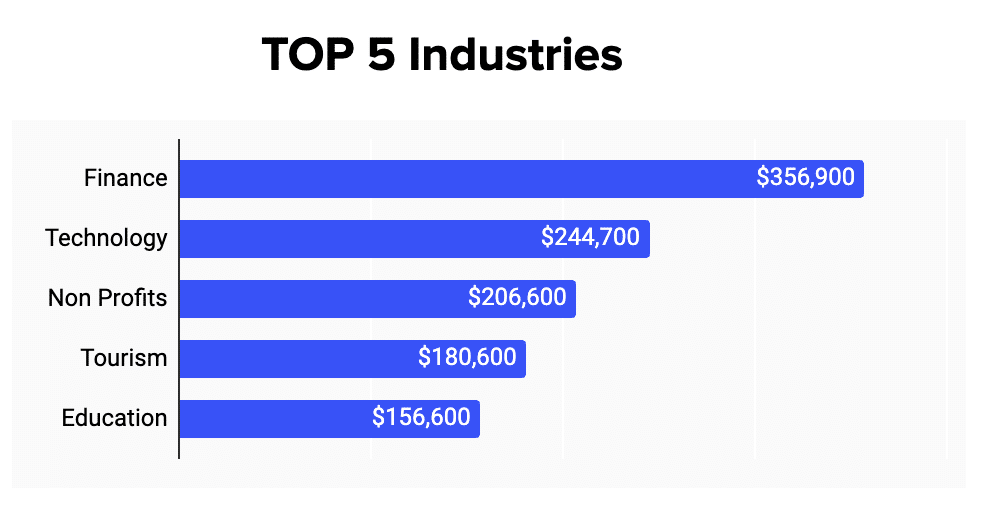
Segment your clients by industries like ‘Finance,’ ‘Technology,’ ‘Non-Profit,’ ‘Tourism,’ ‘Education.’
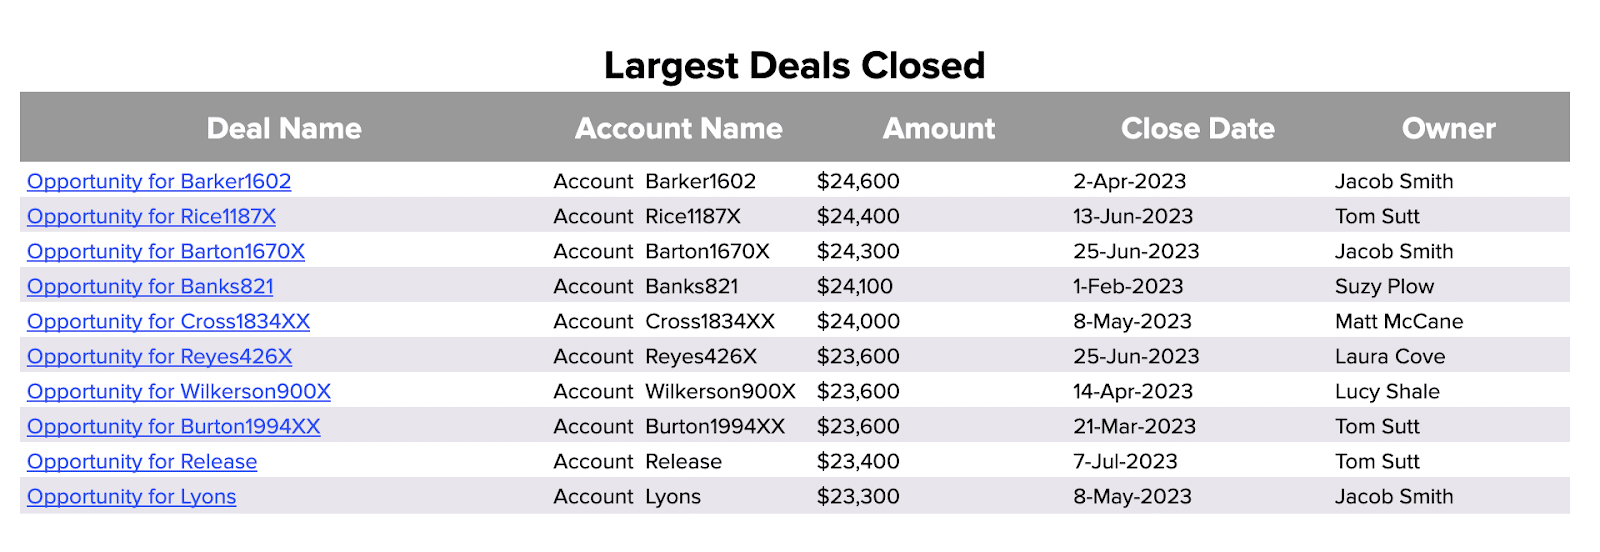
Review your largest deals categorized by ‘Deal Name,’ ‘Account Name,’ ‘Amount,’ ‘Close Date,’ and ‘Owner.’
Granularly breakdown sales volume by the week, month, quarter, or year.
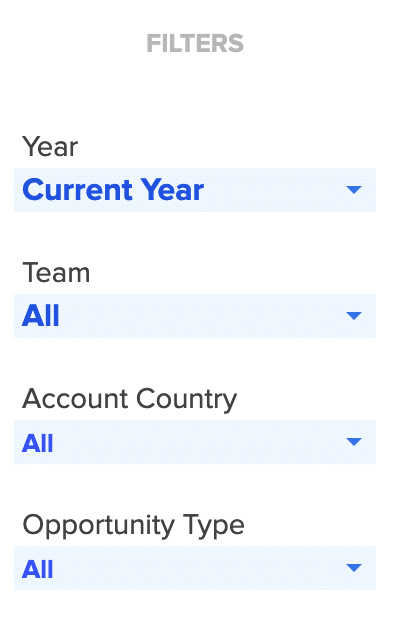
Filter performance by year, team, account category, or opportunity type.
The Coefficient dashboard template for the average deal size is your command center for data-driven decision-making. Key features include:
- Customizable Views: Tailor the dashboard to focus on the data that matters most to your sales operations, whether it’s tracking performance over time or by product category.
- Insightful Visualization: With a range of visualization options, the dashboard makes it easy to identify trends and patterns, providing a clearer understanding of how each deal contributes to overall sales goals.
- Actionable Data: The dashboard empowers you to drill down into specifics, offering a granular view of what’s driving your average deal size and how it can be optimized.
By leveraging these features, sales operations leaders can gain deeper insights into their sales performance, identifying opportunities to enhance efficiency and drive revenue growth.
Actionable Insights from Average Deal Size Data
The average deal size metric gives you valuable information that can help guide your sales strategies.
Here’s how you can use these insights to boost growth:
- Change your sales focus: If your average deal size is going up, think about putting more resources into big deals. If it’s going down, you might need to speed up your sales process or rethink your target market.
- Find areas to improve: Look at the things that affect your average deal size to find areas where you can do better. This could mean improving your products, targeting different customers, or making your sales techniques better.
- Tweak pricing and promotions: Use average deal size data to help decide on prices and promotions. If your average deal size is lower than you want, consider bundling products or offering limited-time discounts to attract bigger deals.
The Importance of Live Data
Coefficient’s dashboard templates use real-time data to help you:
- Quickly adapt to market changes: With live data, you can spot trends and changes in your average deal size as they happen, so you can adjust your sales strategies right away.
- Make informed decisions: Base your decisions on the most current information, so your strategies stay relevant and effective.
- Customize your analysis: Tailor the dashboard to focus on the specific metrics, time periods, or customer groups that matter most to your business.
- Work together effectively: Easily share insights across your organization, encouraging everyone to make decisions based on data and work towards common goals.
Easily Visualize and Optimize Your Average Deal Size
To optimize sales performance, understanding and leveraging your average deal size is essential. Coefficient’s dashboard templates give you the tools to refine your strategies with actionable insights.
Download the average deal size dashboard template or sign up for Coefficient to boost your sales operations with data-driven precision.
