Amplitude is the best product analytics tool most growth teams will ever use. It is also, quietly, a walled garden.
The moment a product manager needs to answer a question that crosses into revenue, churn, or marketing spend – Amplitude’s dashboards hit a wall. Not because the platform is broken. Because it was never designed to hold that data. Stripe owns your revenue. Salesforce owns your pipeline. HubSpot owns your contacts. Amplitude owns your product events. None of them talk to each other by default.
So what do teams do? They export CSVs, paste them into spreadsheets, and manually stitch together a picture that is stale before the meeting ends. Or they file a ticket and wait two weeks for the data team to build a pipeline for a question that might not even be worth asking in a month.
This guide covers seven tools that break the wall down. Cross-source dashboards that combine Amplitude with the rest of your stack. Warehouse pipelines for teams that genuinely need them. And a section on why, in 2026, the pipeline-first approach is becoming the long way round for most product and growth teams.
| Quick Answer For cross-source dashboards (where most teams should start): Coefficient connects Amplitude alongside Salesforce, HubSpot, Stripe, and 150+ other sources in Google Sheets or Excel. Describe the analysis in plain English and the AI builds the query. Describe the dashboard in plain English and Vibe Dashboards publishes it as a live shareable web dashboard without a BI platform. Segment sits upstream and determines what clean, governed event data flows into Amplitude in the first place.For warehouse pipelines (the long way round for most use cases in 2026): Fivetran and Stitch both have managed Amplitude connectors for loading event data into Snowflake, BigQuery, or Redshift. Worth knowing: Amplitude launched a native MCP server in October 2025, available to all customers, that lets LLMs query Amplitude data directly in natural language without a pipeline sitting between the question and the answer. The need for dedicated ETL infrastructure just to ask questions about product data is narrowing fast.For operational activation: Hightouch syncs Amplitude-defined cohorts back into Salesforce, HubSpot, and ad platforms so sales and marketing can act on product behaviour signals. Zapier handles lighter trigger-based versions of the same thing. One section, tools named, no deep dives. |
Where Amplitude Ends and Your Revenue Funnel Begins
Amplitude tracks everything a user does inside your product. Funnels, retention, feature adoption, A/B test results – all excellent. G2 reviewers across 3,000-plus reviews consistently back this up.
But here is the problem. The questions that actually move the business are almost never answerable from within one tool. Which acquisition channels produce the highest-LTV cohorts? You need Stripe for that. Which product signals predict churn before it shows up in renewals? You need Salesforce for that. Which high-usage accounts should sales prioritise for expansion? CRM data. Amplitude does not hold any of it.
Until recently, the only answer was a full pipeline: extract from Amplitude, load into Snowflake, model in dbt, connect a BI tool, wait two weeks. In 2026 that is increasingly overengineering for the questions most product and growth teams are actually trying to answer.
Two things changed. Coefficient’s AI Sheets assistant and AI dashboard generator let analysts describe what they need in plain English and get live cross-source results without a pipeline. And Amplitude’s own MCP server, launched October 2025, lets LLMs query Amplitude data conversationally from Claude and Cursor – no export, no ETL, no waiting.
Amplitude Data Integration Tools for Cross-Source Dashboards
This is where most product and growth teams should start. Not moving data into a warehouse. Not building a pipeline. Just combining Amplitude behavioural data with the revenue, CRM, and marketing data that completes the picture – in a dashboard that updates automatically.
1. Coefficient
Best for: Growth analysts and product managers who need Amplitude data combined with Salesforce, HubSpot, Stripe, or warehouse data in a single live dashboard – without a pipeline, a BI platform, or an engineering ticket.
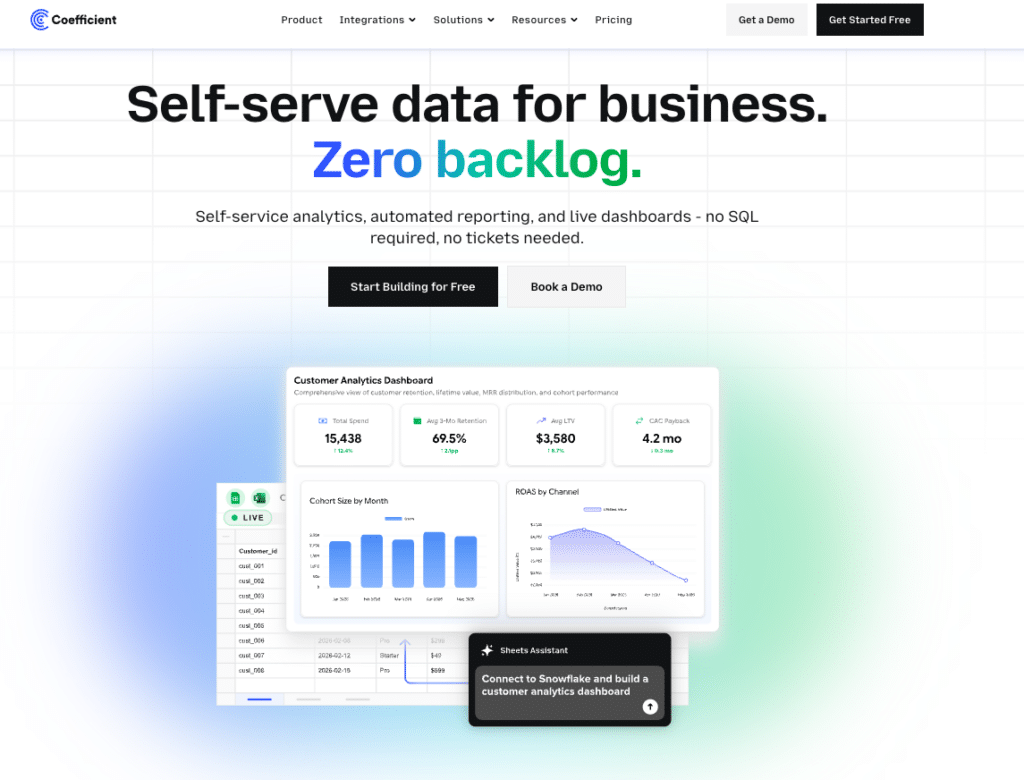
Coefficient connects Amplitude to Google Sheets and Excel alongside 150+ other sources. Pull Amplitude cohort data into the same spreadsheet as Salesforce opportunity data and Stripe revenue. Then use the AI SQL Builder to describe the analysis in plain English – the AI writes the query across all connected sources automatically. The Excel connector covers the same workflow for Excel users.
Once the data is in Sheets, Vibe Dashboards closes the last mile. Describe the dashboard you want – retention cohorts with revenue overlay, activation rate by channel – and the AI builds a live, shareable web dashboard from it. No BI platform. No per-viewer fees. Share a link and stakeholders see live data without needing an Amplitude account. The dashboard updates automatically on your Coefficient refresh schedule. Coefficient AI powers both the query layer and the dashboard layer.
Pros
- Connects Amplitude alongside 150-plus other sources in Google Sheets and Excel. Blend product behavioural data with Salesforce, HubSpot, Stripe, Snowflake, and other sources in a single workbook without separate exports.
- AI query generation from plain English descriptions removes the query-writing barrier for analysts who know what they need but not how to get it. Works across multiple connected sources simultaneously.
- Vibe Dashboards turns the combined data into a live shareable web dashboard without a BI platform. No per-viewer fees. Stakeholders access live data via a link without needing Amplitude or spreadsheet access.
- Automated refresh schedules keep Amplitude data current without manual exports or repeated engineering requests.
- Free plan available. No per-user fees on paid plans.
Source: Coefficient G2 reviews
Cons
- Not a warehouse pipeline tool. Coefficient does not replicate Amplitude event data into Snowflake, BigQuery, or Redshift for SQL-based modeling. For that use case, Fivetran or Stitch are more appropriate.
- AI SQL Builder currently available in Google Sheets only, not Excel.
- Amplitude connector imports are scheduled polls rather than real-time streams. For dashboards that need sub-minute Amplitude data freshness, a direct API integration or Amplitude’s native MCP server is more appropriate.
Source: Coefficient Amplitude integration page
Pricing
Free plan available. Paid plans from $49/month with no per-user fees. See Coefficient pricing for current plan details.
| Setup guide: How to connect Amplitude to Google Sheets with Coefficient. Excel users: Coefficient Excel Amplitude connector. |
2. Segment
Best for: Engineering and data teams that want a single event collection layer feeding Amplitude, data warehouses, CRMs, and marketing tools simultaneously – with schema governance enforced at the source.
Segment (Twilio Segment) collects events once via a single API and routes them to every destination in your stack simultaneously – Amplitude, your data warehouse, HubSpot, Google Ads. Because Segment’s Protocols layer enforces schema governance before data reaches Amplitude, event quality in Amplitude improves significantly. G2 reviewers consistently cite this centralisation as Segment’s core strength.
Segment Unify also builds unified customer profiles that combine Amplitude behavioural data with CRM and transactional data. Useful for personalisation and segmentation that goes beyond what Amplitude alone can do.
The honest trade-off: cost escalates fast. One G2 reviewer referenced a $400k enterprise contract. The June 2025 Twilio restructuring adds uncertainty about long-term direction. And Segment requires developer resources to implement correctly. Mistakes in the initial event taxonomy are expensive to undo.
Pros
- Single API for event collection routing data to 700-plus destinations simultaneously. Instrument once, feed Amplitude, your data warehouse, HubSpot, and every other tool from the same event stream.
- Protocols enforces schema governance before data reaches Amplitude. Reduces malformed events, naming inconsistencies, and duplicate tracking that degrade Amplitude data quality over time.
- Unify builds real-time unified customer profiles from Amplitude behavioural data combined with CRM and transactional data – useful for personalisation and multi-source segmentation beyond what Amplitude alone supports.
Source: Twilio Segment G2 reviews – pros and cons
Cons
- Pricing escalates significantly at scale. Usage is billed per Monthly Tracked User (MTU) and costs are ‘not cheap at all’ according to multiple G2 reviewers. Enterprise contracts can reach six figures annually.
- Post-Twilio acquisition cultural and support concerns documented repeatedly on G2. The June 2025 Twilio restructuring adds uncertainty about long-term product investment.
- Implementation requires engineering resources. Segment is not a point-and-click tool for business users – correct setup requires developers and a thoughtful event taxonomy from the start. Mistakes in the initial taxonomy are expensive to fix.
Source: Twilio Segment Capterra reviews
Pricing
Free plan up to 1,000 visitors per month and 2 sources. Team plan starts at $120/month for 10,000 Monthly Tracked Users (MTUs), scaling with additional volume. Business and full CDP bundles (Connections plus Unify plus Engage) are custom usage-based contracts. See Segment pricing for current plan details.
3. Zapier
Best for: Growth and marketing teams that need lightweight automation between Amplitude events and other tools – Slack alerts, HubSpot contact updates, Google Sheets rows – without engineering overhead.
Zapier connects Amplitude to 7,000-plus apps through trigger-action workflows. The use cases here are operational, not analytical. Send a Slack alert when a key activation event drops below threshold. Create a HubSpot contact when a user completes onboarding. Update a Google Sheet row when a milestone is hit.
What Zapier is not: it does not move Amplitude data into spreadsheets for cross-source analysis (Coefficient handles that), and it does not sync cohorts into Salesforce at scale (Hightouch handles that). It connects individual Amplitude events to specific downstream actions, at a price accessible to non-technical growth teams.
Pros
- Connects Amplitude to 7,000-plus apps. Pre-built Zap templates for common Amplitude workflows cover Slack, HubSpot, Google Sheets, Salesforce, and most other tools growth teams use.
- No code required. Marketing and growth teams can set up Amplitude automation workflows without engineering support.
- Free plan available. Paid plans start at a low entry price point accessible to small teams and startups.
Source: Zapier Amplitude integrations

Stop exporting data manually. Sync data from your business systems into Google Sheets or Excel with Coefficient and set it on a refresh schedule.
Get Started
Cons
- Task-based pricing can escalate on high-volume Amplitude event flows. Teams with thousands of daily events triggering Zaps should model cost carefully before assuming it scales.
- Not suited for complex multi-step workflows with conditional logic or error handling. For enterprise-grade Amplitude integration workflows, Workato handles these better.
- Does not support bulk historical Amplitude data movement. Zapier handles real-time event triggers, not batch exports of historical cohort data.
Pricing
Free plan available for basic use. Starter plan at $19.99/month. Professional and Team plans add higher task volumes and multi-step Zaps. See Zapier pricing for current plan details.
4. Stitch
Best for: Data teams that need a simple managed connector to get Amplitude event data into a warehouse – without Fivetran’s cost or Airbyte’s infrastructure complexity.
Stitch, now part of Qlik following the Talend acquisition, has a documented Amplitude connector that G2 reviewers describe as ‘super simple to ingest’ alongside Salesforce, Segment, and Google Analytics. It is the lowest-friction entry point in managed ELT for Amplitude at $100/month.
The caveats matter though. Row-based pricing escalates steeply above 100 million rows per month. The Talend-to-Qlik acquisition chain has visibly slowed connector development according to G2 reviewers. And there are no built-in transformations – raw Amplitude data requires dbt or downstream SQL to model into anything useful.
Pros
- Simple setup with a documented Amplitude connector. G2 reviewers consistently praise Stitch’s ease of use and quick configuration for standard sources including Amplitude.
- Row-based pricing starts at $100/month – the lowest paid entry point in the managed ELT category for Amplitude pipeline use cases.
- 140-plus connectors including Amplitude, Salesforce, Segment, and major databases. Sufficient coverage for most growth analytics stacks without the complexity of Fivetran or Airbyte.
Source: Stitch G2 reviews – pros and cons
Cons
- Batch-based replication with no real-time CDC. Amplitude data in the warehouse reflects the last batch sync, not a real-time event stream.
- No built-in transformations. Raw Amplitude event data lands in the warehouse requiring dbt or downstream SQL for modeling into usable analytics tables.
- Row-based pricing escalates at high Amplitude event volumes. Teams replicating more than 100 million rows per month will pay $1,500-plus per month on annual billing.
- Ownership uncertainty following the Talend acquisition by Qlik. Pace of connector development and feature updates has slowed according to G2 reviewers.
Source: Stitch pricing and plan details
Pricing
14-day free trial with unlimited rows. Paid plans start at $100/month for the Standard tier (row-based pricing). Advanced plan at $1,250/month billed annually. Premium plan at $2,500/month billed annually. See Stitch pricing for current row limits and plan details.
Do You Actually Need an Amplitude Data Pipeline in 2026?
The traditional Amplitude stack: extract event data via Fivetran or Stitch, load into Snowflake or BigQuery, model in dbt, connect a BI tool, build dashboards. For data engineering teams building company-wide analytics infrastructure with strict governance requirements, this approach is still valid.
For a product manager who needs to answer a cross-system question this week? It is usually expensive overengineering.
Two things are making the pipeline-first approach less necessary. First, Amplitude launched a native MCP server in October 2025, available to all customers including the free tier. It connects Amplitude’s behavioural data directly to LLMs – Claude, Cursor, ChatGPT – so teams can ask ‘What features drove the most retention this month?’ in plain language without building a pipeline first. As Amplitude’s CEO Spenser Skates put it at launch: ‘MCP was made for data analytics. You can ask a vague question and have an AI model iteratively query Amplitude to find insights.’
Second, Coefficient’s AI Sheets assistant already lets analysts describe cross-source analysis in plain English and get live results from connected systems – no warehouse, no dbt, no waiting. Most questions that previously required a pipeline can now be answered faster without one.
Where pipelines still make genuine sense: teams running complex multi-source SQL models, organisations with strict data governance mandates, and data engineering teams building Amplitude into broader company-wide analytics infrastructure. Fivetran for fully managed ELT. Airbyte for open-source flexibility at lower cost.
Activating Amplitude Cohorts in Your CRM and Marketing Tools
Amplitude identifies cohorts based on activation milestones, feature engagement, or churn signals. The problem is those cohorts live inside Amplitude. Sales does not work in Amplitude. Marketing does not work in Amplitude. Customer success does not work in Amplitude.
Hightouch is the leading independent reverse ETL platform for syncing warehouse-modeled Amplitude cohorts to 200-plus destinations – Salesforce, HubSpot, Google Ads, Braze. Worth knowing: Fivetran acquired Census in May 2025 and rebranded it as Fivetran Activations. Teams evaluating Census should assess it as part of Fivetran now, not as a standalone tool. For lighter trigger-based activation – updating a HubSpot contact when a user hits a milestone, adding a Salesforce task when an account shows expansion signals – Zapier handles this without the warehouse dependency Hightouch requires.
Get Started with Coefficient for Amplitude
If your team needs Amplitude data combined with Salesforce, HubSpot, or Stripe in a live dashboard – without a pipeline, a BI platform, or a two-week wait – try Coefficient for free. Connect Amplitude, add your other sources, describe the dashboard you want in plain English, and share the link.
See Coefficient pricing for plan details, pre-built dashboard examples for ready-to-use templates, and the Amplitude connector page for setup documentation.


