Business intelligence tools promised self-service analytics a decade ago. The dashboards got built. The analysts configured the data models. And most business users ended up exactly where they started: filing a ticket and waiting three days for an answer.
AI is the most significant attempt yet to close that gap. Not by replacing BI, but by changing where and how business teams interact with it. In 2026, every major BI platform has an AI layer. The question worth asking is not whether it exists but whether it is actually reaching the people it was supposed to reach.
This article covers what AI is genuinely adding to BI in 2026, where the adoption still lags the promise, and where AI-native reporting is stepping in for business teams who need answers faster than the traditional BI workflow allows.
What Traditional BI Was Built to Do
BI tools were designed for a specific model: a small number of technical users producing governed reports for a larger audience. Data engineers built the pipelines. Analysts modeled the data, configured the dashboards and maintained the definitions. Business users consumed the output.
That model worked when reporting needs were stable and predictable. A weekly pipeline report. A monthly P&L. A quarterly board pack. The analyst built it once, scheduled the refresh, and the dashboard ran itself.
What it could not handle well was the question that was not anticipated. A CMO who wants to know why CPL spiked in week three of last month. A RevOps lead who needs win rate by deal size for Enterprise accounts only, for Q1 versus Q2. These questions do not fit a preset dashboard. In the traditional BI model, they become tickets that join a queue behind every other question the data team is already fielding.
The structural problem is not the tools. It is the model. BI platforms are exceptionally good at governance, schema management, access control and audit trails. They are structurally slower at putting ad hoc answers into the hands of the business users who need them, because every question that falls outside a pre-built dashboard requires an analyst in the middle.
| The promise of self-service BI has been around since at least 2015. Most business users are still not self-served. |
What AI Is Actually Adding to BI in 2026
The AI additions to major BI platforms in 2025 and 2026 are real, and in some cases genuinely useful. Three capabilities are worth understanding clearly.
Natural language querying lets users ask questions in plain English and receive a chart, table or summary in response. Power BI’s Copilot can generate a full report page from a prompt like “show monthly revenue by product category.” Tableau’s Ask Data and ThoughtSpot Sage work similarly, translating intent into a query against the governed data model. The ceiling on all of these is the same: the output is only as good as the underlying data model. Poorly named columns, broken relationships and inconsistent metric definitions produce unreliable AI outputs regardless of how good the language model is.
Automated insight generation surfaces patterns and anomalies the user did not ask for. Tableau Pulse monitors key metrics continuously and pushes natural language summaries to Slack and email, flagging when a metric moves outside its expected range without requiring anyone to open a dashboard. Power BI’s Smart Narratives generate written summaries alongside charts. The value here is proactive rather than reactive: the system tells you something changed before you think to ask.
AI-assisted report building reduces the technical overhead of creating and maintaining reports. Power BI Copilot can write DAX measures from a plain English description of the calculation, which meaningfully lowers the barrier for analysts who know what they want but struggle with DAX syntax. Tableau’s Einstein Discovery embeds predictive analytics directly into dashboards, identifying the factors most likely to drive a business outcome without requiring a data scientist to configure a model.
Taken together, these additions move BI meaningfully closer to the self-service promise. But they are additions to the existing model, not replacements for it. The data engineer still builds the pipeline. The analyst still governs the data model. The AI layer sits on top of that foundation and makes it more accessible. Remove the foundation and the AI has nothing trustworthy to query.
The Adoption Gap Nobody Talks About
The AI features exist. The adoption does not match the promise. Three reasons explain most of the gap.
- The best AI features sit behind the highest licensing tiers. Natural language querying at a basic level is available across most BI platforms. The deeper capabilities, Copilot-level report generation, AutoML and advanced anomaly detection, are gated behind premium tiers that many mid-market teams have not purchased or rolled out. The feature exists on the pricing page. It does not exist in the tool most users open on Monday morning.
- Data model quality is a prerequisite most orgs have not met. Every major BI vendor is clear about this in their documentation even if the marketing materials are not: AI outputs are only as reliable as the data model underneath them. An org with inconsistent field naming, missing relationships and three different definitions of “closed won” across its CRM data will get confident-sounding wrong answers from an AI layer built on that foundation. Fixing the model is unglamorous work that predates any AI investment.
- Business users are still not inside the tool. Using AI features in Power BI or Tableau requires being licensed, provisioned and trained on the platform. For many mid-market teams, the BI tool is where the data team lives. Business users in finance, marketing and RevOps are working in spreadsheets. The AI feature in the BI tool does not reach them because they are not in the BI tool.
None of this means the AI additions are not valuable. They are, for the teams and orgs that have the data foundation and the tool access to use them. The gap is between what is technically possible and what is practically deployed across the business users who most need faster answers.
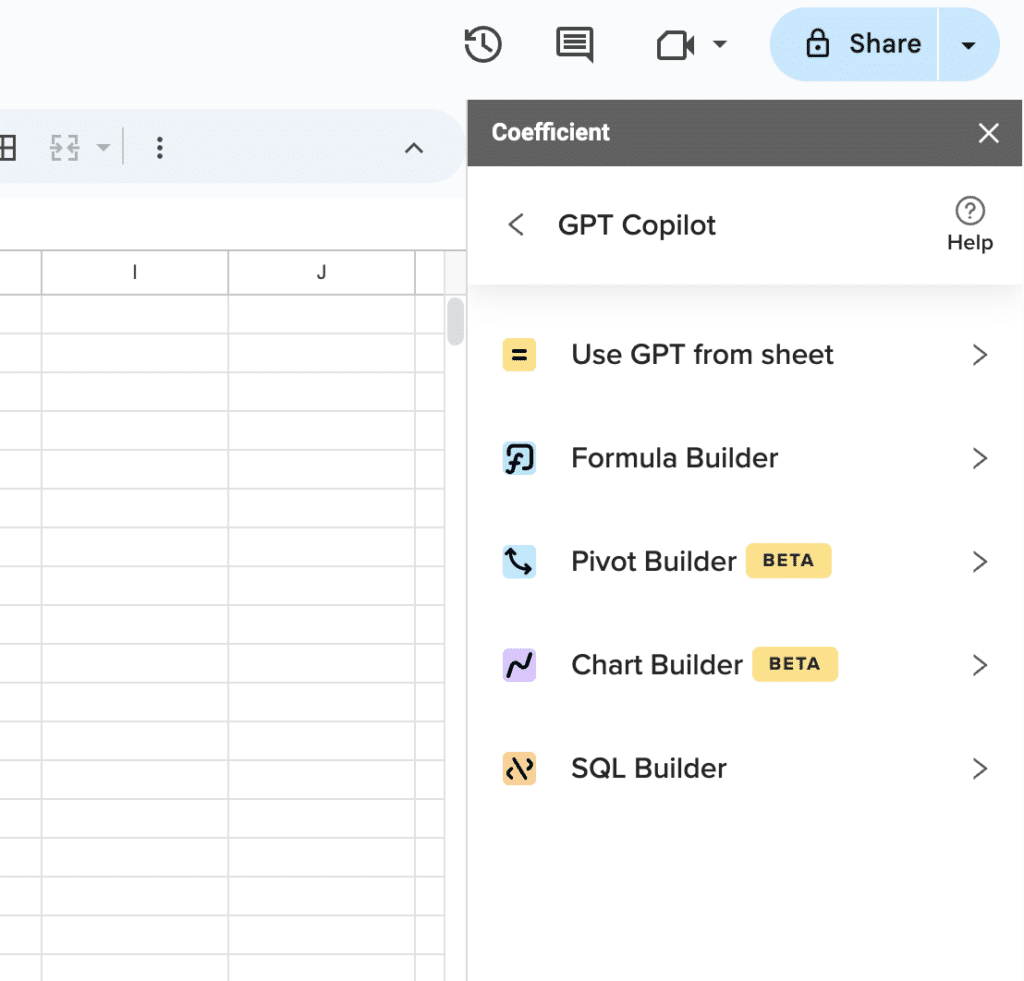
Supercharge your spreadsheets with GPT-powered AI tools for building formulas, charts, pivots, SQL and more. Simple prompts for automatic generation.

Where AI-Native Reporting Fits for Business Teams
For business teams doing operational reporting: pipeline dashboards, financial close tracking, marketing performance, sales scorecards. A full BI stack is often more infrastructure than the job requires. The governance requirements are lighter. The audience is smaller. The questions change week to week. And the people asking them work in Google Sheets or Excel, not in a BI tool.
AI-native reporting tools close the gap by meeting those users where they are. Rather than pulling the business user into a BI platform and training them on it, these tools bring live data and AI directly into the spreadsheet environment the user already works in. The analyst describes what they want in plain English. The AI builds the visualization from live, connected data. The result is a shareable dashboard that updates automatically without anyone maintaining it between views.
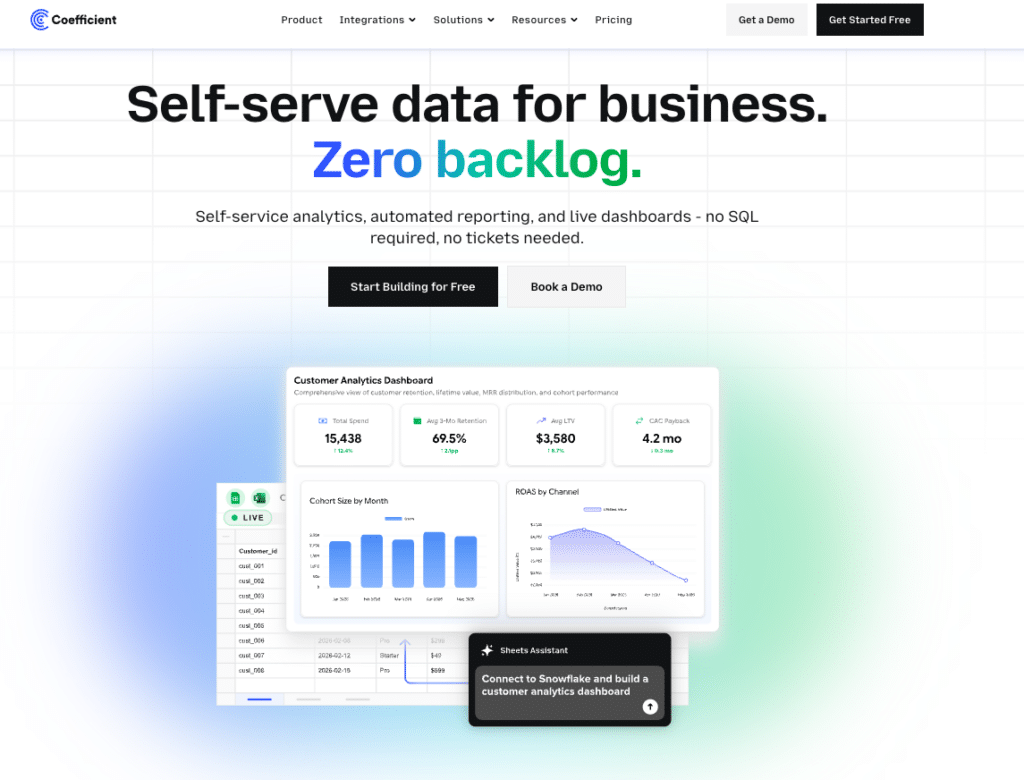
Coefficient’s Live Web Dashboards work on this logic. Live data from 150+ source systems flows into Google Sheets or Excel via scheduled auto-refresh. The AI chat layer builds BI-quality web dashboards from that live data in plain English, shareable via URL without requiring the viewer to have tool access or a license. For teams connected to Snowflake, Coefficient surfaces governed Semantic Views directly, so the AI queries governed metric definitions rather than raw column names. The governance the data team built into the warehouse flows through to the dashboard the business user creates.
The Klaviyo team used this approach to extend live Snowflake data to 50+ business users across finance, marketing and RevOps without SQL skills or BI tool licenses. Evan Cover, Director of BI Engineering and Governance: “We had to move fast, iterate, and ensure data from Snowflake was accessible for non-technical users.” The BI stack governed the data. The AI-native layer delivered it to the people who needed it.
When You Still Need the Full BI Stack
AI-native reporting in spreadsheets is not the answer for every team. There are clear scenarios where a full BI stack is the right investment and where a lighter-weight approach would create more problems than it solves.
A full BI stack earns its place when:
- Governance and auditing are non-negotiable. Regulated industries, public companies and organizations with strict compliance requirements need the schema-level governance, data lineage tracking and access controls that enterprise BI platforms are built for.
- You are building embedded analytics. If analytics are being served inside a product to external customers, a full BI platform with embedding capabilities is the appropriate infrastructure.
- Data access spans hundreds of users with complex permissions. Managing row-level security, role-based access and data masking at scale requires the permission architecture that enterprise BI tools provide natively.
- The reporting requires complex data modeling. Multi-fact data models, complex hierarchies and calculations that cannot be expressed in spreadsheet formulas belong in a governed semantic layer, not a spreadsheet connector.
The argument is not that BI is being replaced. It is that many mid-market teams are paying for BI infrastructure to solve a problem that does not require it. Operational reporting for a finance team of eight, a RevOps team of four and a marketing ops team of three is not the same problem as enterprise-scale governed analytics for five hundred users. Matching the tool to the actual job is the decision.
The Bottom Line
AI is making BI more capable. Natural language querying, automated insight generation and AI-assisted report building are real advances that are changing what analysts can do inside major BI platforms. The gap is in the last mile: getting those capabilities to the business users who need them, in the tools where they actually work.
For teams whose operational reporting lives in spreadsheets, AI-native reporting on top of live data connectivity is closing that gap faster than waiting for BI platform adoption to catch up. The data team governs the foundation. The business user builds the dashboard in plain English. The answer arrives in minutes, not days.Try Coefficient free and build your first AI-powered live dashboard in minutes. Not a standalone BI platform. Requires Google Sheets or Excel.