How to Consolidate Multiple Sheets into a Single Pivot Table in Google Sheets
Consolidating data into a single pivot table not only makes the analysis process easier but also provides clearer insights. But, the task can be daunting if you’re not fully up-to-date on latest practices.
In this blog post, we’ll walk you through a step-by-step guide on how to combine data from several sheets into a single pivot table, along with tips and tricks to streamline your workflow. We’ll also explore how Coefficient and GPT Copilot can help you create complex pivot tables quickly and easily.
Preparing Your Data for Consolidation
Before diving into the consolidation process, it’s crucial to ensure that your data structure is consistent across all sheets. This means using the same column headers, data formats, and naming conventions. Consistent data structure simplifies the consolidation process and reduces the likelihood of errors. You can also use named ranges to make the consolidation process more efficient.
Step-by-Step Guide: Consolidating Data into a Single Pivot Table
1. Open a new Google Sheets spreadsheet
Start by opening a new Google Sheets spreadsheet and creating a new tab for your consolidated pivot table. This will help keep your data organized and easily accessible.
2. Combine data from multiple sheets using the QUERY function
The QUERY function is a powerful tool for combining data from multiple sheets. Its syntax is as follows:
=QUERY({Sheet1!A:D; Sheet2!A:D; Sheet3!A:D}, “SELECT * WHERE Col1 IS NOT NULL”, 1)
his formula combines data from Sheet1, Sheet2, and Sheet3, selecting all columns where the first column is not null.
3. Create a pivot table from the consolidated data
Once you have combined your data, select the entire data range and create a pivot table by clicking on “Data” > “Pivot table.” Choose the appropriate rows, columns, values, and filters for your pivot table.
4. Customize the pivot table
Customize your pivot table by changing the layout, formatting, and appearance. You can also add calculated fields or create custom formulas within the pivot table to gain deeper insights.
5. Analyze and share your insights
With your consolidated pivot table ready, you can now easily analyze your data and gain valuable insights. Share your findings with colleagues or stakeholders by embedding the pivot table in a dashboard or report.
Streamlining the Process with Coefficient’s Cloud Pivot Tables
Coefficient’s Cloud Pivot Table feature lets you directly import data from your tech stack as a pivot table, avoiding the need to manually combine data from multiple sheets.
You can still group data by rows, columns, and values, just like in Google Sheets – just faster. Here’s a step-by-step example of importing data from Salesforce using Cloud Pivot Tables:
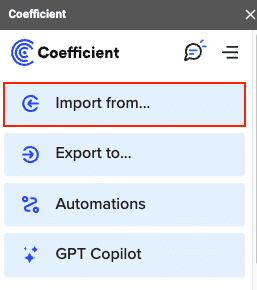
Open the Coefficient Sidebar and select “Import from.”

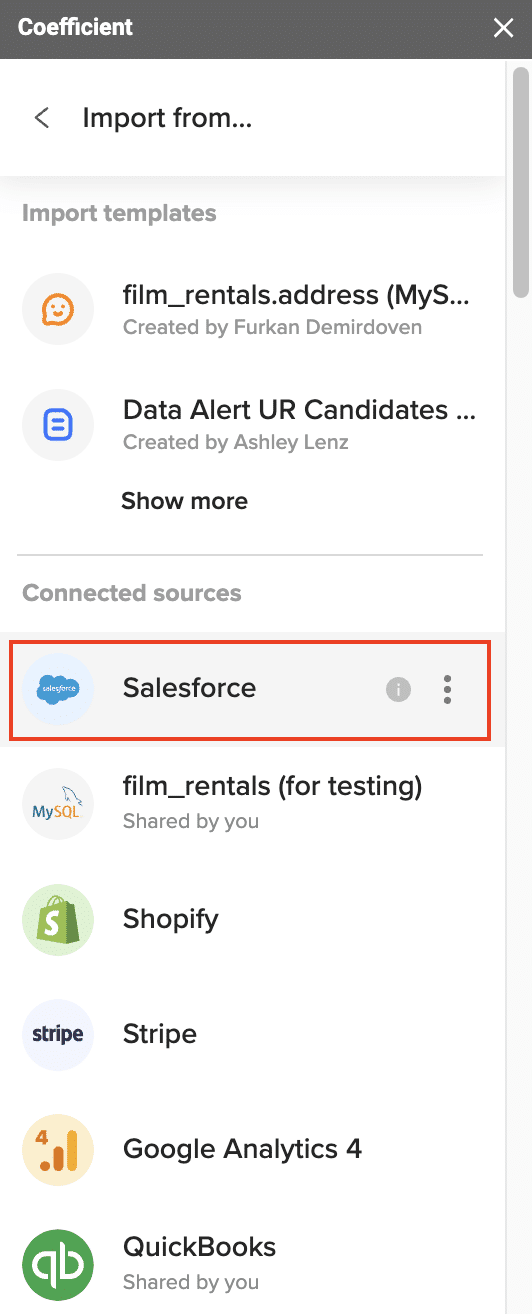
Choose “Salesforce” from the list of data sources.

Supercharge your spreadsheets with GPT-powered AI tools for building formulas, charts, pivots, SQL and more. Simple prompts for automatic generation.


Select “From Objects & Fields” and choose the desired object (e.g., “Opportunity”).

Click “Select fields…” and add the fields you need for your pivot table.

Turn on “Pivot Mode” and drag the fields to the appropriate “Rows,” “Columns,” and “Values” sections.

Set attributes for your pivot table, such as “Group by Quarter,” “Year,” “SUM,” “COUNT,” etc., and click “RUN.”

Using Cloud Pivot Tables simplifies the data consolidation process and enables you to create insightful pivot tables with just a few clicks.

Simplifying Pivot Table Creation with GPT Copilot’s Pivot Table Builder
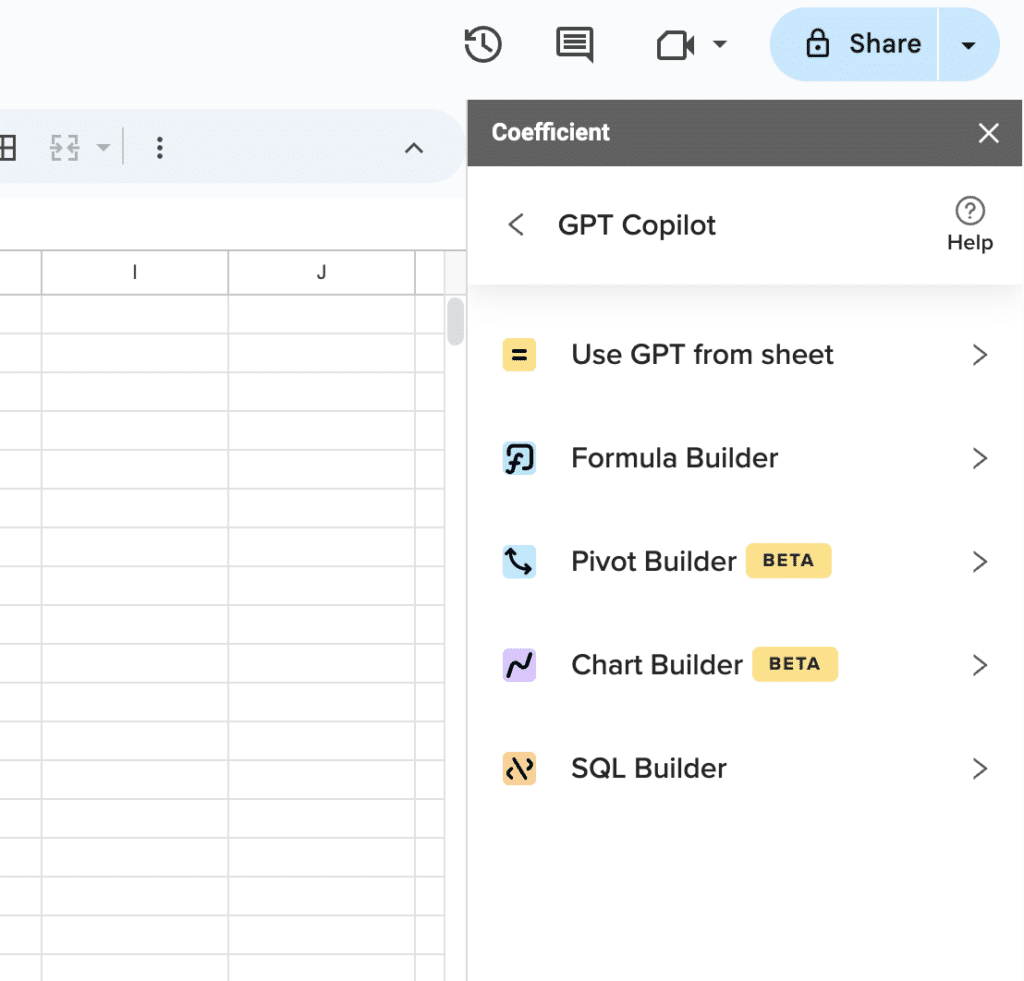
GPT Copilot’s Pivot Table Builder feature allows you to create complex pivot tables using natural language. Simply describe the pivot table you want to create, and GPT Copilot will generate it for you. For example, you can say, “Create a pivot table showing the total revenue by product category and month,” and GPT Copilot will build the pivot table based on your instructions.
This feature is particularly useful for users who may not be familiar with the intricacies of pivot table creation or those who want to save time by quickly generating complex pivot tables.
Additional Tips and Tricks for Working with Consolidated Pivot Tables
- Use named ranges to simplify data consolidation and make your formulas more readable.
- Automate data updates with Coefficient to ensure your pivot tables always reflect the latest information.
- Create dashboard-style reports with multiple pivot tables to present a comprehensive view of your data.
- Share your pivot tables with colleagues or stakeholders to collaborate and make data-driven decisions.
Unlocking the Power of Consolidated Pivot Tables
Consolidating data from multiple sheets into a single pivot table is a game-changer for data analysis in Google Sheets. By following the steps outlined in this guide and leveraging tools like Coefficient and GPT Copilot, you can streamline your workflow, create complex pivot tables quickly, and gain valuable insights from your data.
Try Coefficient for free today and experience the power of seamless data consolidation and analysis. Get started now and take your Google Sheets pivot tables to the next level!


