Ready to boost your email marketing in 2024? It all starts with understanding the right metrics. These content marketing metrics are your roadmap to success, highlighting what works and guiding your strategy towards better results.
Coefficient’s dashboard templates simplify tracking these pivotal metrics, ensuring you’re equipped with the insights to navigate the email marketing terrain confidently.
Let’s dive into the five indispensable email marketing metrics to stay on top of for a successful year. Pro tip: you can combine live marketing data in spreadsheets in minute for both ad hoc and operational reporting.
Top 5 Email Marketing Metrics for 2024
Open Rates by Campaign
Open rates gauge the initial engagement of your email campaigns, providing insight into the effectiveness of your subject lines. If you’re seeing room for improvement on this metric, it can be improved with DMARC verification and monitoring.
Key Benefits:
- Tracks Engagement: Indicates what captures your audience’s attention.
- Informs Content Strategy: Helps refine subject lines and content for better engagement.
- Boosts Campaign Success: High open rates often correlate with stronger campaign performance.
How to Calculate: Open Rate = (Number of Emails Opened / Number of Emails Sent) x 100
How Coefficient’s Email Marketing Report Template Can Help

Coefficient templates offer a streamlined approach to monitoring open rates by integrating real-time data, enabling you to make informed adjustments promptly.
- See What Works: Quickly find out which emails get opened a lot. It helps you know what catches your readers’ attention.
- Make Better Emails: Use what you learn to send emails that your audience will love to open.
- Customize Your Views: Make reports that make sense to you, so you can make smart decisions about your emails.
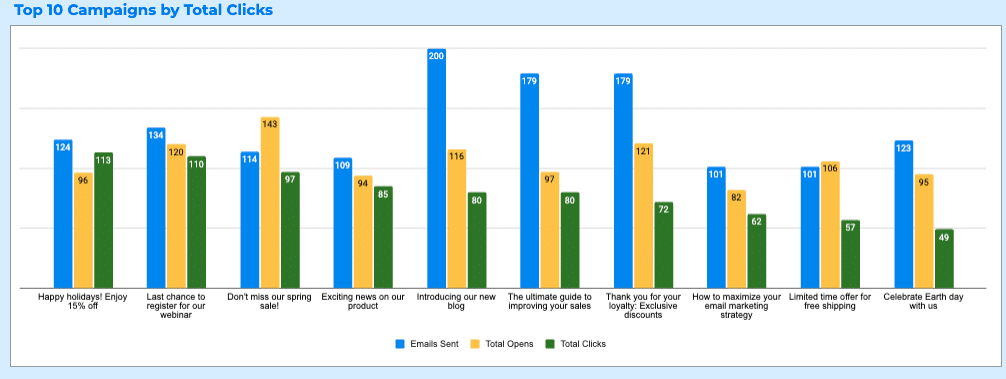
Top Campaigns by Click
This metric identifies which emails prompt recipients to take action, indicating the relevance and effectiveness of your content.
Key Benefits:
- Measures Content Impact: Highlights content that engages and prompts action.
- Drives Conversion Optimization: Identifies successful campaigns to replicate best practices.
- Improves ROI: Focuses efforts on high-performing campaigns to optimize marketing efficiency.
How to Calculate: Click Rate = (Number of Unique Clicks / Number of Emails Delivered) x 100
How Coefficient’s Email Marketing Report Template Can Help

Coefficient facilitates easy analysis of click data, allowing for swift comparison and strategic enhancements based on live performance insights.
- Know What Clicks: See clearly which emails make people want to click and learn more. It shows you what interests your audience.
- Keep Getting Better: Use real info to make your emails more click-worthy over time.
- See What’s Hot: Check out which of your emails are winning so you can do more of what works.
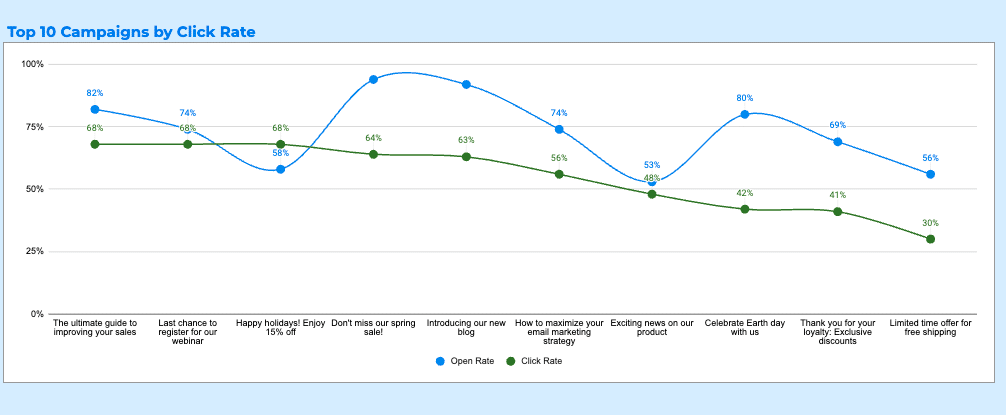
Top Campaigns by Click Rate
The click rate provides a direct indicator of how compelling your email content is, determining which campaigns effectively drive recipient action.
Key Benefits:
- Assesses Engagement: Evaluates the effectiveness of call-to-action elements.
- Guides Content Refinement: Informs on adjusting content for higher engagement and action.
- Maximizes Campaign Efficiency: Enables prioritization of most engaging content formats.
How to Calculate: Click Rate = (Number of Clicks / Number of Emails Delivered) x 100
How Coefficient’s Email Marketing Report Template Can Help

Using Coefficient, you can seamlessly bring click rate data into focus, offering actionable insights to refine your strategies in real time.
- Boost Engagement: Get the lowdown on how to make emails that really get people clicking.
- Smart Comparisons: See how different emails stack up against each other in getting clicks, helping you spot the winners.
- Zoom In On What Works: Focus on making tiny tweaks that can bigly improve how many clicks your emails get.
Email Conversions by Campaign Using GA4 Data and UTMs
This metric measures the effectiveness of your email campaigns in driving specific actions or conversions, providing insight into the overall success of your marketing strategies.

Stop exporting data manually. Sync data from your business systems into Google Sheets or Excel with Coefficient and set it on a refresh schedule.
Get Started
Key Benefits:
- Evaluates Conversion Success: Identifies which campaigns lead to desired actions.
- Informs ROI Analysis: Helps quantify the financial impact of specific email campaigns.
- Enhances Strategy Development: Guides the allocation of resources to high-performing campaigns.
How to Calculate: Utilize Google Analytics 4 (GA4) and UTM parameters to track conversions directly attributed to email campaigns.
Coefficient templates simplify the integration and analysis of conversion data from GA4, making it easier to track and optimize your email marketing efforts.
Email Conversion Rate by Campaign Using GA4 Data and UTMs
The conversion rate measures the efficiency of your email campaigns in converting recipients into customers or leads, signaling the overall effectiveness of your email marketing strategy.
Key Benefits:
- Targets Effective Conversion: Focuses on converting engagements into actionable results.
- Optimizes Marketing Spend: Directs funds towards the most lucrative campaigns.
- Improves Campaign Design: Highlights areas for improvement in crafting compelling offers.
How to Calculate: Conversion Rate = (Number of Conversions / Number of Delivered Emails) x 100
With Coefficient, tracking email conversion rates becomes hassle-free, empowering your marketing team with the necessary insights to refine and elevate campaign strategies dynamically.
Advantages of Integrating Live Data into a Unified Dashboard
Integrating live data into a unified dashboard transforms marketing analytics with solid, tangible benefits:
- Real-Time Data for Swift Campaign Adjustments: Enables immediate access to the freshest data, critical for swiftly tweaking campaigns in response to the latest trends and customer behaviors.
- Centralized Insights & Time Savings: Consolidates data from various sources for a holistic view, significantly reducing time spent on analysis and strategy adjustments, and thereby increasing overall productivity.
- Enhanced Collaboration with Custom Reporting: Improves team collaboration through shared, live data access and allows for the creation of detailed, custom reports tailored to specific strategy needs and stakeholder communication.
Want a quick video walkthrough of how live data in your spreadsheet makes reporting seamless? Analytics expert, Frank Ferris, has you covered.
Success Stories: How Mutiny’s Marketing Operations Team Uses Coefficient
Mutiny leverages Coefficient to aggregate data from multiple marketing platforms into Google Sheets, dramatically enhancing their marketing strategy’s effectiveness and efficiency. This approach provides a comprehensive view of campaign performances and spending effectiveness, supporting swift, strategic adjustments.
The result? Live, accurate data Mutiny can trust to power reporting and hours saved with automated imports.
“Coefficient gives me peace of mind. It allows us to confidently report across the org from BizOps to Finance, Revenue, and our C-Suite, said Brian Chalif, Head of BizOps at Mutiny.
Let Coefficient redefine your marketing data analysis process. Explore our (free) suite of templates and sign up to embark on a journey towards streamlined, data-driven marketing insights.

