Unlock your business insights with Salesforce dashboards! In our fast-paced data world, these dynamic visualizations simplify complex data into clear snapshots.
Ready to transform data into strategic decisions? Let’s dive into creating impactful Salesforce dashboards.
Understanding Dashboards in Salesforce
A Salesforce dashboard is a visual representation of a business’s key data, offering insights into performance and facilitating informed decision-making.
Salesforce dashboards provide a consolidated view of critical metrics and analytics, aiding businesses in tracking key performance indicators (KPIs) and assessing overall organizational health.
Dashboard components include charts, tables, and metrics, presenting data in a comprehensible format. Charts visually represent trends, tables display detailed data, and metrics offer real-time performance indicators.
Preparing to Create Your Dashboard
Before preparing a Salesforce dashboard, ensure essential prerequisites are met. Start by gathering necessary data, emphasizing completeness and accuracy for meaningful insights.
Users should have appropriate permissions to access relevant data sources. Meticulous planning of the Salesforce data layout is crucial, defining key metrics aligned with organizational goals. Tailor the layout to the target audience’s specific needs, enhancing user experience.
A coherent structure, achieved through adequate preparation, ensures a seamless dashboard creation process, optimizing its effectiveness as a tool for data-driven decision-making within the Salesforce environment.
A Step-by-Step Guide to Creating a Salesforce Dashboard
Creating a dashboard in Salesforce is a straightforward process that begins with basic steps. From logging in to defining folders, follow this step-by-step guide on how to create a dashboard in Salesforce for an effective start.
Explore 8 cutting-edge techniques that are revolutionizing how Salesforce admins manage their daily tasks. Contribute more significantly to business outcomes and become a key driver of efficiency and innovation.
See the Techniques
- Log in to Salesforce: Start by logging into your Salesforce account.
- Navigate to Dashboards Tab: Once logged in, locate and click on the “Dashboards” tab in the Salesforce navigation menu.
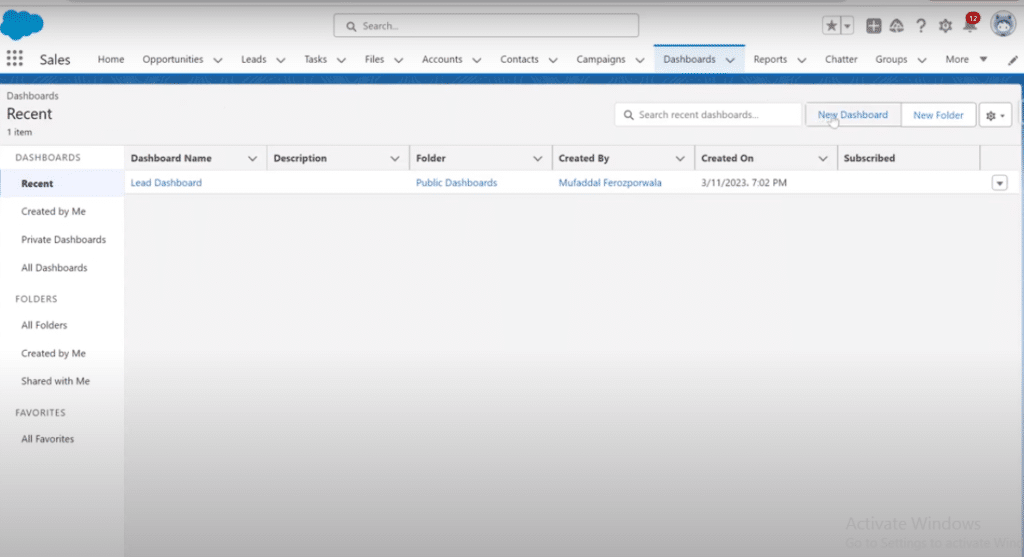
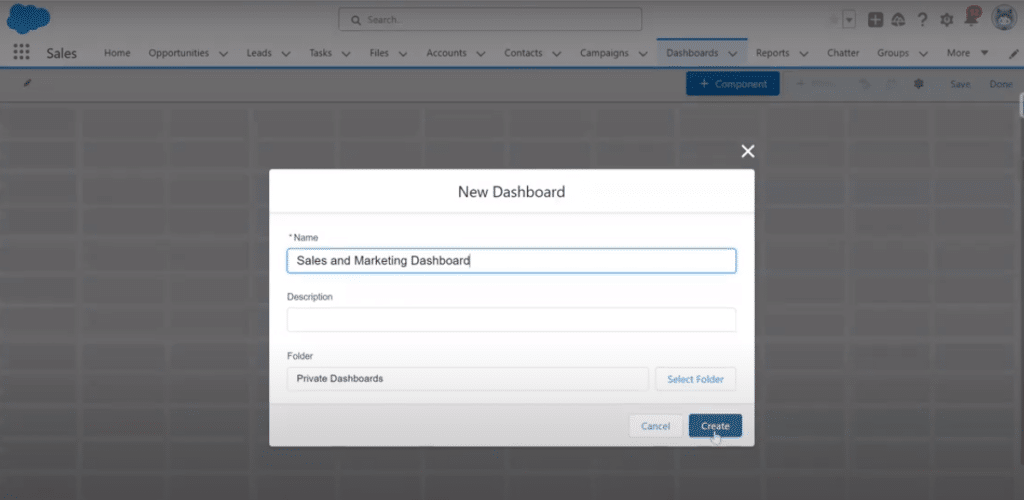
- Name Your Dashboard: On the Dashboards tab, click the “New Dashboard” button. Provide a name for your dashboard in the designated field.
- Add Description (Optional): Optionally, include a description for your dashboard to provide additional context.
- Choose Dashboard Folder: Select the folder where you want to save your dashboard. This helps organize and categorize your dashboards effectively.
- Click Create: After setting the name, description, and folder, click the “Create” button to initiate the dashboard creation process.
Following these steps will help you in building Salesforce dashboards seamlessly.
Customizing Your Salesforce Dashboard
Customizing Salesforce dashboards is integral for tailoring them to specific business needs. Explore the versatility of components, layouts, and filters to optimize data visualization.
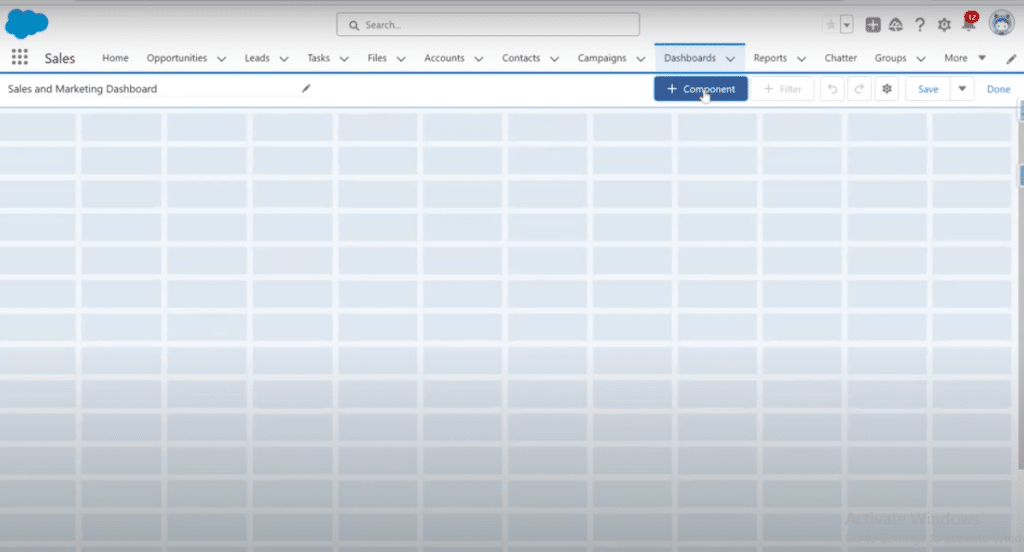
- Add Components: Once your dashboard is ready, click “+ Component” to add components. Components are created through reports, so select a relevant report for your Salesforce dashboard layout.
- Visualize Reports with Various Charts: Choose from a variety of chart types like a horizontal bar, vertical bar, doughnut, funnel, etc to visualize your selected report.
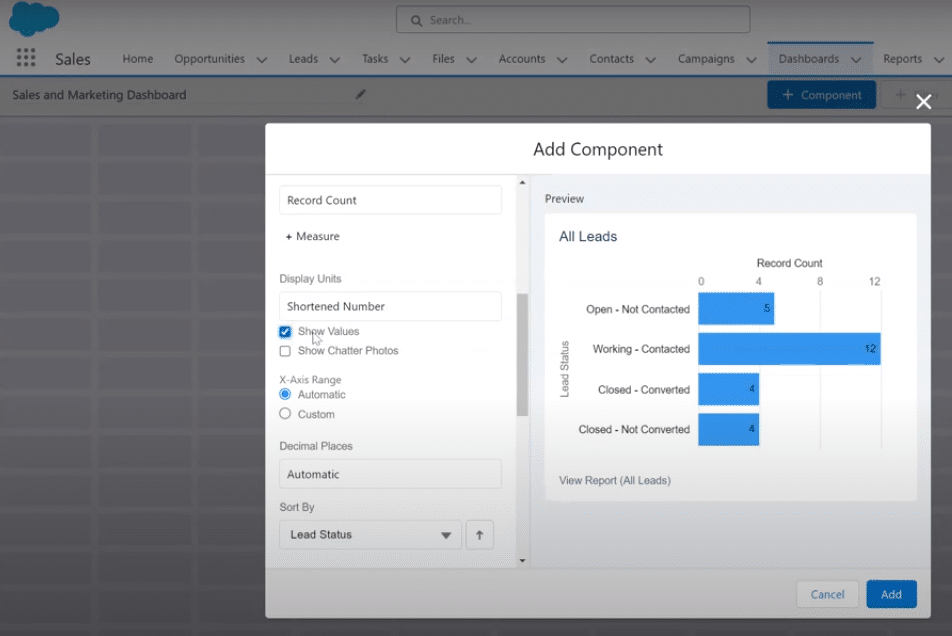
- Customize Component Appearance: Modify the component title and subtitle for clarity. Adjust chart elements such as axes, display units, x-axis range, decimal places, and sorting options to refine data representation.
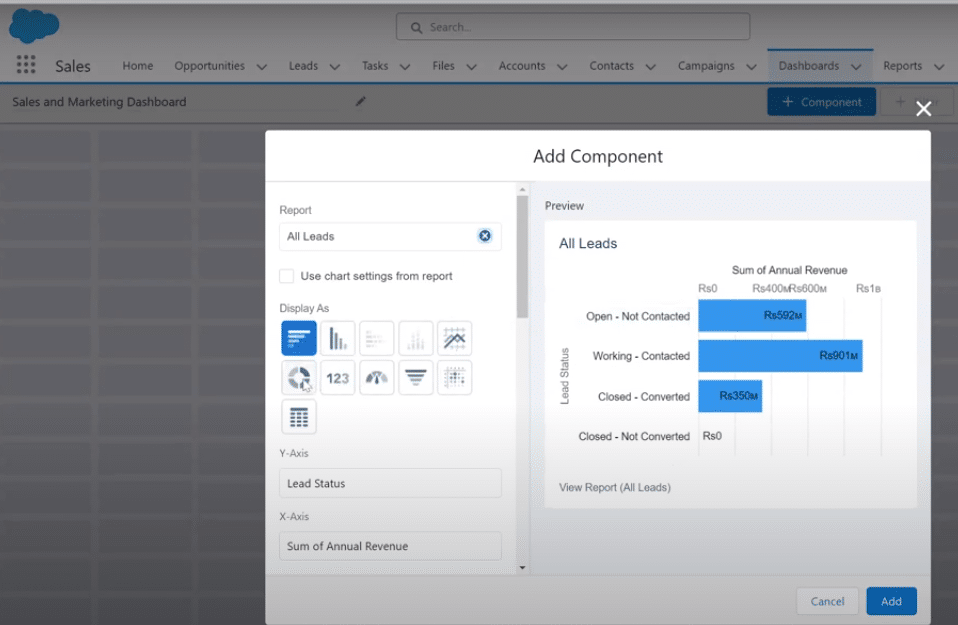
- Explore Additional Customization Options: Look into advanced customization options like custom links, max groups displayed, and more, enhancing the component’s interactivity and relevance.
Best Practices for Salesforce Dashboards
- Activate Dynamic Dashboards. These allow for automatic adjustments based on user interactions, providing tailored insights and a personalized dashboard experience.
- Utilize Sharing Options. Facilitate easy access to critical data among stakeholders, enhancing collaboration and ensuring informed decision-making across the organization.
- Opt for Flexible Data Exploration. Dynamic dashboards adapt to users’ evolving needs, maintaining relevance and user engagement.
- Leverage Collaboration Tools. Use dashboard-sharing features to foster effective communication and teamwork within the organization.
- Utilize Comprehensive Analysis Features. Empower users with in-depth insights and streamlined data sharing, maximizing Salesforce’s capabilities for strategic planning and informed decisions.
Salesforce Dashboards Made Easy
By following these precise steps, organizations ensure optimal utilization of Salesforce’s powerful dashboard features, tailoring insights to meet specific needs. Embrace the versatility of charts, layouts, and filters to craft a dynamic visual representation of key metrics.
Streamline your Salesforce dashboard experience with Coefficient. effortlessly customize dashboards to fit your needs, enhancing decision-making and operational efficiency. Utilize Coefficient for in-depth analysis and strategic insights, maximizing your data management effectiveness.
