Excel reporting is broken. Manual data entry kills productivity. Copy-paste errors destroy credibility. Stale data makes decisions risky.
Smart businesses fix this with dedicated Excel reporting tools.
Here’s what works.
Excel Reporting Tools Comparison Table
| Tool | Best For | Starting Price | Real-time Data | AI Features | Excel Native |
| Coefficient | Live data sync, reporting, dashboard creation | Free | ✓ | ✓ | ✓ |
| Power Query | Microsoft users | Included | ✓ | Limited | ✓ |
| Crystal Reports | Enterprise reporting | $995 | ✓ | ✗ | Partial |
| F9 Excel Reporting | Financial reporting | $1,200 | ✓ | ✗ | ✓ |
| Solver | Budgeting & planning | $175/month | ✓ | ✗ | ✓ |
| Databox | Dashboard creation | $72/month | ✓ | ✗ | ✗ |
| Ajelix | Excel automation | $7/month | Limited | ✓ | ✓ |
| Excelmatic | Data automation | $99/month | ✓ | ✗ | ✓ |
| Tableau | Data visualization | $70/user/month | ✓ | Limited | Partial |
| Power BI | Microsoft ecosystem | $20/user/month | ✓ | ✓ | Partial |
| Sisense | Embedded analytics | Custom | ✓ | ✓ | Partial |
| Klipfolio | KPI dashboards | $20/user/month | ✓ | ✗ | ✗ |
| Looker Studio | Google integration | Free | ✓ | Limited | ✗ |
| Domo | Enterprise BI | Custom | ✓ | ✓ | Partial |
| Qlik Sense | Self-service BI | $30/user/month | ✓ | ✓ | Partial |
| Alteryx | Data preparation | $5,195/year | ✓ | ✓ | Partial |
| Pentaho | Open source BI | Free/Custom | ✓ | Limited | Partial |
| BIRT | Eclipse reporting | Free | ✓ | ✗ | Partial |
| JasperReports | Java reporting | Free | ✓ | ✗ | ✗ |
| Fast Reports | Multi-platform | $399 | ✓ | ✗ | Partial |
1. Coefficient
Coefficient transforms Excel into a live data powerhouse. Connect 100+ business systems directly to spreadsheets. No more manual exports.
Highlights of Coefficient
- 100+ native integrations: Salesforce, HubSpot, QuickBooks, Shopify, Snowflake, and more
- AI powered Functions: AI-powered data analysis in Excel
- Real-time data refresh: Hourly updates on Pro+ plans keep reports current
Pros
- Works inside Excel and Google Sheets natively
- Two-way data sync updates both Excel and source systems
- Free tier includes 3 data sources and 5,000 rows
- No-code setup gets you running in minutes
- Enterprise security with SOC 2 compliance
Cons
- Advanced features require paid plans
- Some complex transformations need multiple steps
- Large datasets may hit refresh limits on lower tiers
Pricing
- Free: $0 (3 data sources, 5K rows/month)
- Pro: $99/user/month (unlimited rows, hourly refresh)
- Enterprise: Custom pricing (advanced security, support)
What do users say about Coefficient?
“Finally, my sales reports update automatically from Salesforce. Coefficient saved me 10 hours per week.” – Sarah M., Sales Operations Manager
“Wish the free tier had more data sources, but the Pro plan is worth every penny.” – Mike R., Finance Director
Support
24/7 chat support for Pro+ users. Extensive documentation, video tutorials, and onboarding assistance. Enterprise customers get dedicated success managers.
2. Power Query
Microsoft’s built-in data connection tool. Ships with Excel 2010+. Connects to databases, web APIs, and file sources without leaving Excel.

Highlights of Power Query
- Native Excel integration: Pre-installed in modern Excel versions
- M language: Powerful query language for complex transformations
- Data refresh: Scheduled updates keep reports current
Pros
- Already included with Excel subscriptions
- Handles complex data transformations well
- Strong database connectivity options
- No additional licensing costs for basic use
Cons
- Steep learning curve for advanced features
- M language requires technical knowledge
- Limited to Microsoft ecosystem integrations
Pricing
- Included with Excel 365 subscriptions
- Excel 2019/2021: Included
- Standalone Excel: May require Office 365 upgrade
What do users say about Power Query?
“Power Query is incredibly powerful once you learn it. The M language takes time but enables amazing data transformations.” – Jennifer L., Data Analyst
“Frustrating for non-technical users. Wish Microsoft made it more user-friendly.” – Robert K., Marketing Manager
Support
Microsoft documentation and community forums. Office 365 subscribers get Microsoft support. Third-party training courses available.
3. Crystal Reports
Enterprise-grade reporting tool by SAP. Industry standard for 30+ years. Handles complex report layouts and high-volume data processing.

Highlights of Crystal Reports
- Enterprise scalability: Processes millions of records efficiently
- Pixel-perfect formatting: Professional report layouts and printing
- Extensive data sources: Connects to 100+ database types
Pros
- Proven enterprise reliability and performance
- Sophisticated report formatting capabilities
- Strong security and user management features
- Excellent for regulated industries requiring audit trails
Cons
- High licensing costs for enterprise features
- Steep learning curve requires training
- Interface feels outdated compared to modern tools
Pricing
- Crystal Reports Developer: $995 one-time
- SAP Crystal Server: Starting at $3,000
- Enterprise licensing: Custom pricing
What do users say about Crystal Reports?
“Crystal Reports handles our complex financial reports perfectly. The formatting options are unmatched.” – David Chen, CFO
“Expensive and difficult to learn, but nothing else handles our regulatory reporting requirements.” – Lisa Thompson, Compliance Manager
Support
SAP provides enterprise support with SLA guarantees. Extensive documentation and training resources. Active user community and third-party consultants.
4. F9 Excel Reporting Software
Financial reporting specialist. Built specifically for Excel-based financial analysis. Integrates with ERP systems and general ledgers.

Highlights of F9 Excel Reporting Software
- Financial focus: Purpose-built for accounting and finance teams
- ERP integration: Direct connections to SAP, Oracle, Sage, QuickBooks
- Excel native: Works entirely within Excel interface
Pros
- Specialized financial reporting functions and templates
- Strong audit trail and change tracking features
- Direct GL account mapping and drill-down capabilities
- Excellent for budget vs. actual variance reporting
Cons
- Limited to financial use cases
- High per-user licensing costs
- Requires training for effective use
Pricing
- Professional: $1,200/user annually
- Enterprise: $1,800/user annually
- Additional modules: $300-500 each
What do users say about F9 Excel Reporting Software?
“F9 revolutionized our month-end reporting. We cut closing time from 10 days to 3 days.” – Amanda Rodriguez, Controller
“Powerful but expensive. The learning curve is significant for new users.” – Mark Stevens, Finance Manager
Support
Dedicated customer success managers. Comprehensive training programs and certification. Phone and email support with guaranteed response times.
5. Solver
Cloud-based reporting and budgeting platform. Designed for financial consolidation and planning. Strong Excel integration with web-based collaboration.

Highlights of Solver
- Financial consolidation: Multi-entity reporting and currency conversion
- Budget planning: Collaborative budgeting with approval workflows
- Excel integration: Push-button publishing to Excel format
Pros
- Comprehensive financial planning and reporting suite
- Strong multi-currency and consolidation features
- Web-based collaboration with Excel output
- Good customer support and training resources
Cons
- Primarily focused on financial use cases
- Interface can feel complex for simple reporting needs
- Higher cost for smaller organizations
Pricing
- BI360 Professional: $175/user/month
- BI360 Enterprise: $275/user/month
- Implementation services: Additional fees
What do users say about Solver?
“Solver handles our complex consolidations perfectly. The budgeting workflow is excellent.” – Patricia Williams, VP Finance
“Feature-rich but overwhelming. Took months to fully implement and train users.” – Kevin Martinez, Accounting Manager
Support
Dedicated implementation specialists. Comprehensive training programs and user certification. Phone, email, and online chat support available.
6. Databox
Marketing-focused dashboard platform. Connects to 100+ marketing and sales tools. Creates visual dashboards that export to PowerPoint and Excel.

Highlights of Databox
- Marketing focus: Pre-built templates for Google Analytics, Facebook Ads, HubSpot
- Dashboard creation: Drag-and-drop interface for visual reports
- Mobile apps: iOS and Android apps for on-the-go reporting
Pros
- Quick setup with pre-built marketing integrations
- Beautiful dashboard designs and visualizations
- Strong mobile experience for executives
- Good value for marketing-focused reporting
Cons
- Limited Excel integration compared to native tools
- Dashboards don’t replace detailed Excel analysis
- Customization options can be restrictive
Pricing
- Free: Up to 3 data sources
- Starter: $72/month (10 data sources)
- Professional: $135/month (25 data sources)
- Enterprise: Custom pricing
What do users say about Databox?
“Databox makes beautiful marketing dashboards. Perfect for executive reporting.” – Rachel Thompson, CMO
“Great for high-level dashboards but lacks the detail we need for deep analysis.” – Tom Anderson, Digital Marketing Manager
Support
Email and chat support for paid plans. Extensive template library and setup guides. Regular webinars and training sessions.
7. Ajelix
AI-powered Excel automation tool. Generates formulas, creates macros, and explains spreadsheet functions using natural language processing.

Highlights of Ajelix
- AI formula generation: Convert plain English to Excel formulas
- VBA macro creation: Generate and explain VBA code automatically
- Template library: Pre-built Excel templates for common use cases
Pros
- Affordable pricing for small businesses and individuals
- AI explanations help users learn Excel functions
- Quick formula generation saves time
- Good for Excel skill development
Cons
- Limited data connectivity compared to enterprise tools
- AI accuracy varies with complex requirements
- Primarily focused on formula assistance vs. reporting
Pricing
- Free: 5 requests/month
- Premium: $7/month (unlimited requests)
- Professional: $15/month (additional features)
What do users say about Ajelix?
“Ajelix helped me learn complex Excel formulas quickly. Great for beginners.” – Susan Lee, Project Coordinator
“Useful for simple formulas but struggles with complex business logic.” – Anthony Rodriguez, Business Analyst
Support
Email support and extensive knowledge base. AI chat assistant for formula help. Community forum for user questions.
8. Excelmatic
Workflow automation platform for Excel. Connects spreadsheets to web applications and databases. Focuses on data synchronization and process automation.

Highlights of Excelmatic
- Workflow automation: Trigger actions based on spreadsheet changes
- API connectivity: Connect Excel to REST APIs and web services
- Data validation: Automated data quality checks and error handling
Pros
- Strong automation capabilities for repetitive tasks
- Good API integration for custom connections
- Workflow triggers reduce manual intervention
- Reasonable pricing for automation features
Cons
- Requires technical knowledge for complex setups
- Limited pre-built connectors compared to competitors
- Interface design could be more intuitive
Pricing
- Starter: $99/month (5 workflows)
- Professional: $199/month (25 workflows)
- Enterprise: Custom pricing
What do users say about Excelmatic?
“Excelmatic automated our inventory updates perfectly. Saves hours of manual work.” – James Murphy, Operations Manager
“Powerful but requires some technical skills to set up properly.” – Maria Gonzalez, Data Manager
Support
Email and chat support with technical assistance. Documentation and tutorial videos. Custom implementation services available.
9. Tableau
Industry-leading data visualization platform. Connects to hundreds of data sources. Creates interactive dashboards that can export to Excel format.

Highlights of Tableau
- Advanced visualizations: Industry-leading chart types and interactive features
- Data preparation: Built-in data cleaning and transformation tools
- Enterprise scalability: Handles massive datasets efficiently
Pros
- Unmatched visualization capabilities and flexibility
- Strong community and extensive training resources
- Excellent performance with large datasets
- Comprehensive data connector library
Cons
- High licensing costs for full feature access
- Steep learning curve for advanced features
- Limited native Excel integration
Pricing
- Tableau Creator: $70/user/month
- Tableau Explorer: $42/user/month
- Tableau Viewer: $15/user/month
What do users say about Tableau?
“Tableau creates stunning visualizations that Excel simply can’t match. Worth the investment.” – Dr. Elizabeth Park, Research Director
“Expensive and complex. Overkill for simple Excel reporting needs.” – Carlos Mendez, Small Business Owner
Support
Comprehensive support portal with extensive documentation. Community forums with active user participation. Training and certification programs available.
10. Power BI
Microsoft’s business intelligence platform. Tight integration with Excel and Office 365. Strong data modeling and visualization capabilities.

Highlights of Power BI
- Office 365 integration: Seamless connectivity with Microsoft ecosystem
- DAX language: Powerful data modeling and calculation engine
- Excel connectivity: Import Excel models and export Power BI data
Pros
- Excellent value for Microsoft-centric organizations
- Strong integration with Excel and other Office tools
- Regular feature updates and improvements
- Good mobile app experience
Cons
- Best features require premium licensing
- Can feel overwhelming for simple reporting needs
- Data refresh limitations on lower tiers
Pricing
- Power BI Pro: $20/user/month
- Power BI Premium Per User: $25/user/month
- Power BI Premium Per Capacity: Starting at $6,858/month
What do users say about Power BI?
“Power BI transformed our reporting capabilities. Great value for Microsoft shops.” – Michelle Carter, IT Director
“Feature-rich but complex. Takes time to master all the capabilities.” – Jose Martinez, Finance Analyst
Support
Microsoft support included with subscriptions. Extensive documentation and learning paths. Active community forums and user groups.
11. Sisense
AI-driven analytics platform. Specializes in complex data preparation and embedded analytics. Strong API capabilities for custom integrations.

Highlights of Sisense
- AI-powered insights: Automated anomaly detection and trend analysis
- Complex data handling: Processes multiple data sources simultaneously
- Embedded analytics: White-label reporting for customer-facing applications
Pros
- Excellent handling of complex, multi-source datasets
- Strong AI and machine learning capabilities
- Good performance with large data volumes
- Comprehensive API for custom integrations
Cons
- High cost for enterprise features
- Complex setup requires technical expertise
- Limited native Excel integration
Pricing
- Custom pricing based on data volume and users
- Typical enterprise implementations: $50,000+ annually
- Contact sales for specific quotes
What do users say about Sisense?
“Sisense handles our complex multi-source analytics beautifully. The AI insights are valuable.” – Dr. Robert Kim, Analytics Director
“Powerful platform but significant investment in time and money required.” – Linda Chang, Business Intelligence Manager
Support
Dedicated customer success managers for enterprise clients. Comprehensive training and certification programs. 24/7 technical support available.
12. Klipfolio
Dashboard and KPI platform. Focuses on real-time data visualization. Good Excel integration for data export and template creation.

Highlights of Klipfolio
- Real-time dashboards: Live data updates for critical business metrics
- KPI focus: Purpose-built for key performance indicator tracking
- Data blending: Combines multiple data sources in single visualizations
Pros
- Intuitive dashboard creation interface
- Strong focus on KPI and metric tracking
- Good customer support and training resources
- Reasonable pricing for small to medium businesses
Cons
- Limited advanced analytics capabilities
- Data transformation options could be better
- Excel integration is primarily one-way (export only)
Pricing
- Klipfolio PowerMetrics: $20/user/month
- Klipfolio Klips: Starting at $100/month
- Enterprise: Custom pricing
What do users say about Klipfolio?
“Klipfolio makes tracking our KPIs simple and visual. Great for executive dashboards.” – Taylor Johnson, VP Operations
“Good for basic dashboards but lacks the depth we need for detailed analysis.” – Ahmed Hassan, Data Analyst
Support
Email and chat support with guaranteed response times. Knowledge base and video tutorials. Regular webinars and best practice sessions.
13. Looker Studio
Google’s free business intelligence platform. Excellent integration with Google Workspace and Analytics. Creates shareable dashboards and reports.

Highlights of Looker Studio
- Google integration: Native connectivity to Google Analytics, Ads, Sheets
- Free tier: Comprehensive features at no cost
- Collaboration: Easy sharing and collaboration on reports
Pros
- Completely free for most use cases
- Excellent Google ecosystem integration
- Easy to learn and use interface
- Good collaboration and sharing features
Cons
- Limited to Google and partner data connectors
- Basic Excel integration (import only)
- Can be slow with large datasets
Pricing
- Looker Studio: Free
- Looker Studio Pro: $9/user/month (coming soon)
What do users say about Looker Studio?
“Amazing value – can’t beat free! Perfect for Google Analytics reporting.” – Crystal Lopez, Digital Marketing Specialist

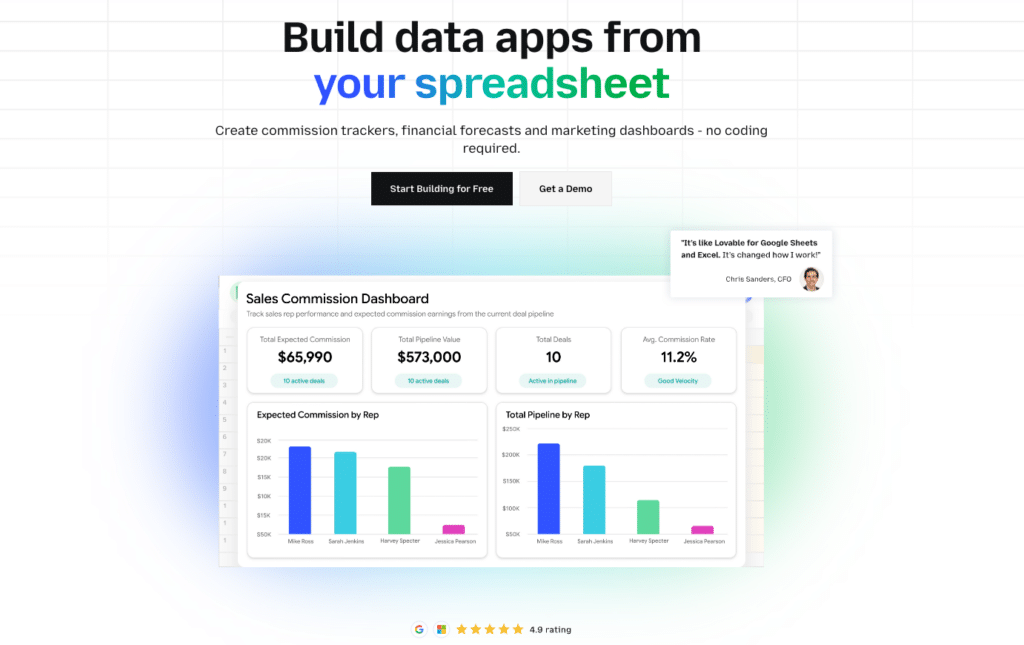
Stop exporting data manually. Sync data from your business systems into Google Sheets or Excel with Coefficient and set it on a refresh schedule.
Get Started
“Works great for Google data but limited options for other sources.” – Peter Williams, Marketing Director
Support
Community forums and extensive documentation. Google support for Workspace customers. Third-party training resources available.
14. Domo
Cloud-based business intelligence platform. Strong mobile experience and social collaboration features. Good Excel connectivity and export options.

Highlights of Domo
- Mobile-first design: Excellent smartphone and tablet experience
- Social collaboration: Comment and share features for team collaboration
- Executive focus: Designed for C-suite and executive reporting needs
Pros
- Outstanding mobile experience for executives
- Strong data governance and security features
- Good customer support and success programs
- Comprehensive connector library
Cons
- High cost for full feature access
- Complex pricing structure
- Overkill for simple reporting needs
Pricing
- Custom pricing based on users and data volume
- Typical implementations: $83,000+ annually
- Contact sales for specific quotes
What do users say about Domo?
“Domo’s mobile experience is unmatched. Perfect for our executive team.” – Sandra Chen, Chief of Staff
“Expensive but delivers value for large organizations with complex needs.” – Michael Rodriguez, Director of Analytics
Support
Dedicated customer success teams. Comprehensive training and certification programs. 24/7 technical support for enterprise customers.
15. Qlik Sense
Self-service business intelligence platform. Associative data model enables flexible exploration. Good Excel integration and export capabilities.

Highlights of Qlik Sense
- Associative model: Unique data exploration approach shows hidden relationships
- Self-service analytics: Business users can create their own reports
- In-memory processing: Fast performance with large datasets
Pros
- Innovative associative data model for exploration
- Strong self-service capabilities for business users
- Good performance with complex datasets
- Comprehensive training and certification programs
Cons
- Learning curve for associative model concept
- Can be expensive for larger deployments
- Excel integration requires additional configuration
Pricing
- Qlik Sense Business: $30/user/month
- Qlik Sense Enterprise SaaS: Custom pricing
- On-premises: Contact for quotes
What do users say about Qlik Sense?
“Qlik’s associative model revealed insights we never knew existed in our data.” – Jennifer Park, VP Strategy
“Powerful but different approach takes time to learn and appreciate.” – Carlos Martinez, Business Analyst
Support
Comprehensive support portal and knowledge base. Qlik Community with active user participation. Professional services and training available.
16. Alteryx
Data preparation and advanced analytics platform. Strong Excel connectivity for input and output. Focuses on data blending and preparation.

Highlights of Alteryx
- Data preparation: Industry-leading data cleaning and transformation tools
- Predictive analytics: Built-in machine learning and statistical functions
- Excel integration: Native Excel input/output with formatting preservation
Pros
- Exceptional data preparation and cleaning capabilities
- Strong predictive analytics and machine learning tools
- Good Excel integration maintains formatting
- Extensive community and training resources
Cons
- High licensing costs for full capabilities
- Requires training for effective use
- Overkill for simple reporting tasks
Pricing
- Alteryx Designer: $5,195/user/year
- Alteryx Server: Additional licensing required
- Cloud offerings: Contact for pricing
What do users say about Alteryx?
“Alteryx transformed our data preparation process. The time savings are incredible.” – Dr. Rachel Kim, Data Science Manager
“Powerful but expensive. Hard to justify cost for smaller analytics teams.” – Tony Martinez, Business Intelligence Analyst
Support
Comprehensive support included with licensing. Alteryx Academy for training and certification. Active community forums and user groups.
17. Pentaho
Open-source business intelligence platform by Hitachi Vantara. Comprehensive reporting, dashboards, and data integration. Good Excel export capabilities.

Highlights of Pentaho
- Open source: Community edition available at no cost
- Comprehensive platform: Full BI suite including ETL, reporting, and analytics
- Enterprise support: Commercial support available from Hitachi Vantara
Pros
- Open source option reduces licensing costs
- Comprehensive business intelligence platform
- Strong data integration and ETL capabilities
- Active open source community
Cons
- Requires technical expertise for implementation
- User interface feels dated compared to modern tools
- Enterprise features require commercial licensing
Pricing
- Pentaho Community Edition: Free
- Pentaho Enterprise Edition: Custom pricing
- Professional services: Additional fees
What do users say about Pentaho?
“Pentaho provides enterprise BI capabilities at a fraction of the cost.” – David Thompson, IT Manager
“Powerful but requires significant technical knowledge to implement effectively.” – Lisa Rodriguez, Systems Administrator
Support
Community support for open source version. Enterprise support available for commercial customers. Extensive documentation and tutorials.
18. BIRT (Business Intelligence Reporting Tools)
Eclipse-based open source reporting platform. Strong report design capabilities. Good Excel output formatting and export options.

Highlights of BIRT
- Eclipse integration: Leverages Eclipse development environment
- Open source: Completely free with source code access
- Report design: Sophisticated report layout and formatting tools
Pros
- Completely free and open source
- Strong report design and formatting capabilities
- Good Excel export with formatting preservation
- Active developer community
Cons
- Requires Eclipse development environment
- Limited modern web interface options
- Technical setup can be challenging
Pricing
- BIRT Runtime: Free
- BIRT Designer: Free
- Commercial support: Available from various vendors
What do users say about BIRT?
“BIRT provides professional reporting capabilities at zero cost. Great for budget-conscious projects.” – Steve Chang, Software Developer
“Powerful but requires significant development expertise to implement.” – Maria Santos, IT Director
Support
Community forums and extensive documentation. Commercial support available from various vendors. Eclipse Foundation resources.
19. JasperReports
Java-based reporting platform by TIBCO. Strong enterprise reporting capabilities. Exports to Excel with good formatting support.

Highlights of JasperReports
- Java platform: Integrates well with Java enterprise applications
- Enterprise features: Advanced security, scheduling, and distribution
- Multiple outputs: Excel, PDF, HTML, and other export formats
Pros
- Strong enterprise reporting capabilities
- Good Java ecosystem integration
- Professional report design tools
- Comprehensive export format support
Cons
- Primarily for Java development environments
- Commercial features require TIBCO licensing
- Can be complex for simple reporting needs
Pricing
- JasperReports Community: Free
- TIBCO JasperReports Server: Starting at $3,000
- Enterprise licensing: Custom pricing
What do users say about JasperReports?
“JasperReports handles our complex enterprise reporting requirements perfectly.” – Kevin Park, Enterprise Architect
“Great for Java shops but overkill for simple Excel-based reporting.” – Andrea Martinez, Business Analyst
Support
Community support for open source version. TIBCO provides enterprise support for commercial customers. Extensive documentation available.
20. Fast Reports
Multi-platform reporting solution. Supports various development environments. Good Excel export capabilities and formatting.

Highlights of Fast Reports
- Multi-platform: Supports .NET, Java, PHP, and other platforms
- Visual designer: WYSIWYG report design interface
- Excel integration: Native Excel export with formatting
Pros
- Supports multiple development platforms
- Good visual report designer
- Reasonable pricing for feature set
- Regular updates and improvements
Cons
- Primarily developer-focused tool
- Limited business user interface
- Smaller community compared to major platforms
Pricing
- FastReport .NET: $399/developer
- FastReport VCL: $299/developer
- FastReport Java: $499/developer
What do users say about Fast Reports?
“Fast Reports provides good value for .NET development projects.” – Sarah Johnson, Software Developer
“Functional but interface feels dated compared to modern alternatives.” – Alex Rodriguez, Development Manager
Support
Email support and knowledge base. Community forums for user questions. Regular software updates included.
Which Excel reporting tool is right for you?
Excel reporting doesn’t have to be painful.
The right tool transforms manual drudgery into automated insights. Coefficient leads the pack with native Excel integration and 70+ business system connections. Power Query handles Microsoft-centric environments well. Enterprise teams need Crystal Reports or Solver for complex requirements.
Small businesses should start with Ajelix or Looker Studio. Marketing teams love Databox’s visual dashboards. Developers prefer programmatic solutions like ReportLab or BIRT.
Choose based on your technical skills, budget, and integration needs.
Ready to eliminate manual Excel reporting forever? Get started with Coefficient today and connect your first data source in under 5 minutes. Your future self will thank you.


