
Drill down tables in Tableau help you dig deeper into your data, revealing more details with just a click. Here’s how to build a drill down table focused on sales values by region and state.
Tableau Drill Down Table: Getting Started
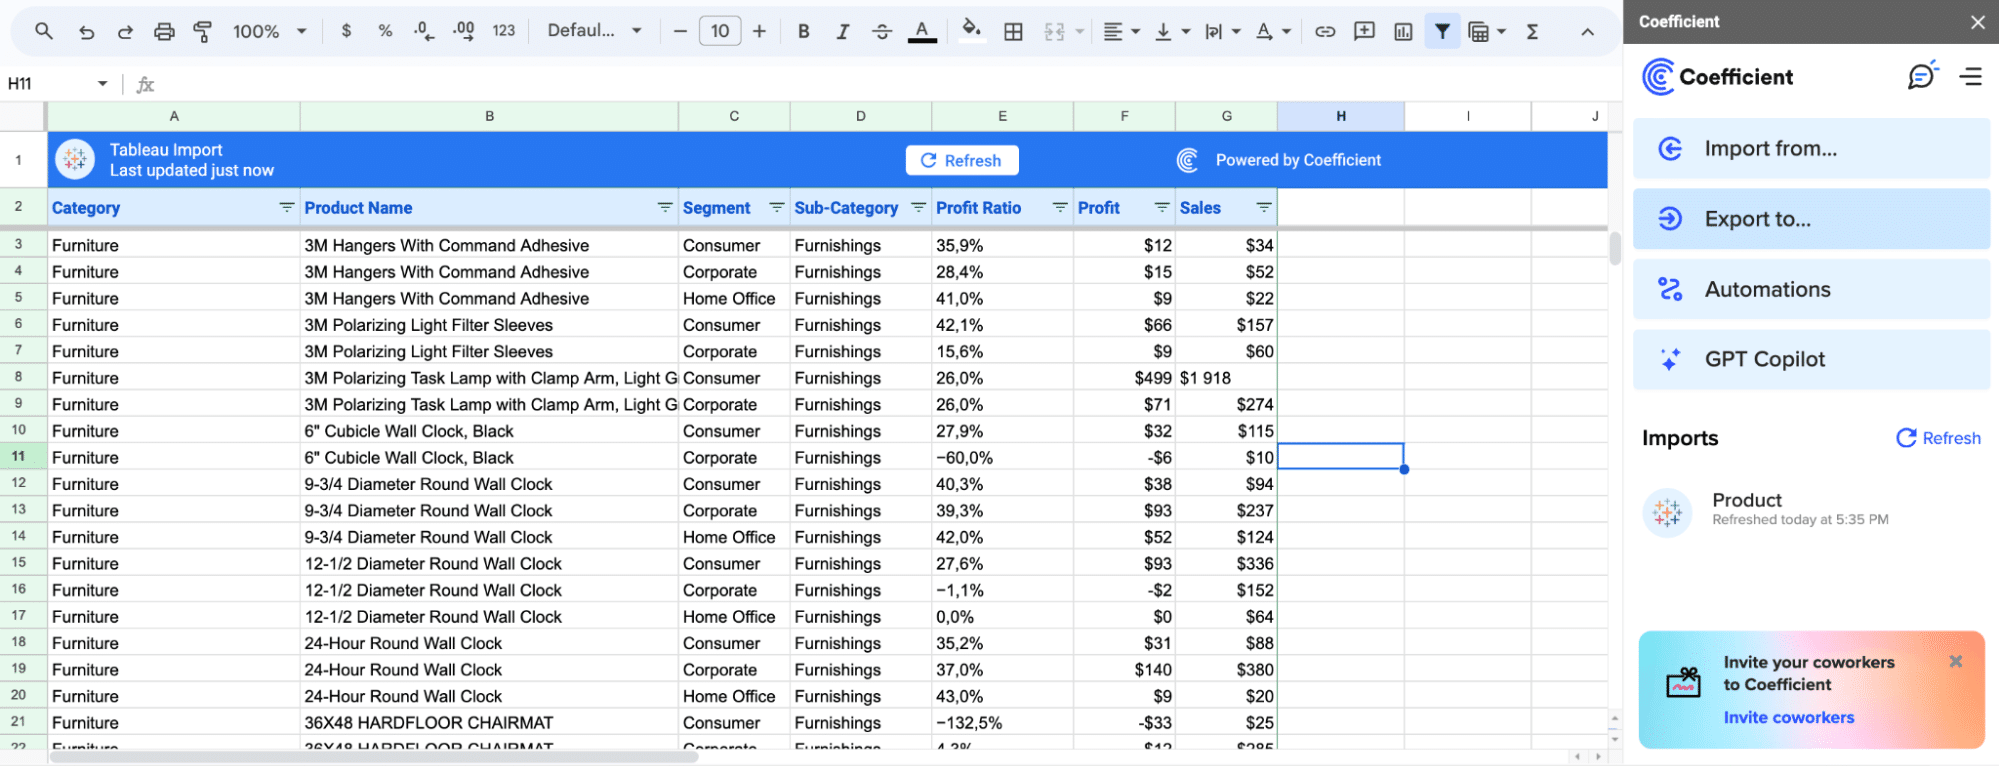
Before diving into creating drill down tables in Tableau, it’s important to consider the data preparation process.
Many teams rely on spreadsheets or databases that require regular updates. This is where tools like Coefficient can be incredibly helpful. Coefficient ensures that your source data in Excel or Google Sheets remains live and up-to-date, integrating seamlessly with your broader data ecosystem, including Tableau.
To ensure a smooth data integration process, consider the following:
- Data Compatibility: Make sure the structure, types, and formats of your data align with your Tableau workbook’s current setup and dashboards.
- Calculations and Relationships: Adapt calculations, parameters, filters, and relationships to work with the updated data source. This may involve refining formula references or redefining dynamic relationships.
- Automated Updates: Use a tool that automatically refreshes your data, keeping everything current without manual effort. Coefficient excels at this, ensuring your data is always ready for analysis in Tableau or spreadsheets.
Klaviyo, for instance, revolutionized their reporting process by embracing Coefficient.
By leveraging Coefficient’s capabilities directly within their spreadsheets, they eliminated the need for ad-hoc data requests and manual reporting that would otherwise be required in Tableau.
Step-by-Step Guide: Creating a Tableau Drill Down Table
Step 1. Choosing Your Region
First, identify the data category for the drill down—’Region’ in this example.

Step 2. Making a Region Set
Next, you create a set for your chosen region to build the basis of your drill down.

Step 3. Setting Up Actions for the Region Set
Navigate to where you can add actions in your worksheet.
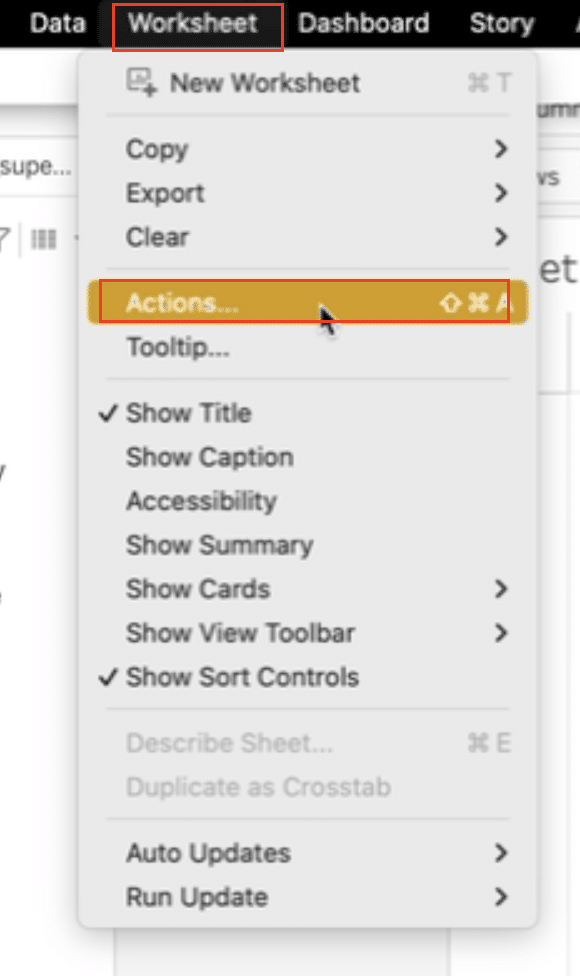
Then, add a new action that allows your region set to change based on your selection.
Step 4. Creating a State-Based Calculated Field
Click on ‘State’ to start making a calculated field.

Stop exporting data manually. Sync data from your business systems into Google Sheets or Excel with Coefficient and set it on a refresh schedule.
Get Started

Name your field and set up its calculations for the state drill down.
- Time Stamp: 0:48 – 1:05

Step 5. Setting Up Your Table for Drill Down
Start by dragging States and Regions in rows for an organized view.
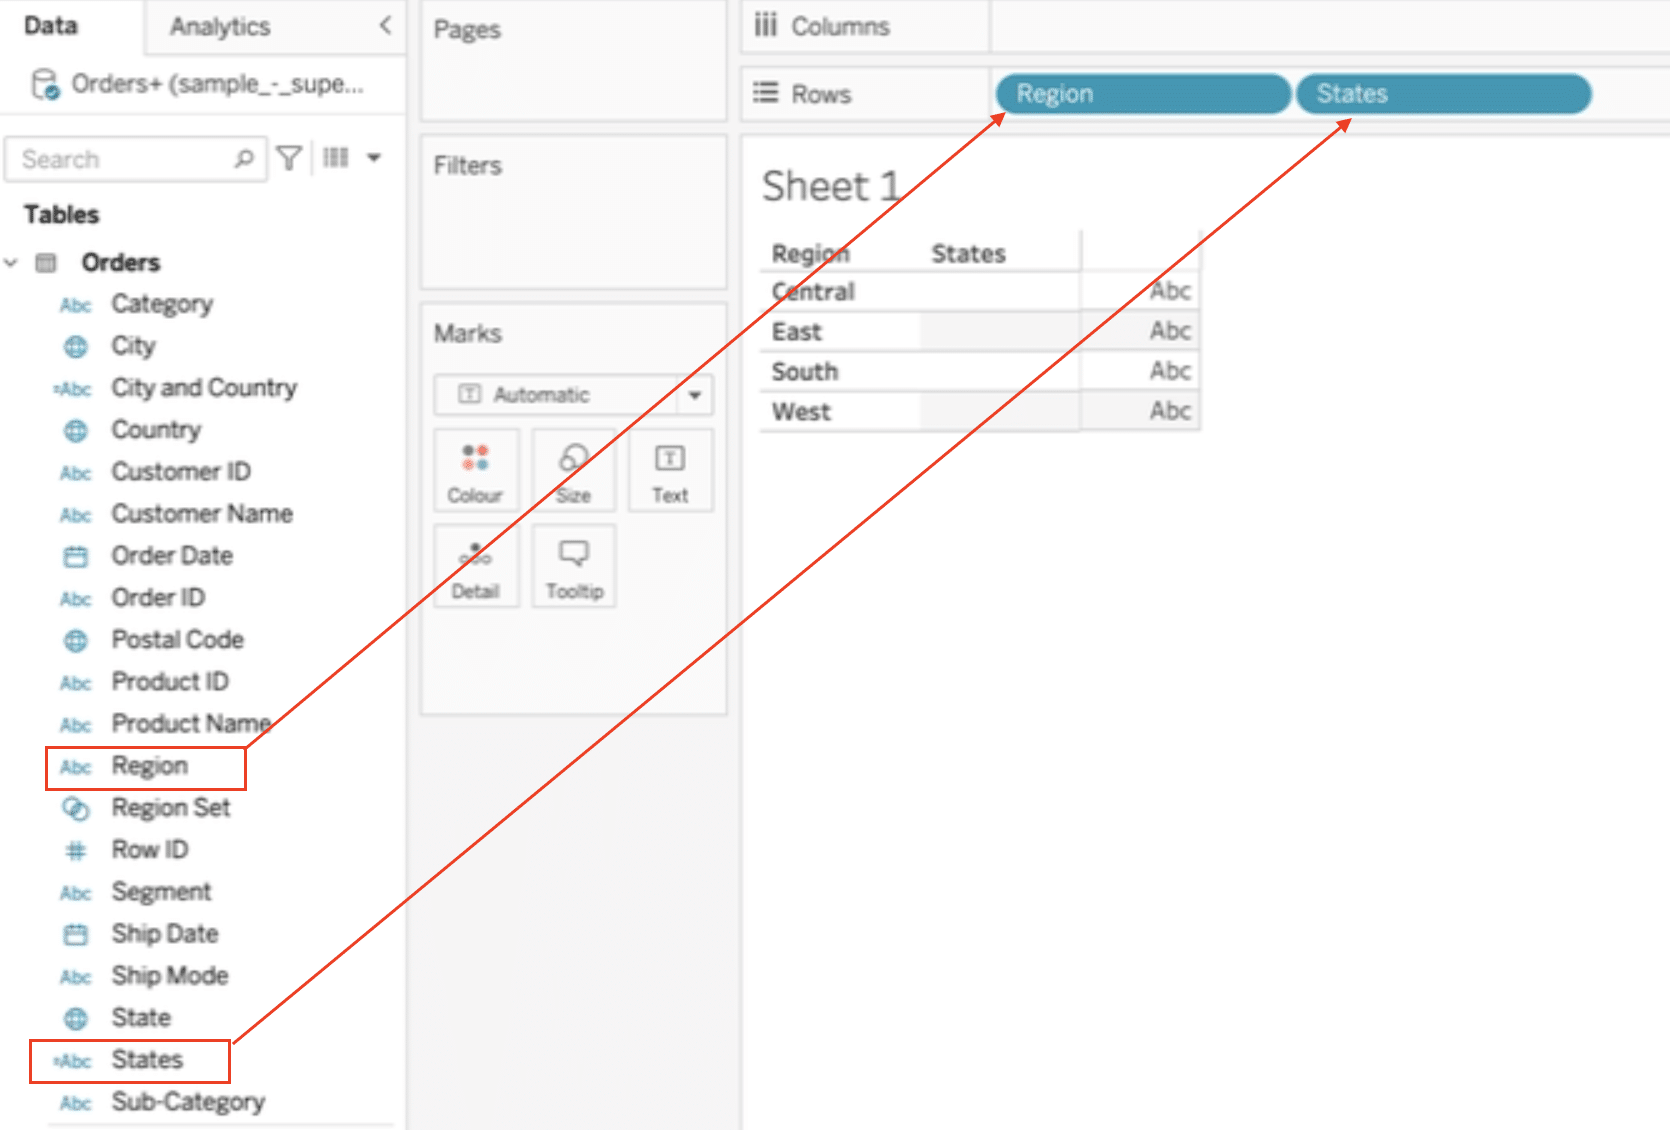
Drag Sales in Column to complete your setup.

Step 6. Showing the Drill Down
Finally, click on a region to see states and their sales values come alive.

Enhancing Your Tableau Drill Down Table: Tips and Tricks
- Keep Data Structure Consistent: Make sure your data is organized in the same way across all datasets. This consistency helps Tableau understand and navigate your data more effectively, making your drill-downs seamless.
- Use Calculated Fields Wisely: Calculated fields are great for customizing your analysis in Tableau. Use them to adjust your data on the fly, enriching your drill downs with deeper insights.
- Experiment and Learn: The best way to improve your Tableau skills is through trying new things. Don’t be afraid to experiment with different settings and features. Each attempt teaches you something new and could lead to more effective visualizations.
Tableau Drill Down Table: Getting Your Hands on Data
Follow these steps to easily create a “Tableau Drill Down Table”. This guide is designed to help you build informative tables for deeper data analysis.
Remember, starting with well-prepared data is key. Coefficient can streamline your data integration, keeping your Tableau workbooks up-to-date.
Start using Coefficient today to enhance your data analysis in Tableau.


