
Understanding Tableau data types is foundational for any data analyst or business intelligence professional looking to leverage the full power of Tableau’s visualization capabilities.
Tableau simplifies data analysis by intelligently assigning data types, but it also provides flexibility to adjust these as your dataset requirements evolve.
This blog will teach you what you need to know. Let’s dive in!
Understanding Tableau Data Types
Before we dive into Tableau data types, it’s crucial to discuss the importance of access to accurate data.
Coefficient streamlines this process by enabling the direct import of live data from various business systems into spreadsheets. This ensures your data is accurate.
Here is an overview of the primary data types utilized within Tableau:
- String: Utilized for text data that does not require mathematical operations. Ideal for descriptive data such as names and categories.
- Numeric: Includes integers (whole numbers) and floats (numbers with a fractional component), catering to a range of quantitative analyses.
- Boolean: Represents binary choices within data, encapsulating decisions in a true/false format.
- Date: Essential for recording specific dates, enabling temporal analysis without time granularity.
- Date & Time: Expands upon the Date type by incorporating specific times, offering precision in timestamp analysis.
- Geographic: Facilitates location-based analyses through map-based visualizations.
- Cluster Group: Represents aggregated groups identified within Tableau’s analytical features, aiding in segmented analysis.
Identifying and Changing Data Types in Tableau
Interacting with Numeric Data Types
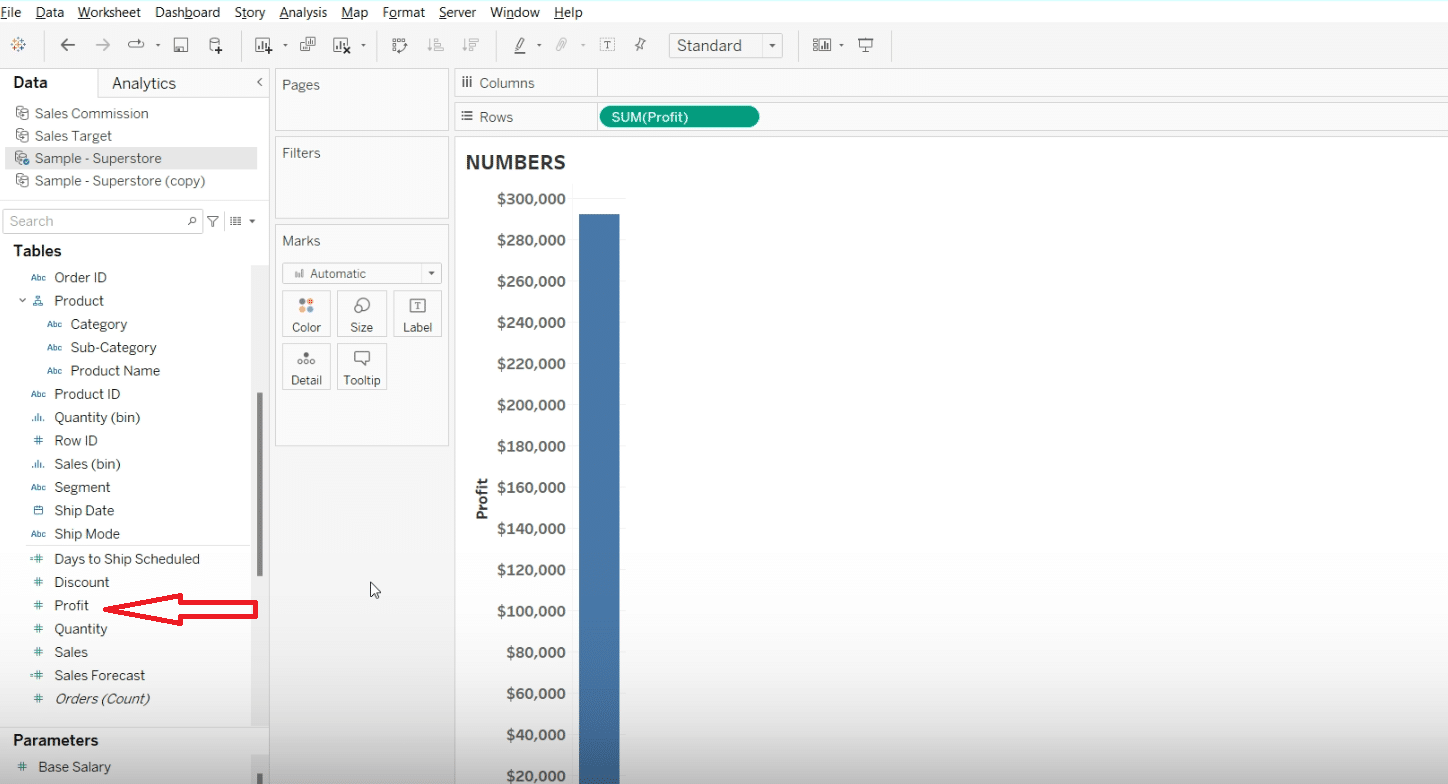
Tableau’s intuitive interface simplifies interactions with various data types. For instance, observing automatic aggregation in the ‘Profit’ field underscores Tableau’s recognition of numeric data.
Let’s walk through how it works!
Navigate to the ‘Profit’ field to see automatic aggregation, highlighting its numeric nature.
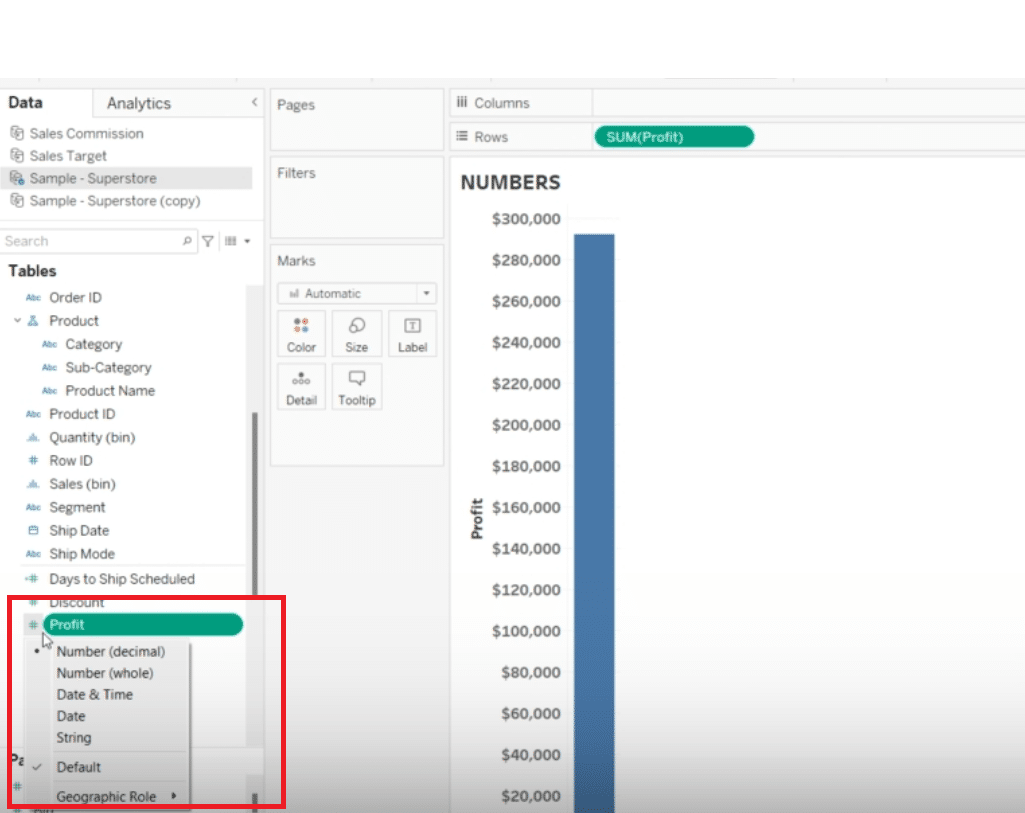
Click the dropdown next to ‘Profit’ to access data type change options.
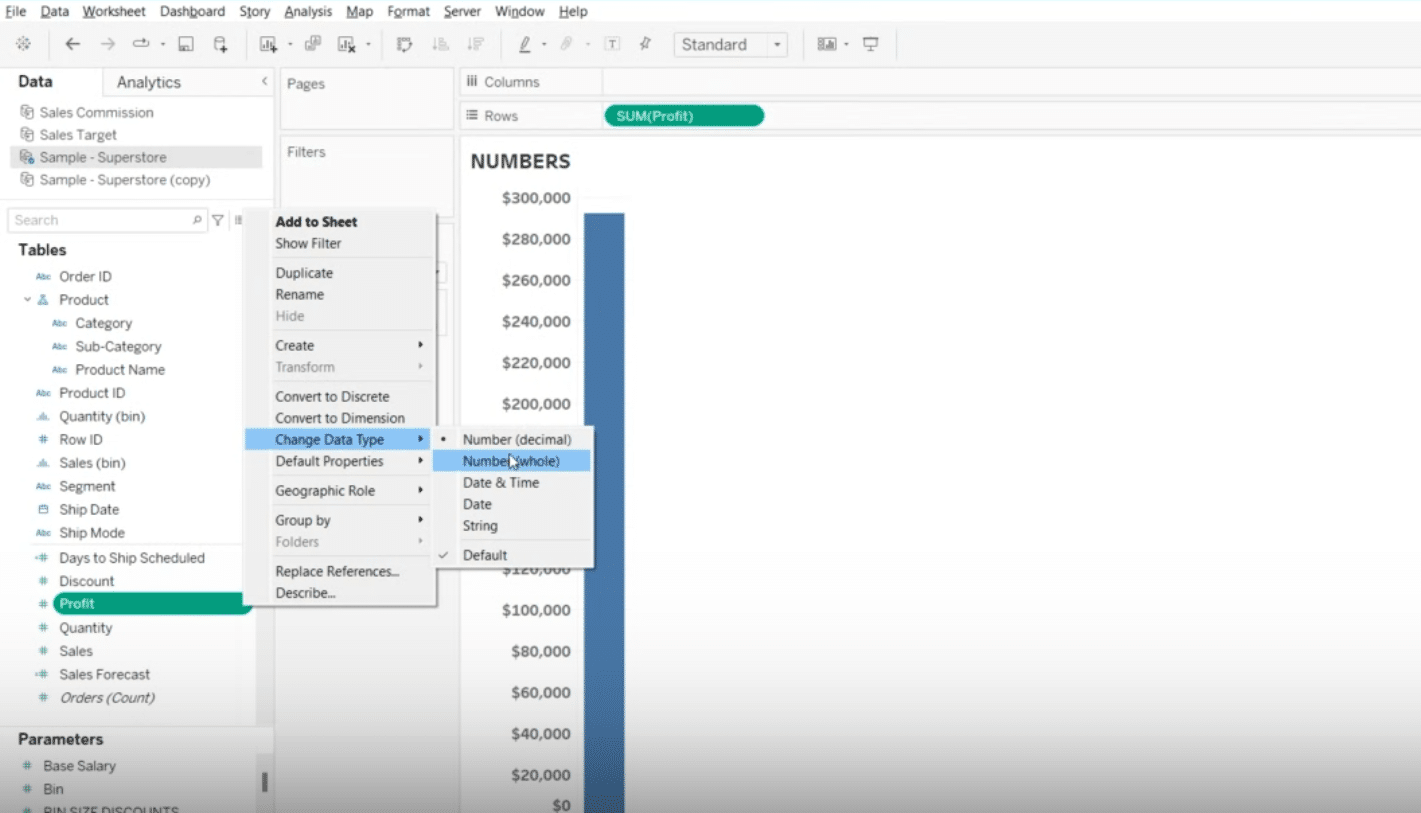
Explore numeric data type options like decimal and whole numbers.

Identify and click the data type symbol on the left of ‘Profit’ for quick adjustments.
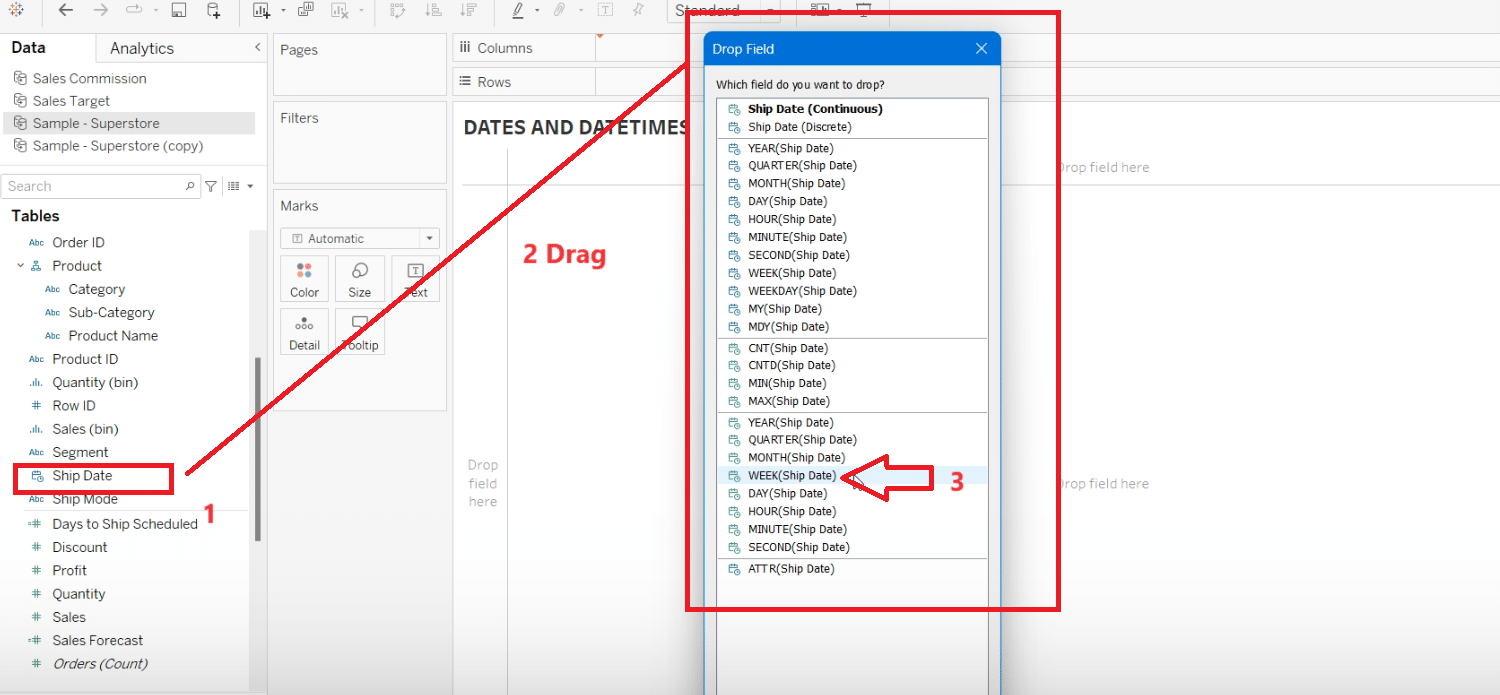
Exploring Dates and Date Times
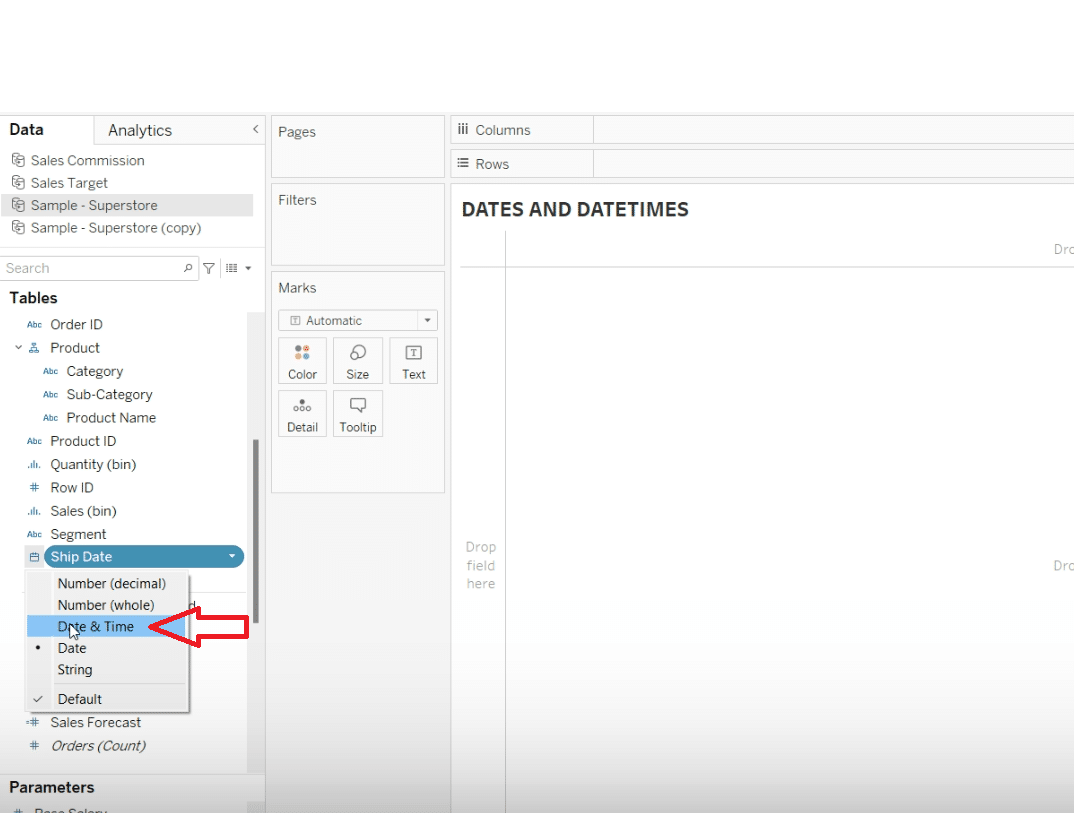
Moreover, transitioning between data types, such as converting ‘Shipping Date’ from a simple date to a detailed date and time format, is also straightforward.

Stop exporting data manually. Sync data from your business systems into Google Sheets or Excel with Coefficient and set it on a refresh schedule.
Get Started
Identify the ‘Shipping Date’ field by its calendar icon, indicating a date data type.
Convert ‘Shipping Date’ to a date and time format by selecting the ‘Date and Time’ option.
“Drag ‘Shipping Date’ into columns and choose ‘Week’ for a continuous axis, then add a product dimension to rows for a temporal analysis.
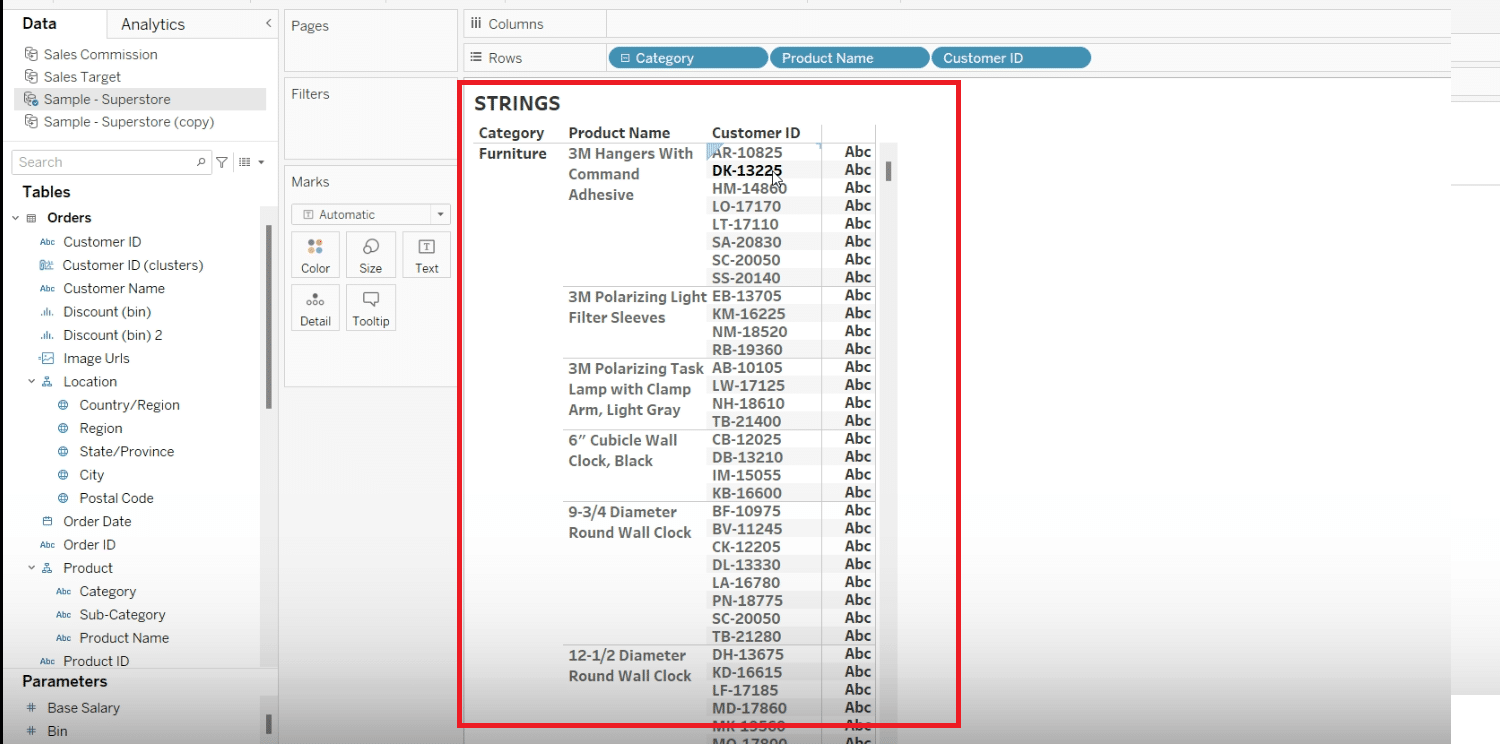
Utilizing String Data Types
Switch focus to string data types, like categories or customer IDs, for identification purposes.
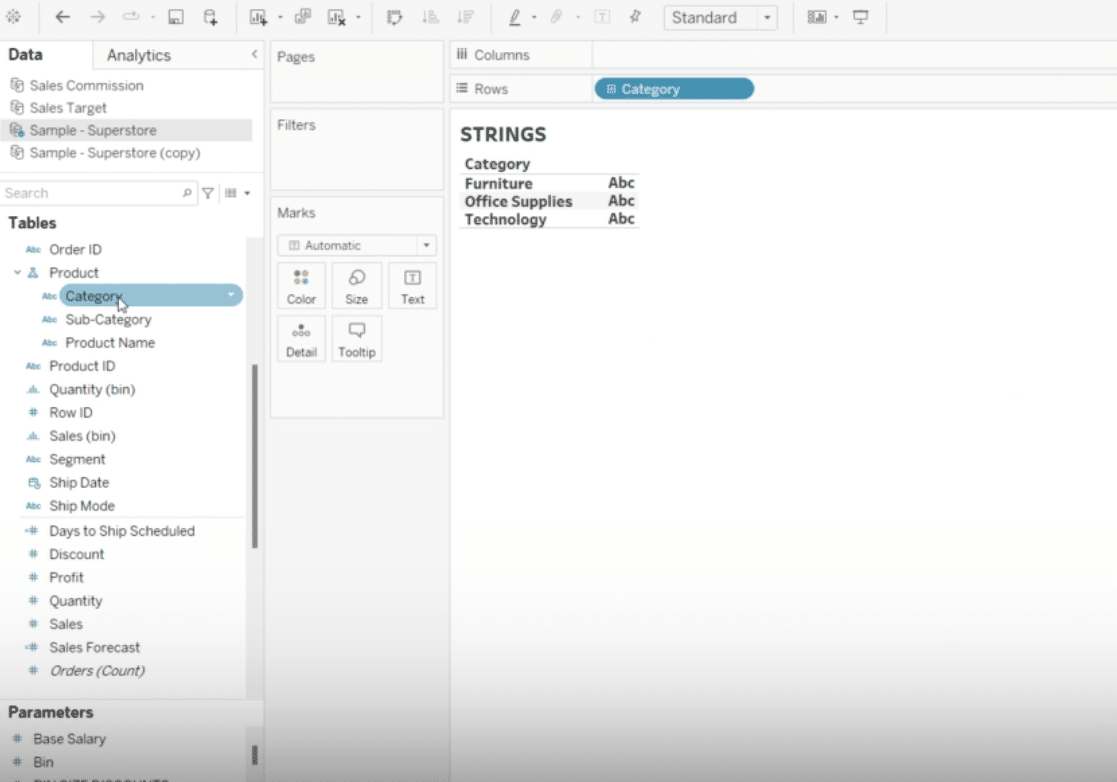
Understand the context of numerical customer IDs as strings for individual identification, not for calculations.
Best Practices and Tips
To ensure your visuals are as accurate and insightful as possible, adhere to a few golden rules:
- Always review Tableau’s auto-assigned data types; while efficient, they’re not infallible.
- Maintain consistency in data types for fields used in calculations to avoid unfortunate errors.
- Fields that serve as identifiers warrant being treated as Strings to prevent unintended data treatment.
- Choice of Date vs. Date & Time should hinge on your analysis’ required detail level.
Conclusion: Leveraging Tableau Data Types for Rich Insights
Understanding Tableau’s data types is more than a technical skill—it’s about ensuring your data tells the story you want. And with Coefficient, simplifying the preliminary data process can level up your Tableau game. See how Coefficient can get you there.


