Sorting data in Tableau can quickly turn a messy dataset into a streamlined source of insights.
This guide walks you through the essential steps to sort and clean your data, ensuring your Tableau visualizations are both accurate and impactful.
Getting Started with Sorting Data in Tableau
Before diving into sorting data in Tableau, it’s crucial to ensure that your data is well-structured and ready for analysis.
Many teams rely on spreadsheets or databases that require frequent updates. Tools like Coefficient can be a game-changer in this process.
By seamlessly integrating your spreadsheet data with Tableau, Coefficient ensures that your data remains live and up-to-date. This creates a cohesive data ecosystem that enables smooth transitions and accurate analyses.
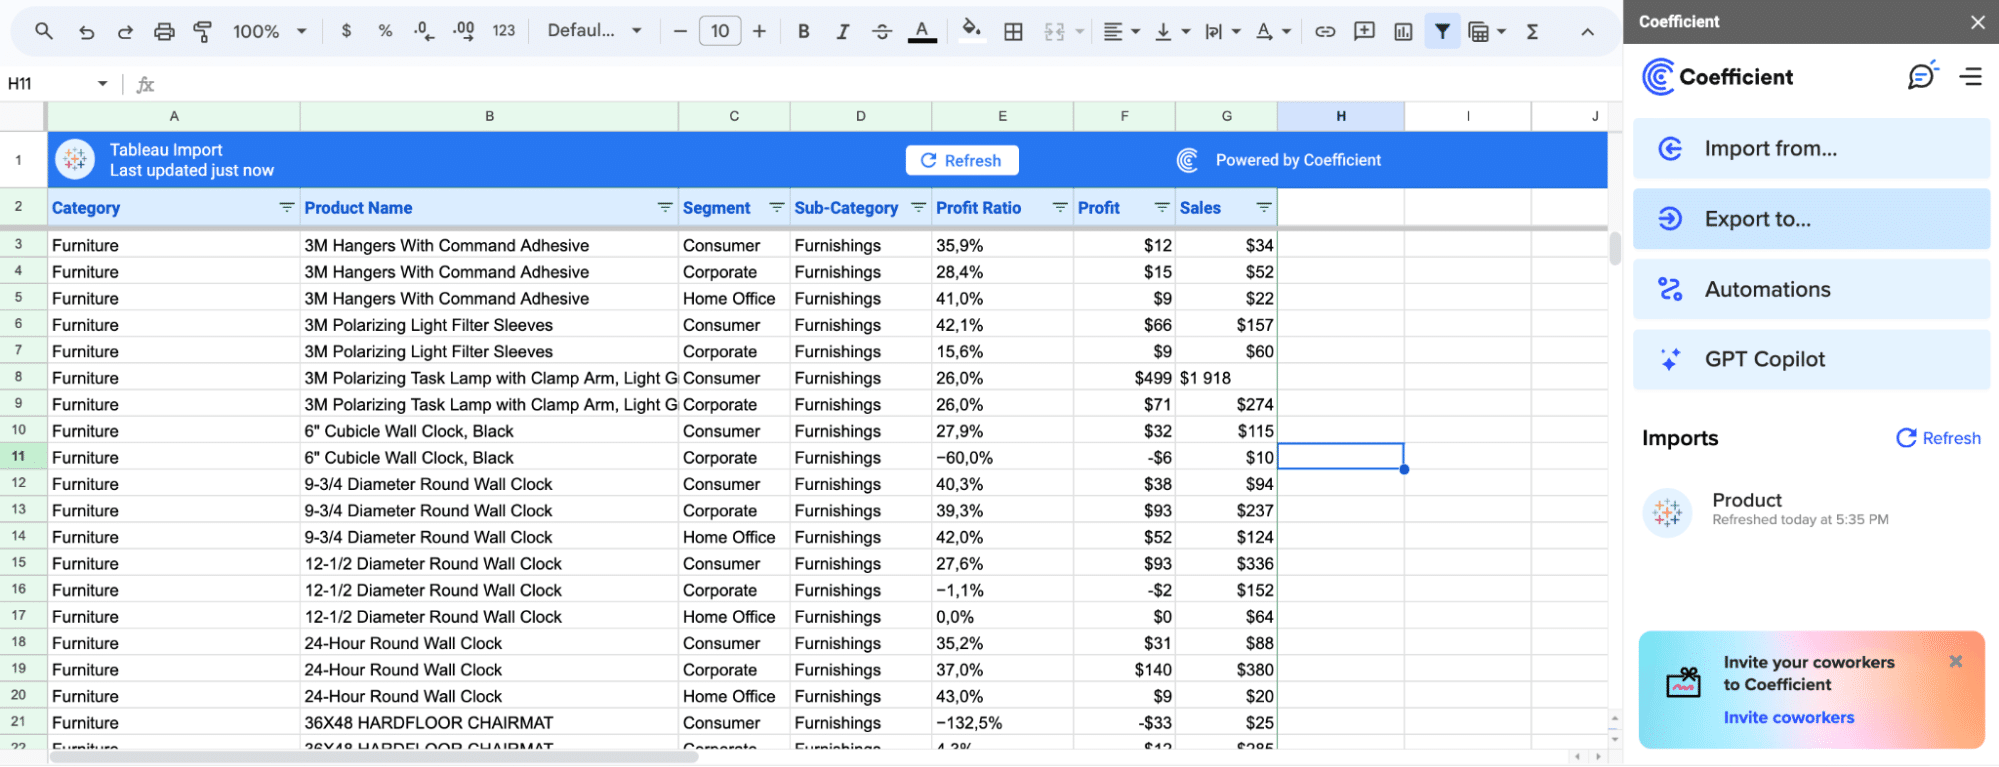
To prepare for sorting data in Tableau, consider the following:
- Data Compatibility: Verify that your data’s structure, types, and formats are compatible with your existing Tableau dashboards. This compatibility is essential for a seamless sorting and analysis process.
- Calculations and Relationships: As you get ready to sort your data in Tableau, adjust calculations, parameters, filters, and relationships to align with your data sources. This may involve refining formula references or modifying dynamic relationships for optimal results.
- Automated Updates: Leverage tools that automatically refresh your data, eliminating the need for manual updates. Coefficient excels in this area, keeping your data current in both Tableau and your spreadsheets, ensuring a streamlined workflow.
Klaviyo, for example, revolutionized their reporting process by embracing Coefficient. By harnessing Coefficient’s capabilities directly within their spreadsheets, they eliminated the challenges of ad-hoc data requests and manual reporting that would otherwise require a build in their BI system, Tableau.
This shift to automated analytics, seamlessly integrated into their Excel or Google Sheets workflows, resulted in significant time and effort savings for the team.
Sort Data in Tableau: Step-by-Step Guide
Start by opening Tableau and loading your dataset.
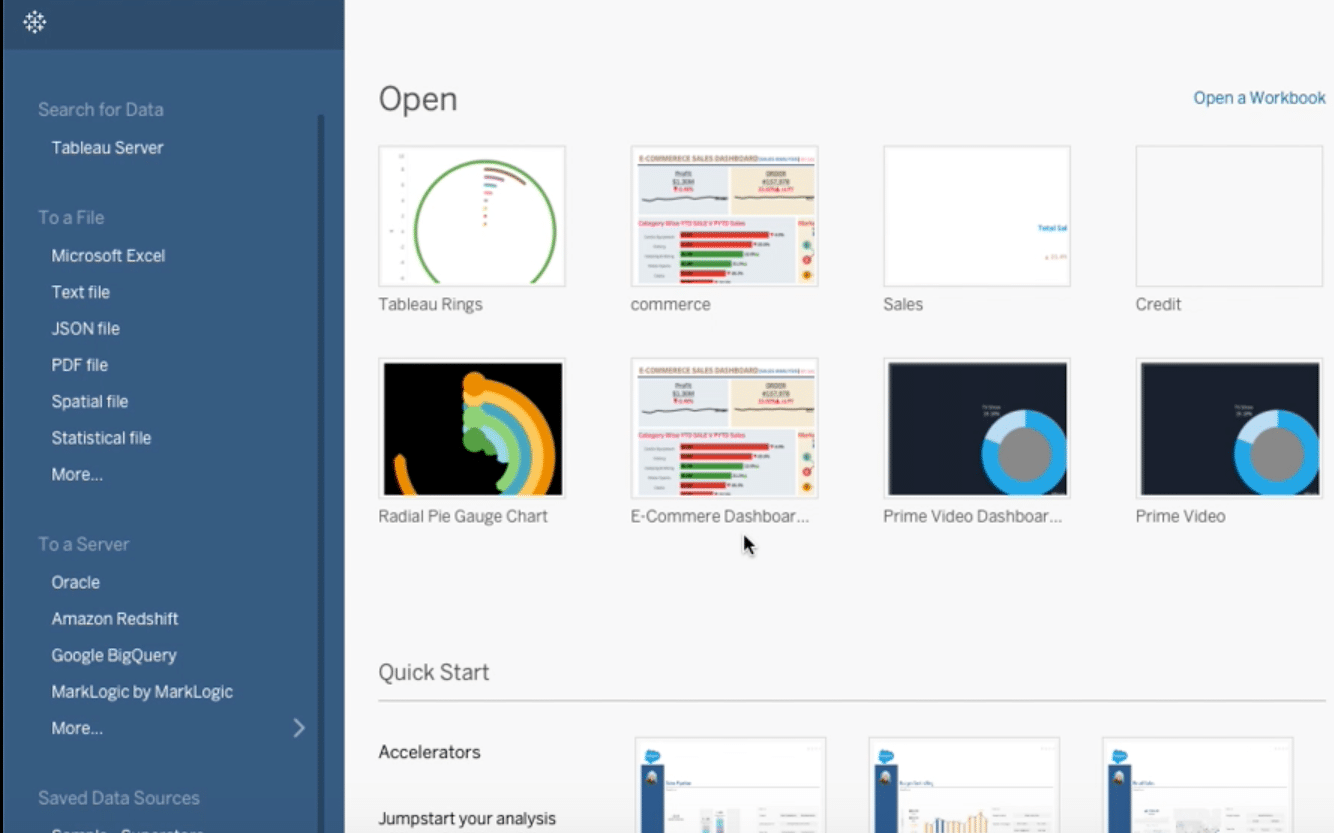
Locate and click on the “Data Interpreter” checkbox.
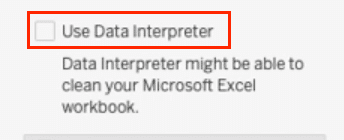
Review the corrections made by the Data Interpreter.

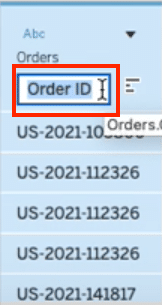
Next, Identify the field you wish to rename.

Right-click on the field name and select “Rename.”
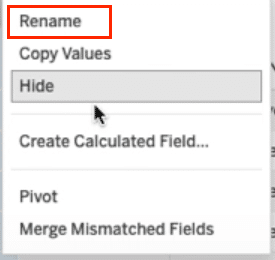
Enter the new name and confirm.
Step 4. Split Fields into Distinct Components for Enhanced Analysis
Locate the field you wish to split.

Stop exporting data manually. Sync data from your business systems into Google Sheets or Excel with Coefficient and set it on a refresh schedule.
Get Started

Right-click on the field name and select “Split.”
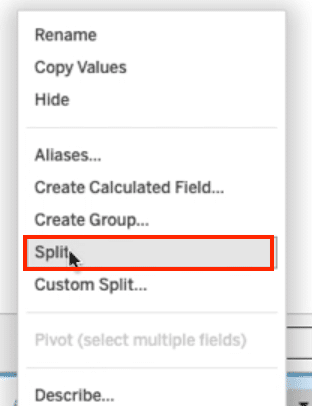
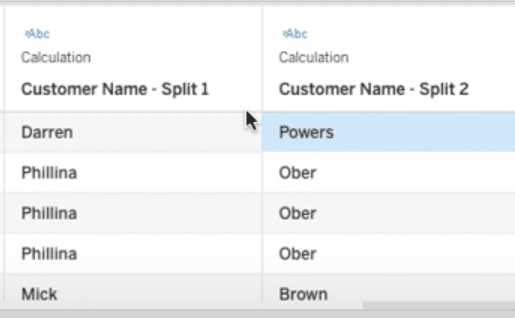
Review the automatically split fields and adjust if necessary.
Step 5. Pivot Tables
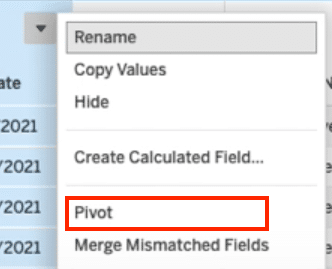
Select the fields you wish to pivot.
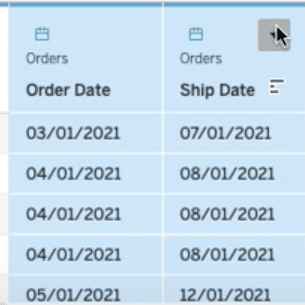
Right-click and choose “Pivot.”
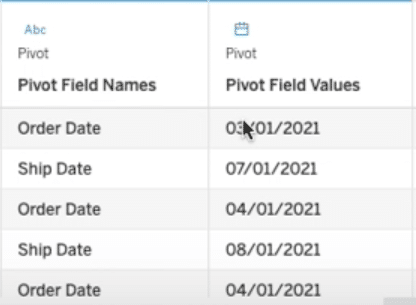
Review the pivot results to ensure accuracy.
Sort Data in Tableau: Additional Tips and Tricks
Sorting and cleaning data in Tableau open up a myriad of possibilities, but along the journey, certain challenges may arise. Fear not, for with a blend of patience and expertise, these hurdles can swiftly transform into opportunities for growth and learning. Here are some expert tips to navigate the intricacies of Tableau’s features:
- Embrace Custom SQL Queries: When connecting to your data source, instead of settling for the predefined joins and presets, consider crafting custom SQL queries. This proactive step allows you to filter, join, and manipulate your datasets even before they reach Tableau, significantly reducing the initial data clutter.
- Utilize Tableau’s Built-in Data Cleaning Features: From the Data Interpreter to the nifty Group and Replace functionality, Tableau is equipped with an arsenal of tools designed to tidy up your data. Familiarize yourself with these features; their adept use can dramatically streamline your data preparation workflow.
- Regularly Update Your Data Sources: In a rapidly changing business environment, data staleness is an all-too-common pitfall. Schedule regular updates for your data connections or leverage real-time data streams whenever possible. This practice ensures your analytics and visualizations always reflect the latest information landscape.
Sorting Data in Tableau? Its Easier in Your Spreadsheet.
The journey through sorting and cleaning data in Tableau, while demanding, is undeniably rewarding. By adhering to the steps outlined in this tutorial, you can elevate the precision, clarity, and overall impact of your data visualizations. Remember, the integrity of your data underpins the insights it unveils.
As you forge ahead, consider integrating Coefficient into your data management toolkit. Its ability to bridge the gap between your raw data sources and Tableau’s powerful visualization capabilities can revolutionize your analytics workflow. Ready to transform your data narrative? Dive into Coefficient and start redefining your data analysis journey here.


