Tables in Tableau provide a detailed view of your data, allowing for deeper analysis and insights. While creating tables may seem straightforward, beginners often face challenges in understanding the process.
In this blog post, you’ll learn how to prepare your data for table creation and follow a step-by-step tutorial to create a table in Tableau, complete with screenshots to guide you through each step.
Create Table in Tableau: Getting Started
Before creating a table in Tableau, it’s essential to ensure your data is properly prepared and compatible with your workbook.
This includes ensuring the structure, data types, and formats align with your existing setup and dashboards. Additionally, you may need to update calculations, parameters, filters, and relationships to suit the new data source.
Coefficient simplifies the process of blending live data from different business tools before it enters Tableau. By automating data refreshes and consolidating information from multiple sources, Coefficient ensures your Tableau workbooks are always up-to-date and ready for analysis.

When replacing a data source, consider data compatibility, updating calculations and relationships, and automating updates.
Klaviyo, for example, used Coefficient to revolutionize their reporting process, eliminating manual data requests and saving time and effort. By leveraging Coefficient’s power directly within their spreadsheets, they integrated seamlessly with Tableau, leading to substantial time and effort savings for the team.
Creating Tables in Tableau: Step-by-Step Tutorial
Step 1. To begin creating a table in Tableau, locate the Sub-Category dimension in your data source.
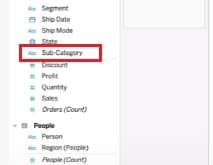
Then, drag it to the Rows shelf. This action will display all the sub-categories in your table.
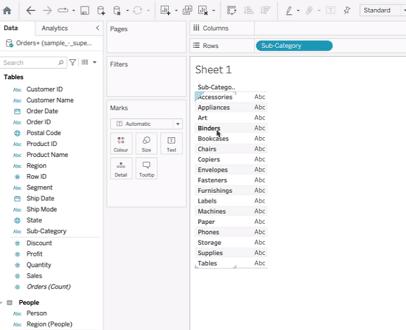
Step 2. Next, drag the Sales measure to the Rows shelf. This action will add the Sales measure to your table.

Once you’ve added the measure, click on the Table visual icon to switch to the table view.

Step 3. To include the Quantity measure in your table, drag it to the Rows shelf.
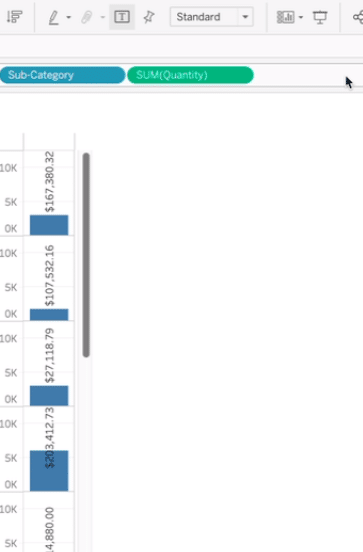
If the table view is not already selected, click on the Table visual icon again.

Stop exporting data manually. Sync data from your business systems into Google Sheets or Excel with Coefficient and set it on a refresh schedule.
Get Started

Step 4. Finally, drag the Profit measure to the Rows shelf to include it in your table.
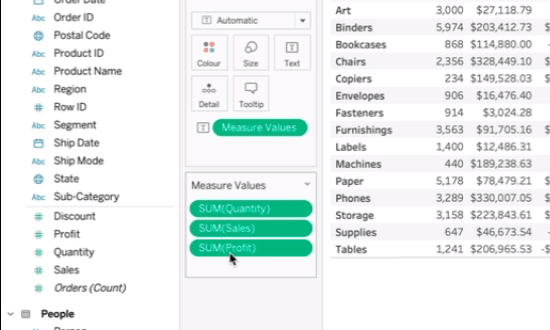
Your table should now display the Sub-Category, Sales, Quantity, and Profit measures.
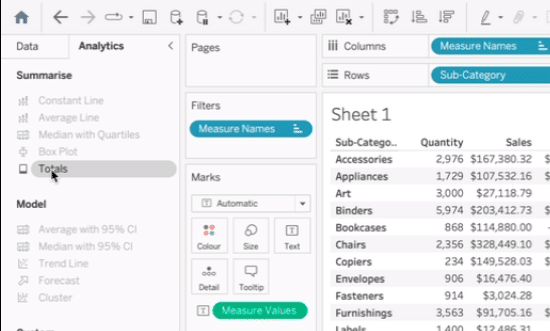
Step 5. To add column totals to your table, navigate to the Analytics menu, select Totals, and choose Column Grand Totals.
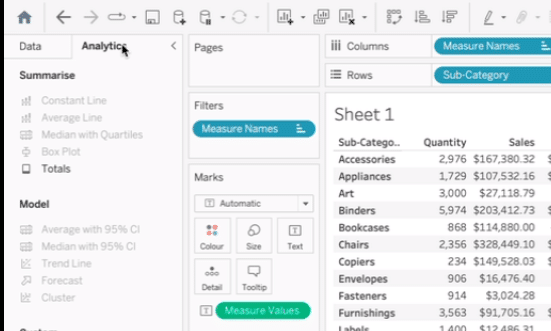
This will display the sum of all values for each measure at the bottom of the table.
Create Table in Tableau: Tips and Tricks
- Format the table to improve readability, such as adjusting column widths and applying conditional formatting. This will help you quickly identify patterns and outliers in your data.
- Use sorting and filtering options to analyze specific subsets of data within the table. For example, you can sort by Sales to identify your top-performing sub-categories.
- Experiment with different table calculations and calculated fields to derive additional insights from your data. Tableau offers a wide range of calculation options to meet your analysis needs.
Conclusion
Creating tables in Tableau is a powerful way to analyze and visualize your data in detail. By following the steps outlined in this guide, you can create informative tables that provide valuable insights into your business.
Remember, data preparation is crucial for a seamless table creation process. Coefficient can help you streamline data integration, ensuring your Tableau workbooks are always up-to-date with live data from your spreadsheets.
Start using Coefficient today and unlock the full potential of your data analysis with Tableau.


