In this guide, we’ll show you how to use the calculated field Tableau feature to make your data work harder for you.
You’ll learn how to set up and use calculated fields to uncover deeper insights and make your data insights clearer and more impactful.
Let’s dive in!
What is a Calculated Field in Tableau?
Calculated fields let you tweak your data in Tableau. You can use math, logic, or text changes on your existing data to create new info.
This is different from just showing data as it is because you can do calculations to find out more from your data, helping you see deeper into what your data means.
Calculated Fields vs Table Calculations in Tableau
Calculated fields and table calculations both help you analyze data better in Tableau, but they’re used differently.
Calculated fields make new columns in your data by using formulas you set up. Table calculations work on the data you’re looking at in your chart or table and depend on how it’s laid out. Calculated fields are flexible and can be used in many places, while table calculations are tied to where you’re looking at your data right now.
How to Create a Calculated Field in Tableau
Before jumping into Tableau to create and utilize calculated fields, ensuring your data is comprehensive, up-to-date, and easily accessible is critical.
Coefficient makes this easier than ever by importing live data from your business systems directly into Excel or Google Sheets, which can then be utilized in Tableau.
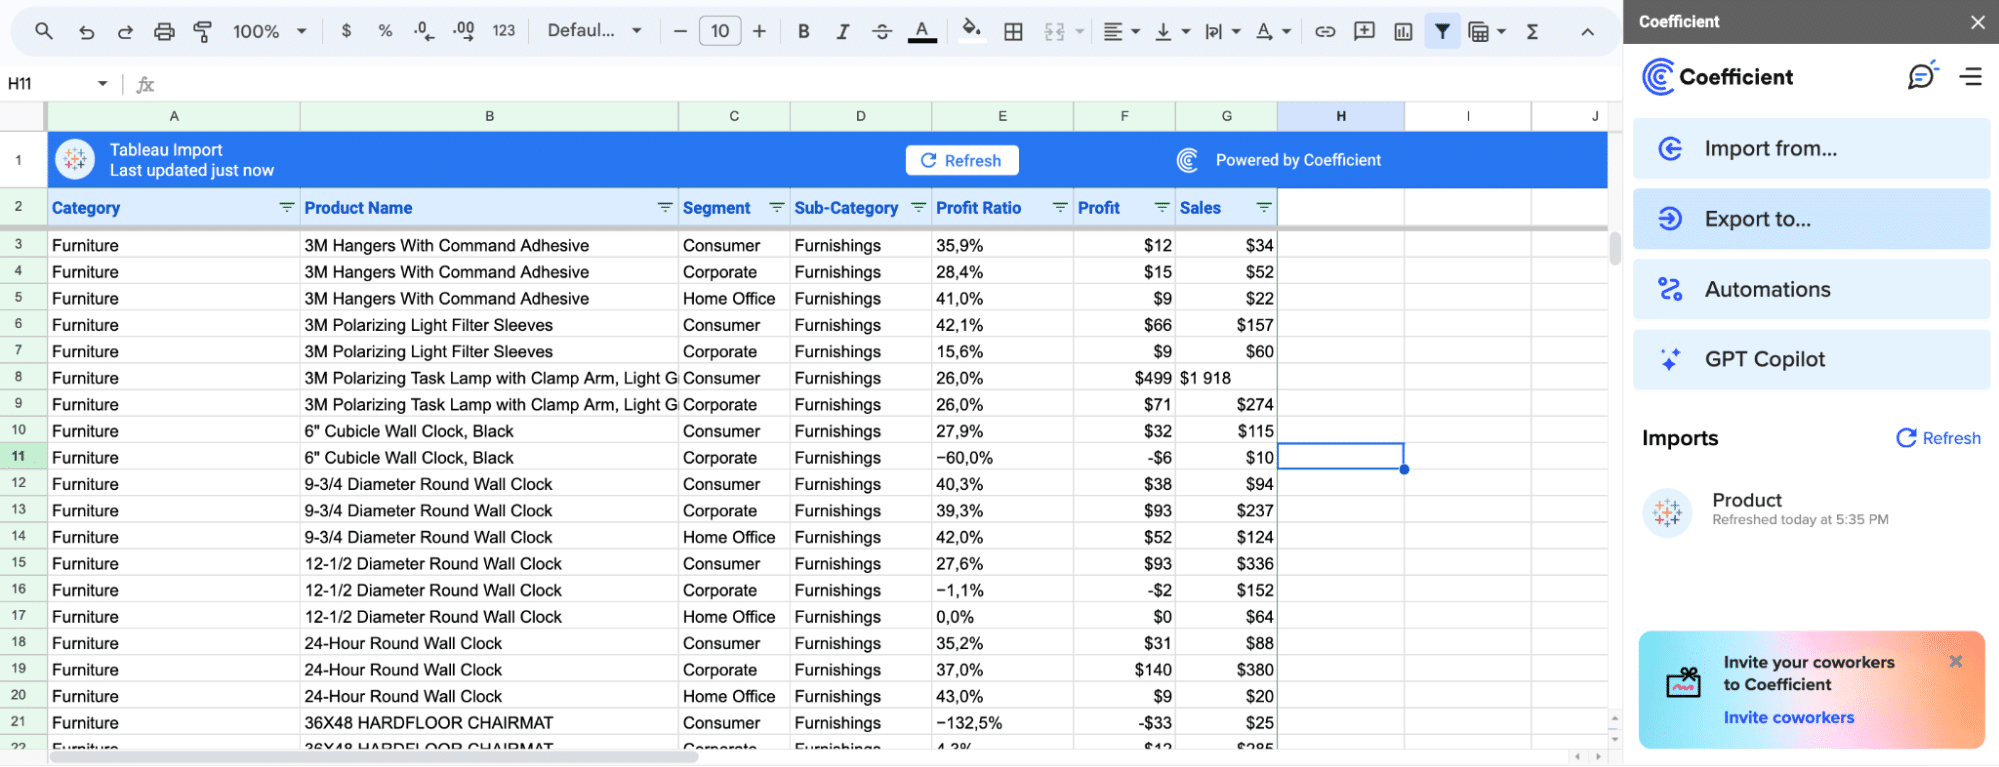
By effortlessly syncing live data from your business systems directly into Excel or Google Sheets you ensure that your Tableau projects rest on the most accurate and up-to-date foundation.
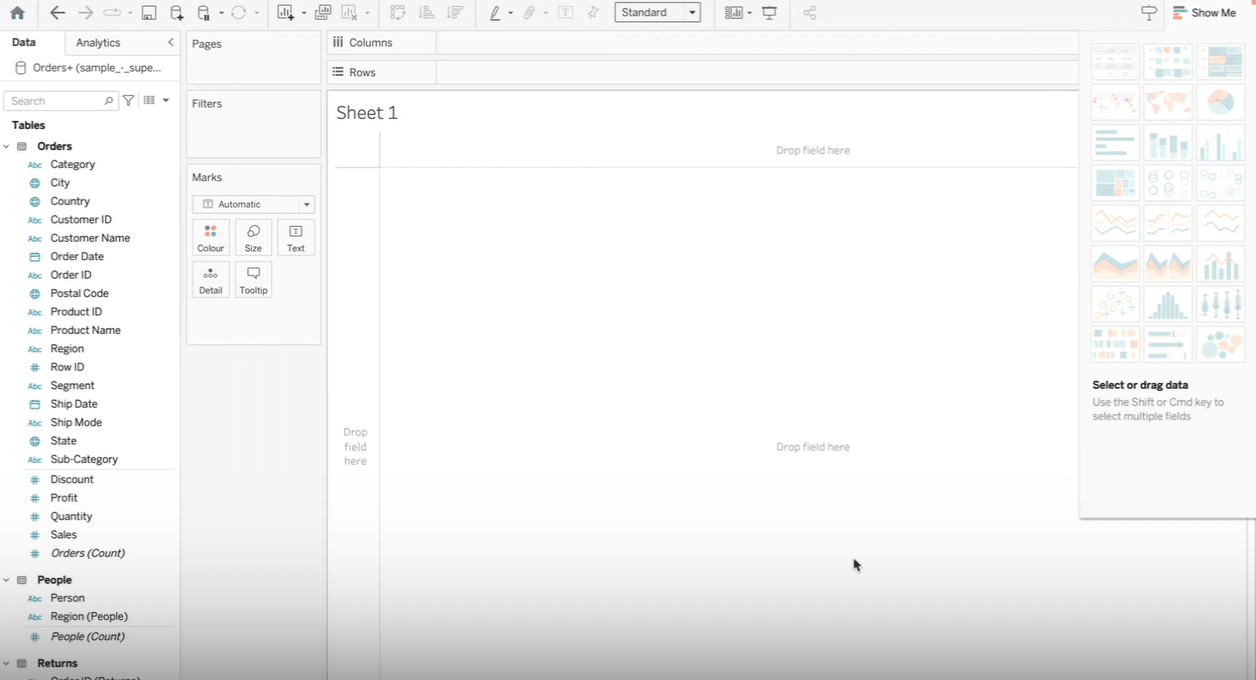
Step 1: Accessing the Calculation Editor
To begin, locate the fields within your Tableau workspace. In our example, we’re interested in the fields labeled ‘Profit’ and ‘Quantity’.
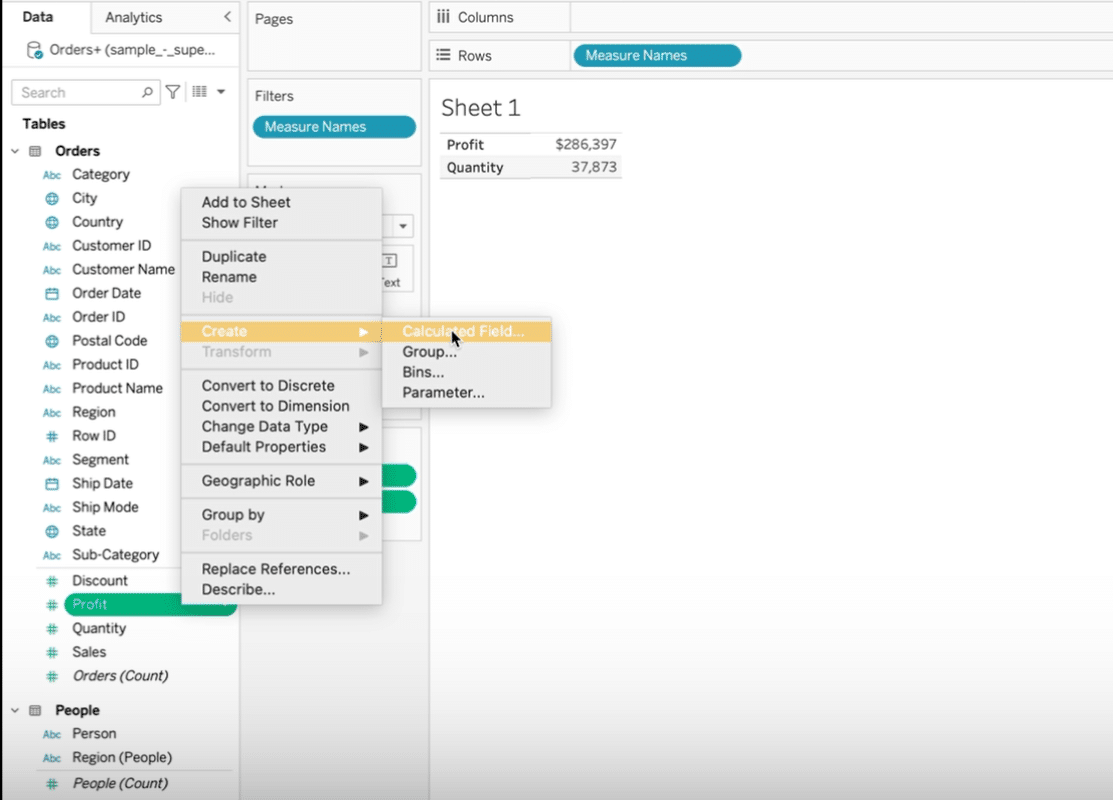
Step 2: Navigating to ‘Create Calculated Field’
Navigate to the ‘Profit’ field, right-click (or double-click) on it, and choose ‘Create’ > ‘Calculated Field’.
Step 3: Naming Your Calculated Field and Writing the Calculation
After selecting ‘Calculated Field’, a dialogue box appears. Name your calculated field ‘Profit per Item’.
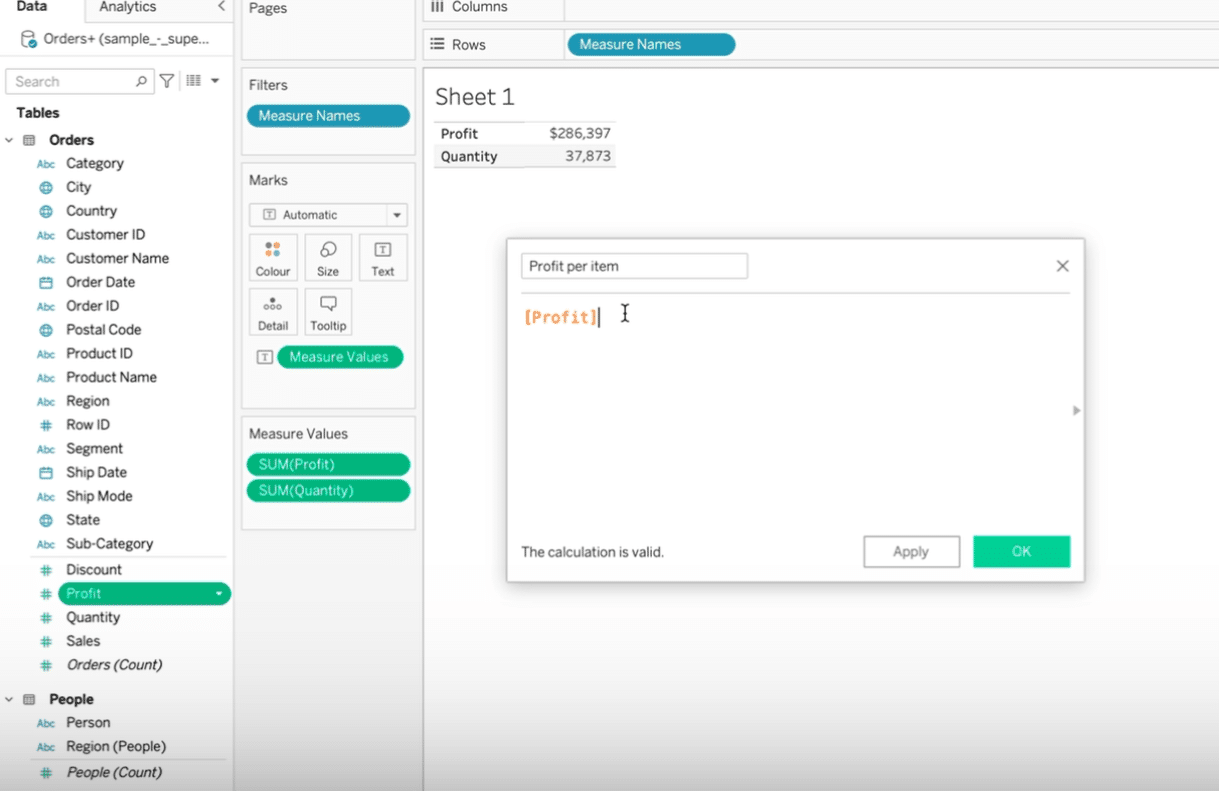
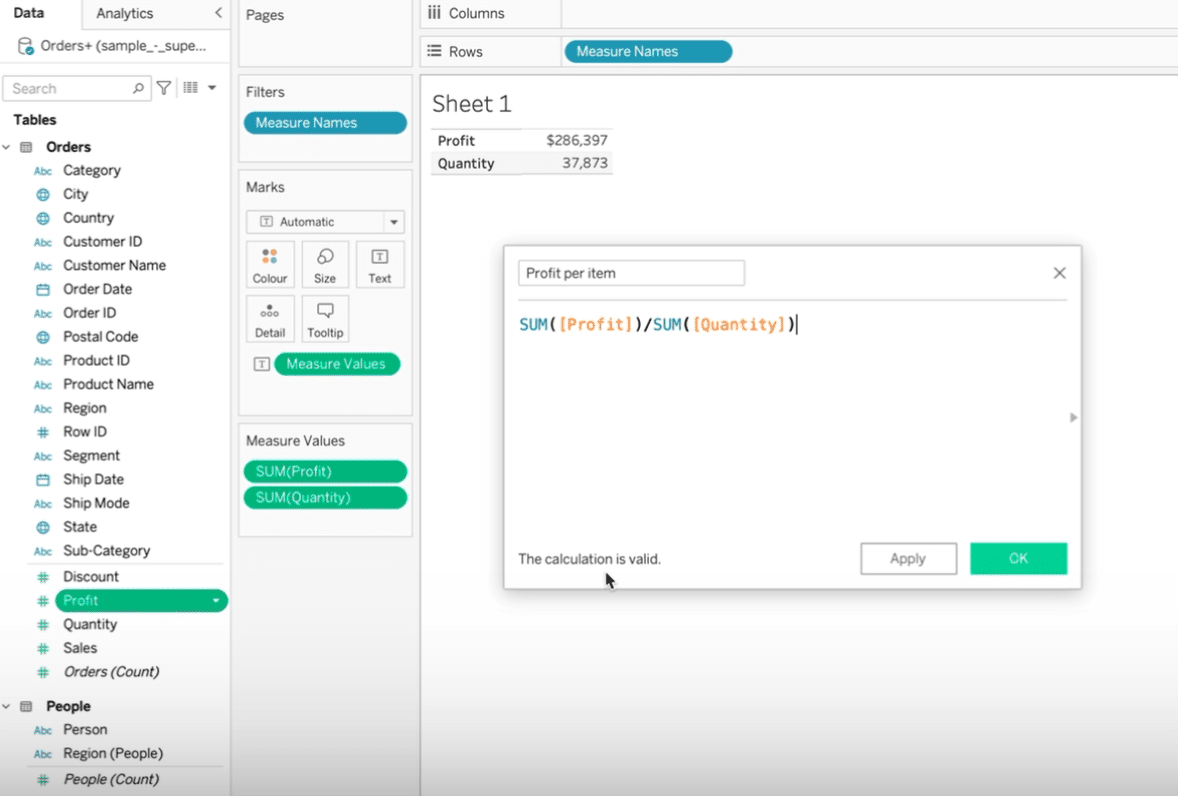
Enter the formula to calculate the average profit per item: SUM([Profit])/SUM([Quantity]).

Stop exporting data manually. Sync data from your business systems into Google Sheets or Excel with Coefficient and set it on a refresh schedule.
Get Started
Validate the formula to ensure it’s correct. Tableau will indicate if the calculation is valid at the bottom of the window.
Step 4: Applying Your Calculated Field
Once created, your new calculated field, ‘Profit per Item’, will appear in the fields list.
To format it, go to ‘Format’, select your field, and choose to display it as currency, with two decimal places.
The formatted field will now accurately reflect the average profit per item sold.
Example Use Case: Creating a Calculated Sum Field in Tableau
An example use case for a calculated field might involve summing sales data over a specific period or across different categories.
By creating a calculated field to sum sales, you can then apply this to various visualizations, such as bar charts or line graphs, providing a dynamic overview of sales performance over time or by category. This calculated sum field can offer valuable insights for business analysis, helping to identify trends, peak periods, and areas for improvement.
Best Practices and Performance Considerations
When working with calculated fields in Tableau, there are several best practices to ensure your calculations are efficient and your analysis is effective.
Do’s:
- Simplify Calculations: When possible, simplify your calculations to avoid redundant operations. For example, instead of performing a calculation multiple times within a formula, try to structure your calculation to reference each field only once.
- Use CASE Statements: For complex logic, CASE statements may perform faster than a series of IF or ELSEIF statements. Remember that ELSEIF is quicker than a nested ELSE IF since the latter computes an additional IF statement.
- Aggregate Measures: Ensure your calculations work with aggregated data to speed up performance. Working with disaggregated data can slow down your analysis, especially with large datasets. You can aggregate data by selecting ‘Analysis > Aggregate Measures’ in Tableau.
- Optimize String Manipulations: For complex string manipulations, consider using regular expressions (REGEX) as they can be more efficient and shorten your calculation length.
- Parameter Optimization: Use parameters effectively for conditional calculations. Opt for integer values for calculation logic while using the ‘Display As’ feature for user-friendly text labels. This approach can significantly improve calculation speed.
Don’ts:
- Avoid Repetitive Calculations: Be cautious not to use the same calculation multiple times within a single formula, as this can degrade performance. Try to find ways to use each calculation once.
- Limit Use of COUNTD: The COUNTD function, which counts distinct values, can be slow. Use it sparingly and consider other aggregation methods if possible.
- Be Wary of Complex Filters: Filtering based on complex calculations can sometimes bypass indexes in the underlying data, leading to slower performance. Ensure your filters are as straightforward as possible.
- Careful with Date Conversions: If your data contains dates not in native formats, converting these using functions like DATEPARSE or DATE can impact performance. Prefer to keep data in numeric formats where feasible to avoid inefficient conversions.
- Reconsider Using Sets in Calculations: Sets in calculations can be less efficient than other methods. If you’re using sets, consider replacing them with calculated fields or groups for better performance.
Conclusion
By understanding how to create and apply these fields effectively, you can unlock deeper analytical capabilities within your datasets. Experiment with calculated fields on your data sets to discover new perspectives and opportunities for data-driven decision-making.
Looking to integrate your Tableau visualizations seamlessly with your business systems? Explore how Coefficient can simplify and enhance your data analysis process. Start optimizing your data workflows today by visiting Get Started with Coefficient.


