Adding filters to a dashboard in Tableau is essential for drilling down into the data that matters most.
This guide will walk you through the steps to seamlessly integrate filters, enabling precise analysis and personalized data visualization. Learn to enhance your dashboards and unlock deeper insights with just a few clicks.
Why Add Filters to Your Tableau Dashboard?
Filters allow users to control which data is displayed on their dashboard. They are essential for customizing data views to meet specific analysis needs, improving dashboard performance, and making data more accessible to various team members.
Utilizing filters effectively can lead to more informed decision-making.
Understanding Tableau’s Filter Types
Tableau offers a range of filters, each with a unique purpose:
- Quick Filters: Ideal for dynamic adjustments by end-users. They are interactive, facilitating easy changes based on user selections.
- Data Source Filters: These filters limit data at the source, enhancing performance and security.
- Context Filters: Primary filters that determine the options available in other filters, reducing unneeded data processing.
- Extract Filters: Applied when creating a data extract, they focus analysis on essential data segments.
- Top N Filters: Display top or bottom rankings based on criteria, ideal for leaderboards.
- Parameter Filters: Allow custom inputs, offering flexibility in visualization controls.
Step-by-Step Tutorial: Adding Filter to Dashboard in Tableau
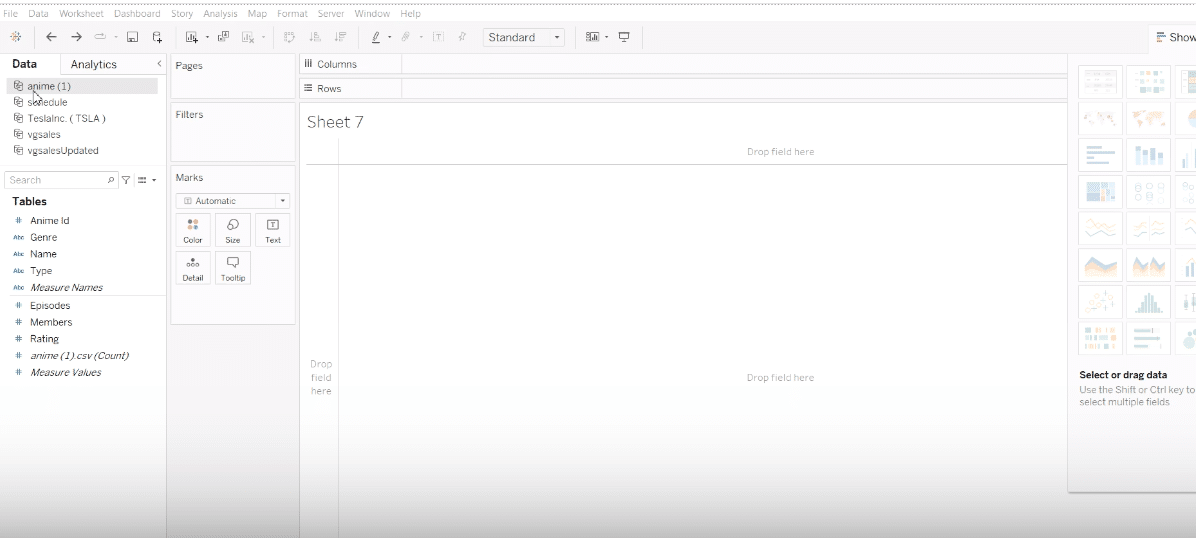
Step 1. Preparing Your Data Set
Download and load your desired data set into Tableau.
Pro-tip: Make sure you’re working with your accurate, up-to-date first. Coefficient automatically imports all your live data to your spreadsheet, where you can manipulate it before loading into Tableau.
Step 2. Starting with Filters
Begin by selecting the specific columns you wish to include, by clicking select from list ‘select from list’ option.
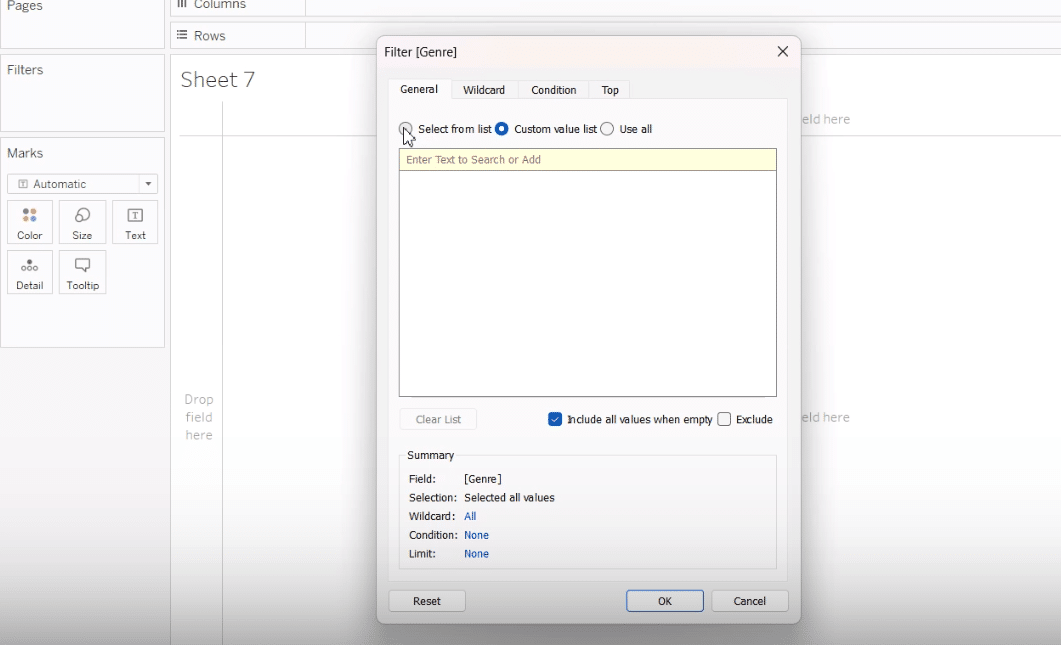
- Screenshot Alt Text: “Applying data selection filters to enhance dashboard performance in Tableau.”
- Screenshot File Name: “applying-data-selection-filter-tableau.png”
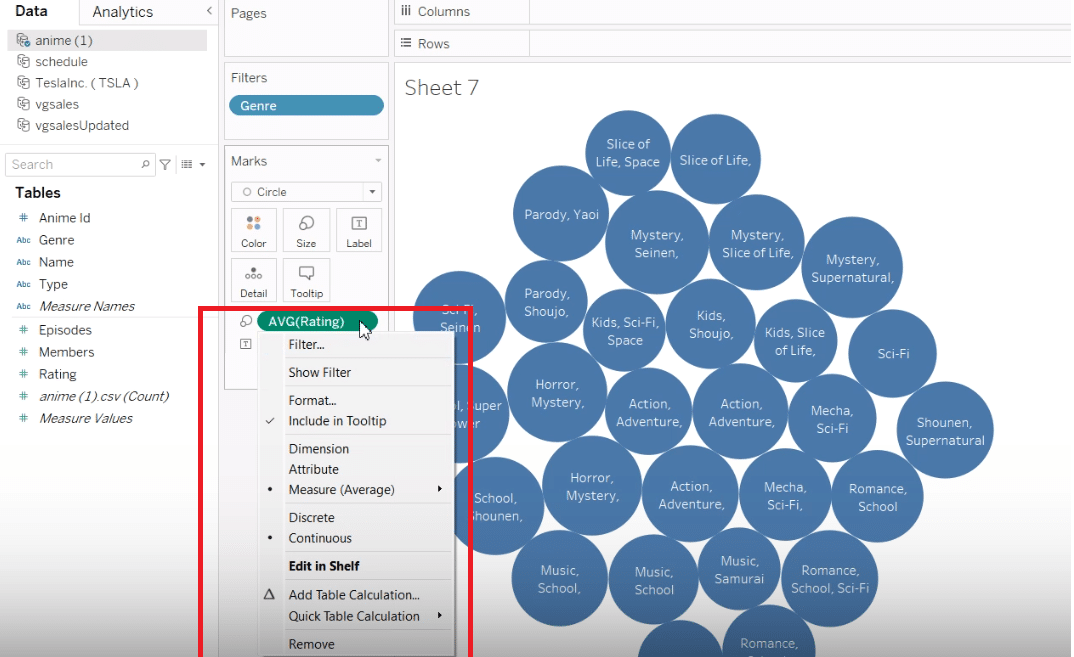
Step 3. Visualizing Data Through Filters
Add measures to your dashboard, for example, changing a sum of ratings to an average rating to get a clearer insight into your data.

Stop exporting data manually. Sync data from your business systems into Google Sheets or Excel with Coefficient and set it on a refresh schedule.
Get Started
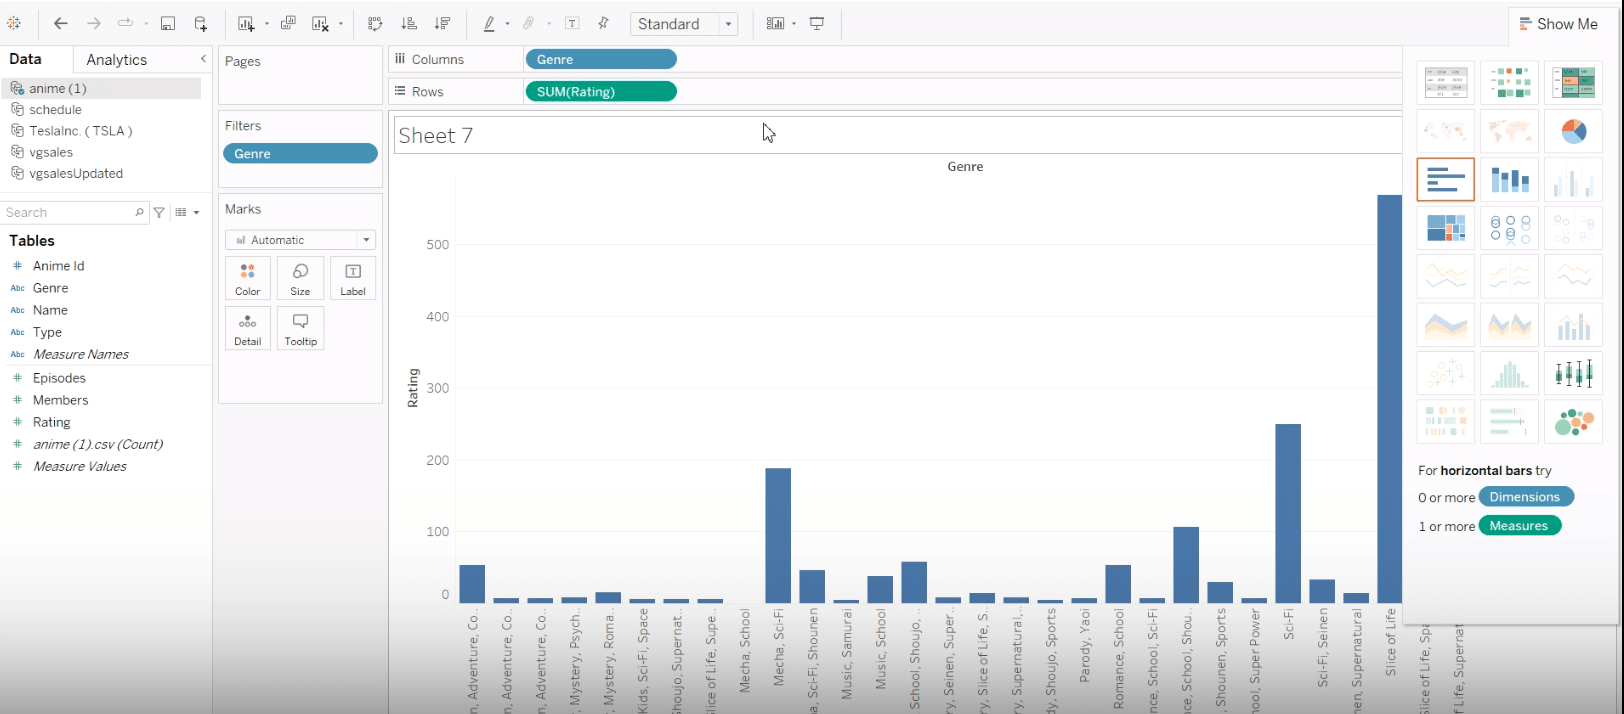
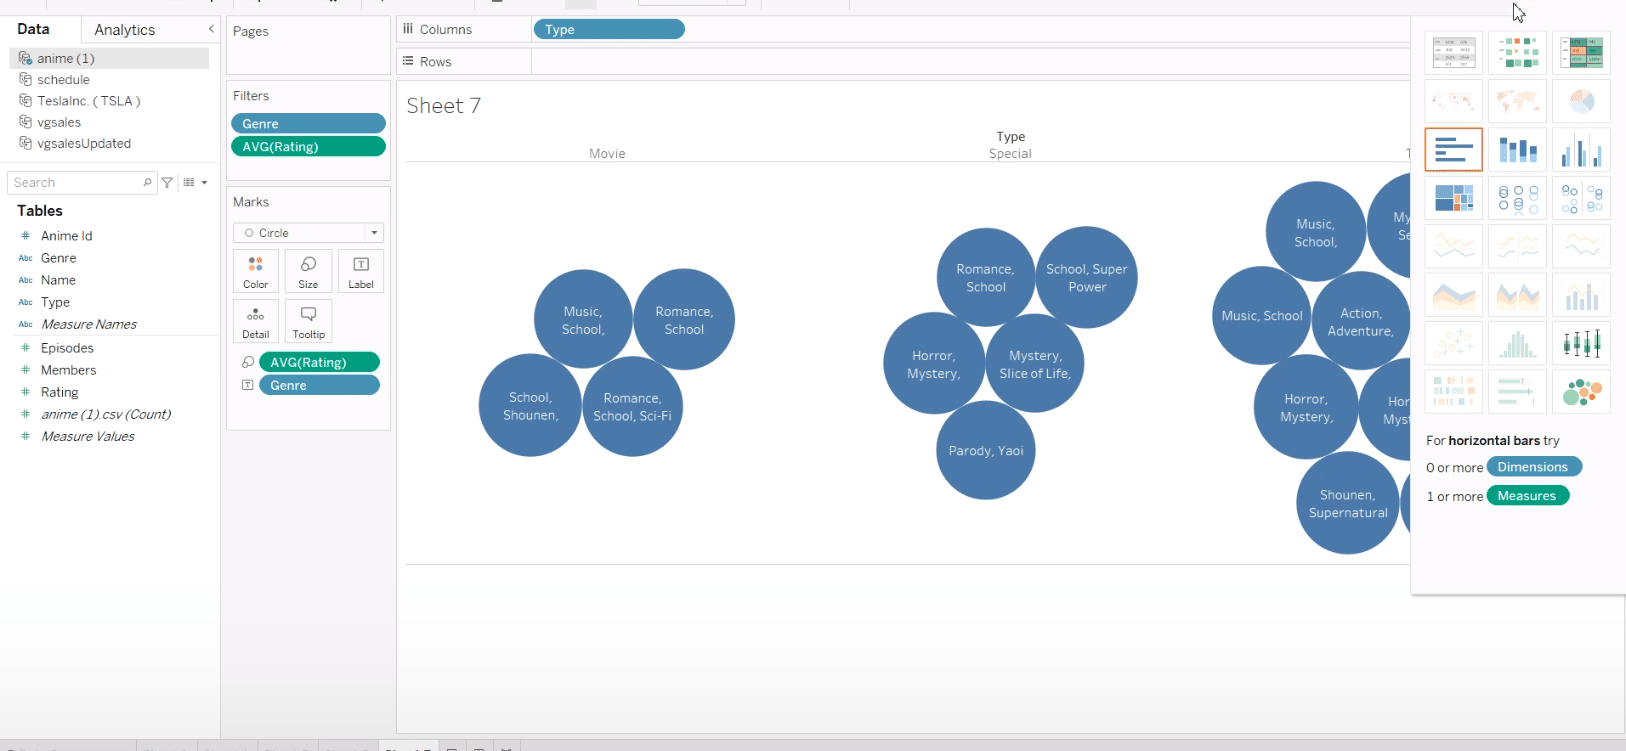
Note: Incorporate additional filters, like filtering by ratings, to narrow down to the most relevant data, such as top genres for anime based on viewer ratings.
Continue to refine your dashboards by adding varied filters, such as by type (movie, TV) or number of episodes, to cater to specific analysis needs or audience preferences.
Best Practices for Applying Filters on Tableau Dashboards
When adding filters to your Tableau dashboards, employing best practices ensures that your data not only remains relevant and accessible but also that your dashboards function optimally. Here are actionable tips to keep in mind:
- Start with the End in Mind: Before applying filters, have a clear understanding of the insights you want to draw from your data. This ensures you select filters that contribute directly to your analysis goals.
- Use Extract Filters for Large Data Sets: If working with substantial data sources, apply extract filters when importing your data into Tableau. This reduces the volume of data loaded into your dashboard, improving performance.
- Prioritize Filter Application: Employ context filters to set primary conditions, reducing the data set before applying other filters. This method enhances dashboard responsiveness and user interaction speed.
- Keep User Experience Front and Center: Ensure the filters you apply contribute to a logical and intuitive dashboard. Overloading a dashboard with unnecessary filters can overwhelm users and detract from the overall insight.
- Test Dashboard Performance: Regularly assess how the addition of filters impacts your dashboard’s performance. If certain filters cause delays, consider refining or removing them to maintain optimal speed.
Conclusion and Call to Action
Adding filters to your Tableau dashboards unlocks dynamic, interactive data exploration, making your analysis both deeper and more intuitive. Harness the power of filters to transform vast datasets into actionable insights, guiding better decision-making.
Elevate your data storytelling by exploring further with Coefficient. Get started today for free or explore its pre-built dashboard library. Start making your data work for you!


