Even with access to robust CRM systems such as Salesforce and HubSpot, many SalesOps users still prefer spreadsheets for forecasting, dashboarding, and analysis.
Spreadsheets are more flexible, and less cumbersome, than many of the built-in visualization and analytics capabilities of CRMs. However, it’s often difficult to build and maintain sales tracking spreadsheets with so many other competing priorities.
But no worries – we’ve created templates for all of your essential sales tracking spreadsheets in the following blog. Try our free Google Sheets templates for your Salesforce and HubSpot CRM data below.
Win Loss Analysis Template
Win loss analysis is critical to understanding why sales deals were won or lost. This helps sales teams adjust tactics and optimize the sales cycle.
SalesOps managers typically build win loss analysis reports in CRMs that can track these metrics across orgs, teams, and sales reps. But these CRMs often make win loss analysis reporting quite difficult. Salesforce, for instance, restrains users to basic inputs such as pick-lists or open-text fields.
Google Sheets offers more flexibility in terms of building dashboards, but it cannot access real-time CRM data natively. And then, regardless of what platform you use, you must build out the dashboards from scratch.
But slow down there — our Win Loss Analysis Template takes care of all of these dashboarding issues in a single click.
Our Win Loss Analysis Template contains all the metrics and visualizations needed to perform an incisive win/loss analysis, presented in pretty dashboards that capture the core KPIs your team needs:
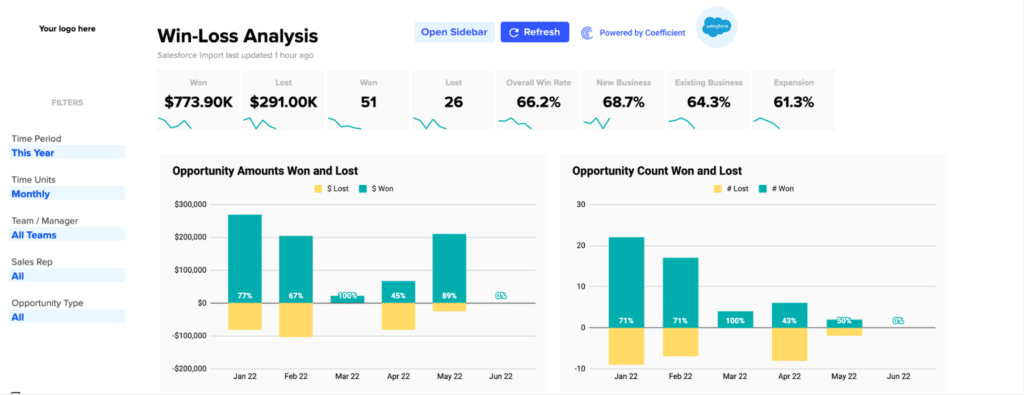
Dashboards within the template can be customized with a toggle menu at the top of the Sheet — this allows you to view the dashboard for individual sales reps or team. You can also toggle your visualizations based on Time Period, Time Units, Team/Manager, Sales Rep, and Opportunity Type.

This allows your team to slice-and-dice the CRM data however they want. The filtered data is then fed into the pre-built win loss analysis dashboards:

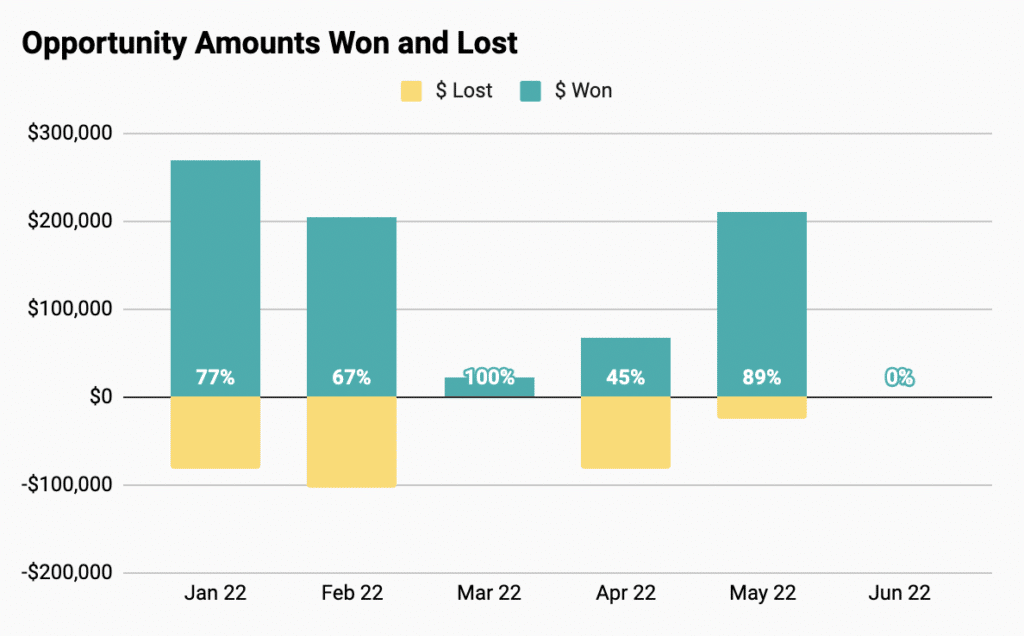
Keep track of key metrics such as won/lost by revenue and volume, win rate, and wins by customer stage with high-level charts. View juxtaposed dashboards of opp amounts/counts won and lost.
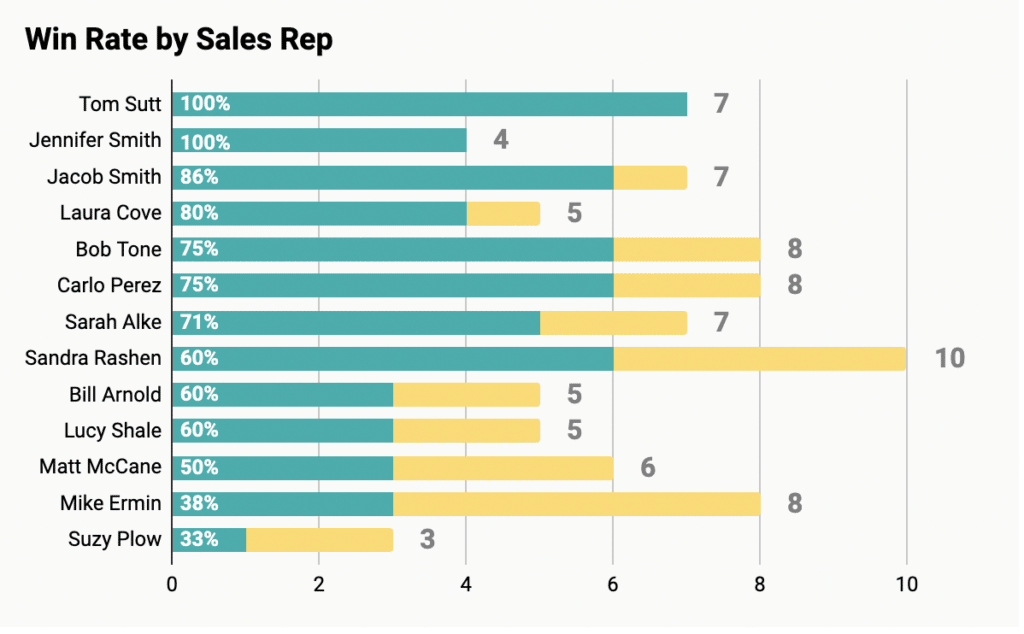
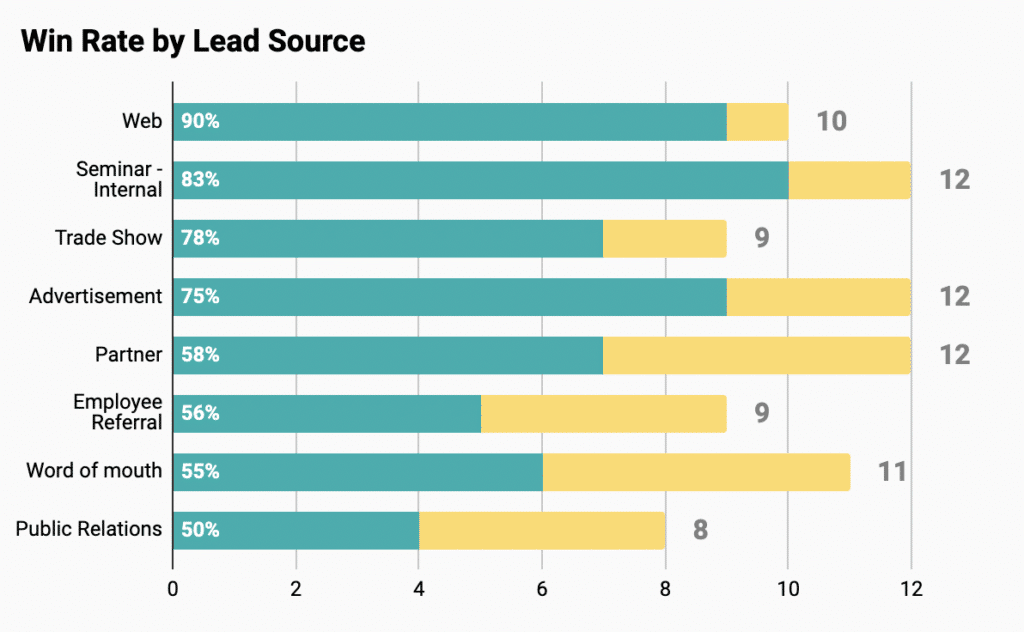
You can also view win rates by reps, teams, opp size, opp age, lead source, and more.
Get a full list of lost opportunities, including opp owners, age, amount, and reason lost.

And these dashboards are always up-to-date and shareable — the template automatically updates your CRM data. Give it a try now: launch our free win loss template in Google Sheets for your Salesforce or HubSpot CRM.
Launch Win Loss Analysis Template for Salesforce
Launch Win Loss Analysis Template for HubSpot
Sales to Target Template
Setting and tracking sales targets is a key initiative for most sales teams. These goals allow teams to measure performance, adjust tactics, and project sales within a given month, quarter, or year.
However, dashboards that track sales targets often require SalesOps managers to corral data from multiple business systems. It’s a messy, time-consuming process to blend sales data in CRMs with sales targets in spreadsheets.
That’s why we created our Sales to Target Template. Our template offers pre-built sales to target dashboards, so SalesOps Managers can avoid building, maintaining, and updating complicated reports involving multiple data systems.
Our Sales to Target Template combines Salesforce or HubSpot data with sales targets, calculates revenue projections, and visualizes progress for teams and opportunity types, by month, quarter, or year. Track yearly or quarterly company revenue side-by-side with open pipeline and target achieved.
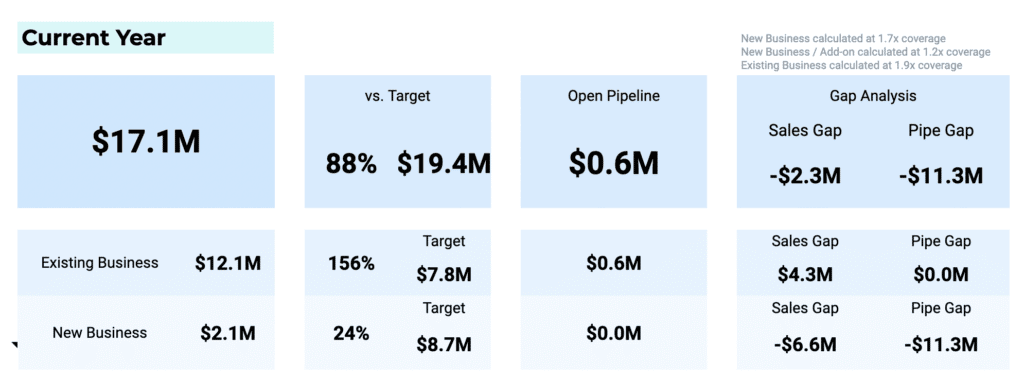
Harness the pre-built Gap Analysis visualization to find out how you can close missing revenue. View revenue and opportunities side-by-side, based on existing business and new business. Track your sub-targets and discover where your pipeline needs additional opportunities. You can also utilize these high-level dashboards to measure sales targets by team.

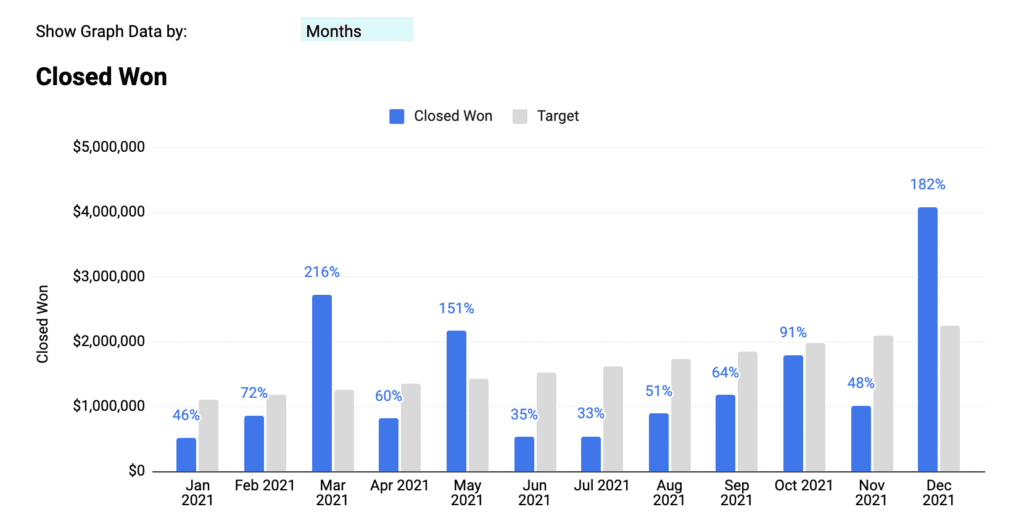
Check out the closed-won opportunities vs. targets dashboards to analyze performance over time and see where the gap needs to be made up.
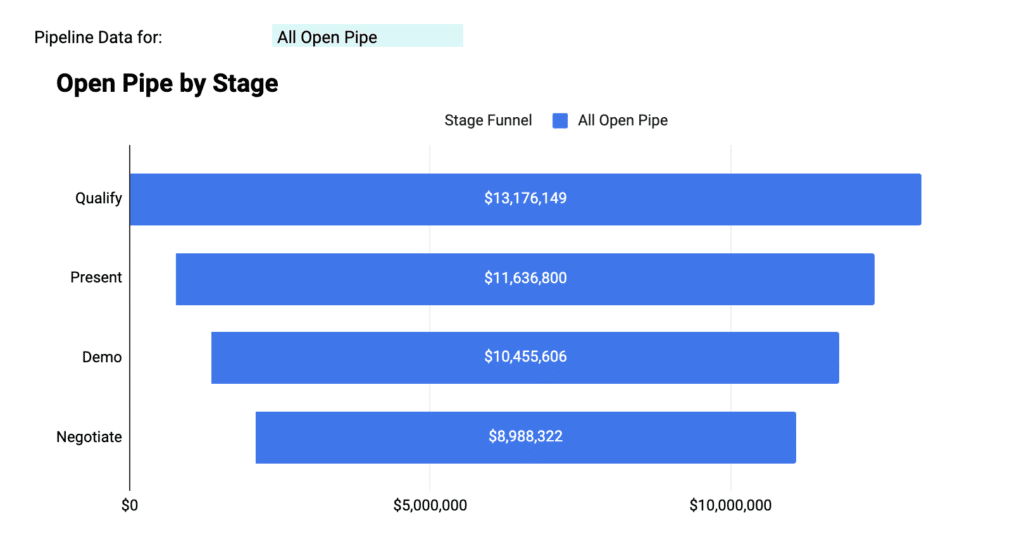
Get a full overview of open pipe by stage to understand where the opportunities are that will allow you to meet sales targets.
Our Sales to Target Template allows you to bypass all that tedious dashboard building and focus on analysis. With the template, your team will gain access to a comprehensive view of how sales targets are progressing, and where they can make up the gaps.
And you don’t have to worry about updating the sales data in Google Sheets — that’s done automatically by the template. Launch the Sales to Target Template now with your Salesforce or HubSpot CRM data.
Launch Sales to Target Template for Salesforce
Launch Sales to Target Template for HubSpot
Sales Performance Template
Our Sales Performance Template allows sales leaders to compare year-over-year sales performance by industry, region, and account. Now you can slice-and-dice performance data by sales team, deal type, and more, using a pre-built Google Sheets dashboard that automatically syncs with your Salesforce and HubSpot CRM data.
Here’s a hands-on look at how the Sales Performance Template works.
At the top of the template, you can toggle between year, team, country, and opportunity. This will segment the dashboards in the template to show the specified data.

See visualizations for yearly historic revenue, and total sales by year, quarter, month, and week at the top of the dashboard. View a high-level overview of monthly sales by country with a geographic gradient map.

Manage your top 5 accounts and industries with fresh bar graphs powered by real-time CRM data.

View the largest deals closed in a pre-designed report, including deal name, account name, amount, close date, and owner.

Our Sales Performance Template offers all the performance dashboards your team needs to measure yearly, monthly, weekly, and daily growth. Give it a try — it only takes one click to launch the template.
Launch Sales Performance Template for Salesforce
Launch Sales Performance Template for HubSpot
Opportunity History Changes Template
Opportunity History Field Tracking is a powerful Salesforce report that records the change history of opportunity fields. But it is difficult to maximize the potential of the report due to the rigid reporting functionality in Salesforce.
Combining Opportunity History metrics with the flexibility of Google Sheets opens up a new dimension of sales pipeline analysis. In Google Sheets, SalesOps Managers can track historical pipeline conditions and expand sales forecasting with augmented data about past trends in opportunities.
However, getting this Opportunity History data into Google Sheets, and creating dashboards to visualize it, is a challenge in its own right. That’s why we designed our pre-built Salesforce Opportunity History Template for Google Sheets.
Coefficient’s Opportunity History Template shows how new sales pipelines, lost opportunities, changing close dates, and up-sells impact your bottom-line revenue streams. The template unleashes the full potential of Salesforce’s Opportunity History Field Tracking:
- Track your sales pipeline over any period of time
- Identify opportunities with value changes or time frame modifications
- Set custom fiscal year periods and monitor changes by month, quarter, or year
- Slice and dice opportunity changes by sales team, opportunity type, or account details
- Identify changes to close dates, opportunity amounts, and other fields that affect sales forecast
The Salesforce Opportunity History Template allows you to apply a more incisive analysis to your opportunities and historical sales pipeline trends. Launch the free template now to get started.
Launch Opportunity History Changes Template for Salesforce
Sales Revenue & Expenses
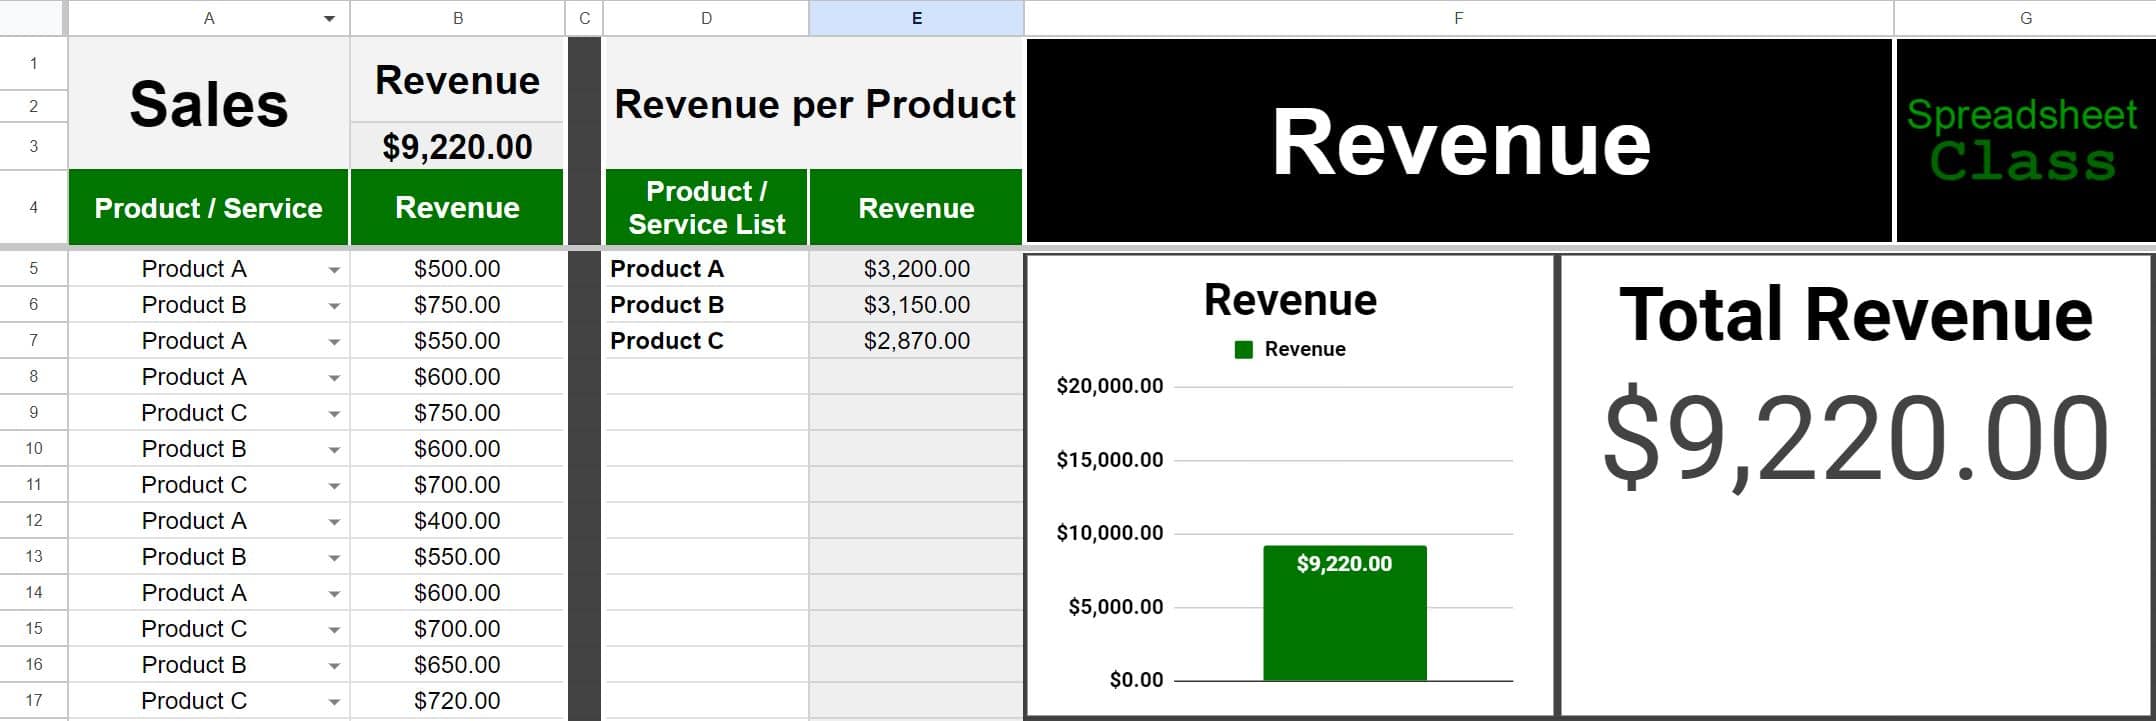
This free sales template (& sales + expenses template) by Spreadsheet Class will allow you to track your individual sales, and categorize your sales. You can easily view your totals in the template’s charts. Check out the variety of templates created at Spreadsheet Class.
Free Sales Tracking Spreadsheets: Focus on the Tasks that Matter
With our free sales tracking spreadsheets, you can bypass all the grunt work associated with building dashboards and focus instead on insights and analysis. Try these out these free, pre-built Google Sheets dashboards now, and also check out our other sales templates to speed up and optimize your workflows and sales cycles.


