


Table of Contents
![]()
- 1. 10 Best CRM Reporting Tools for 2026
- 2. Sales Velocity Tracking: How to Calculate and Track Overtime in Google Sheets
- 3. Average Deal Size: How to Measure + Optimize Forecasting (With Template)
- 4. How You Can Measure and Optimize Pipeline Velocity
- 5. How You Can Measure and Optimize Win Rate Today (2024 Guide)
- 6. Quota Attainment: How to Measure in 2026 (With Template)
- 7. Top 10 Sales Metrics to Track in 2025
- 8. How to Analyze Sales Rep Performance in Google Sheets
- 9. 5 Sales Revenue Metrics to Measure Success in 2024 (With Templates)


Analyzing sales rep performance is crucial for understanding the effectiveness of your team’s productivity in the field. Metrics like average deal size and win rate are valuable indicators of how each rep is contributing to the bottom line.
But accurately assessing performance is often a manual, time-consuming process. Thankfully, you can easily track sales rep performance in Google Sheets using Coefficient’s AI Copilot.
This step-by-step guide will walk you through how to analyze sales performance by each rep in Google Sheets using Coefficient’s powerful GPTX functions.
Let’s dive in!
Step-by-Step Walkthrough: Analyze Sales Rep Performance in Your Spreadsheet
1. Install Coefficient
Coefficient is a free Google Sheets add-on that allows you to connect your business systems to Google Sheets and pull real-time data into your spreadsheet.
Coefficient also comes with several powerful AI features that make sales rep analysis much simpler.
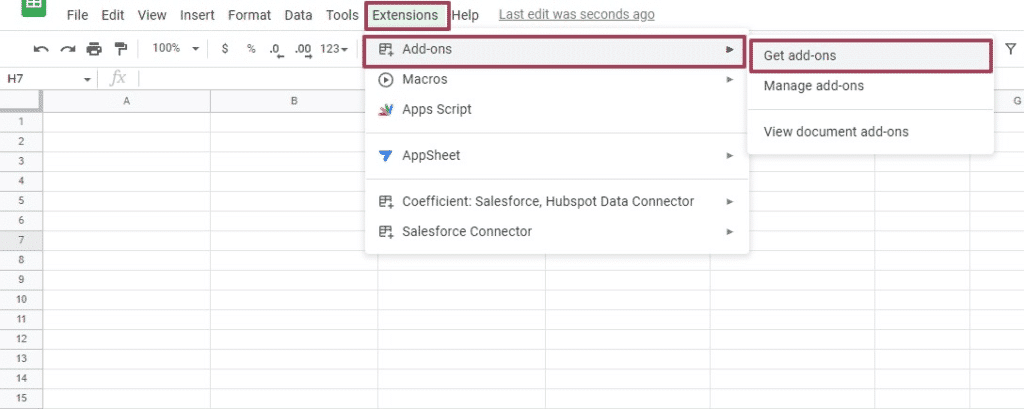
First, let’s install Coefficient. Open Google Sheets. Click Extensions on the menu bar and select ‘Add-ons’ -> ‘Get add-ons.’
This will launch Google Workspace Marketplace. In the search bar at the top, search for “Coefficient” and select the Coefficient app.

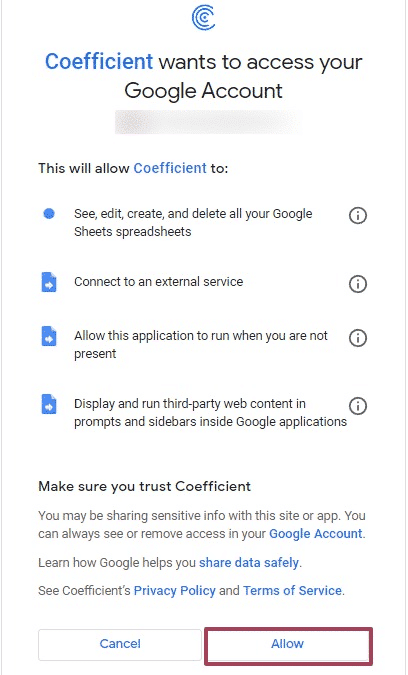
Coefficient will now ask you for permission to access your Google account. Press ‘Allow’ to complete the installation.
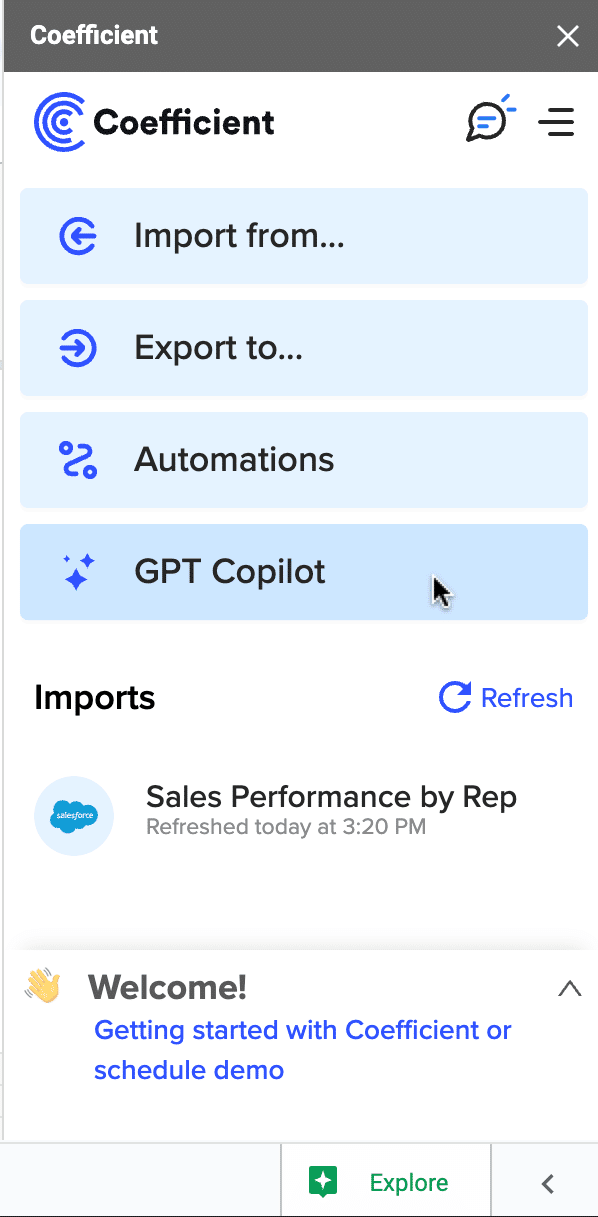
Once completed, return to your Google Sheets menu and click on Extensions -> Coefficient -> Launch.
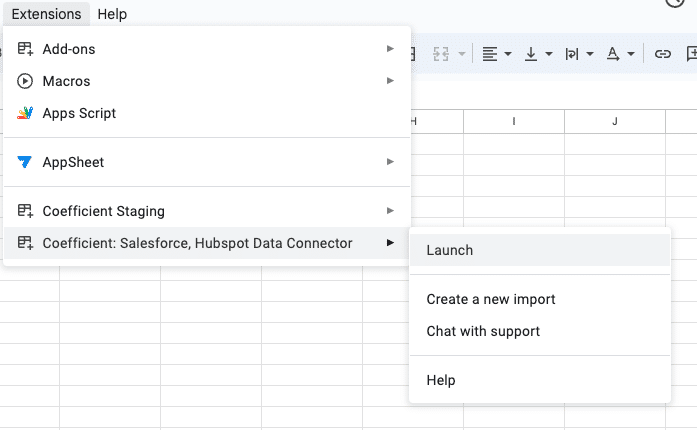
Coefficient will now appear on the sidebar of your Google Sheet.
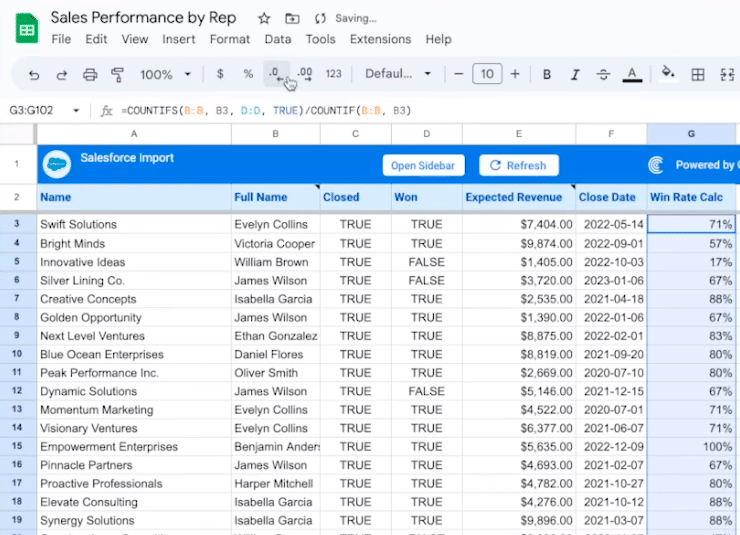
2. Import Live Salesforce Data
Now you must import your live Salesforce CRM data into Google Sheets.
This data will provide the foundation for your analysis, giving you insights into deal sizes, win rates, and revenue generated by each sales rep.
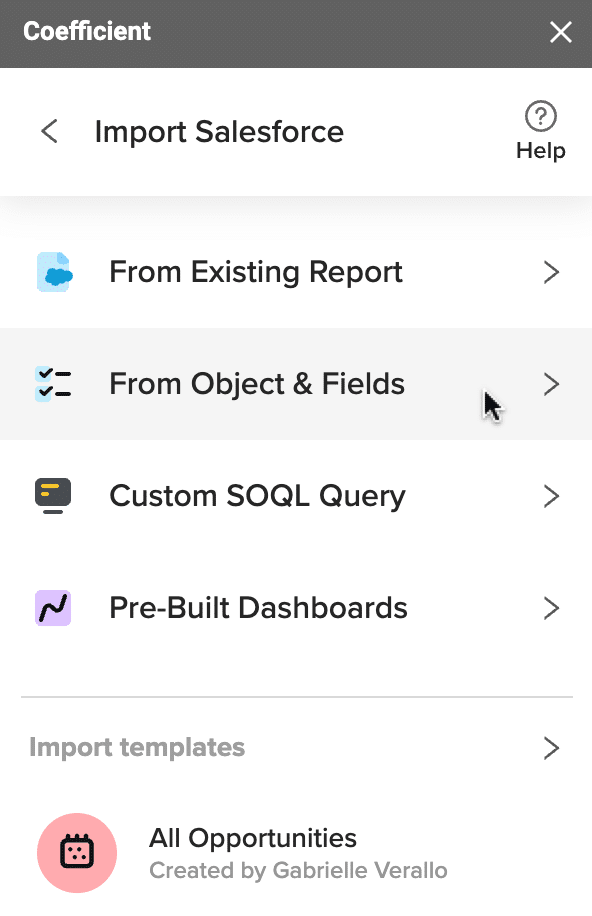
Click ‘Import from…’ on the Coefficient sidebar menu.

Select Salesforce as your data source.

Click ‘From Objects & Fields.’
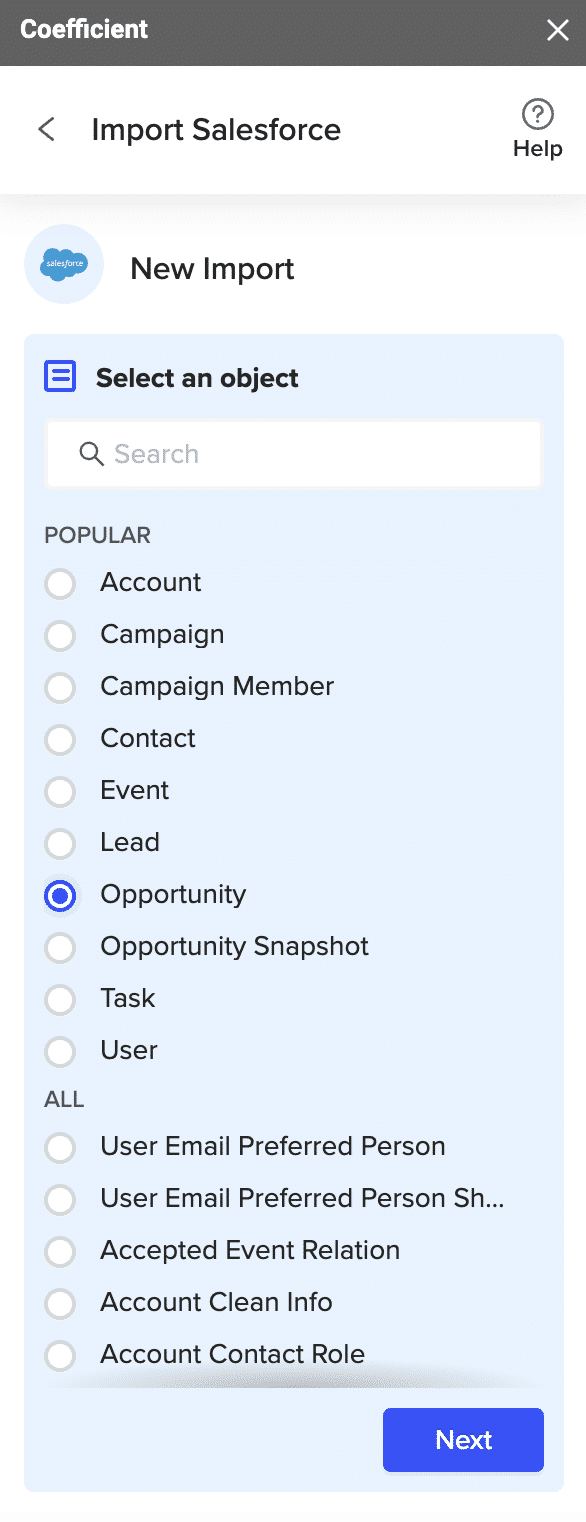
Under ‘New Import,’ choose the ‘Opportunity’ object.
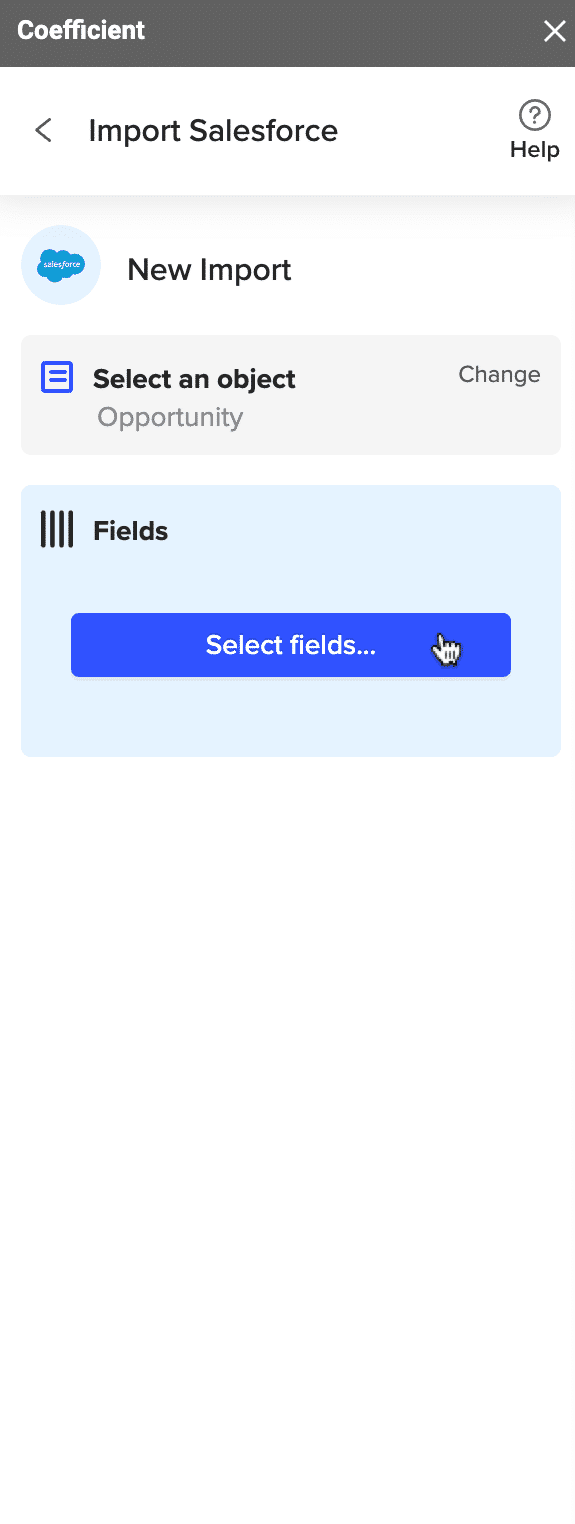
Click ‘Select fields…’
Then select the following fields: ‘Name,’ ‘Full Name,’ ‘Closed,’ ‘Won,’ ‘Expected Revenue,’ and ‘Close Data.’
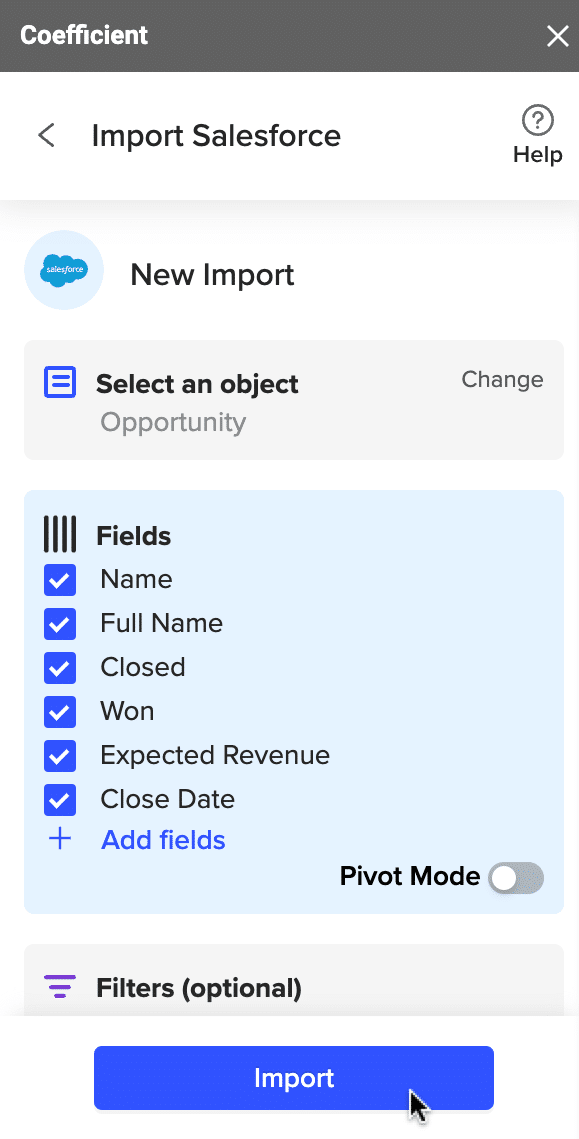
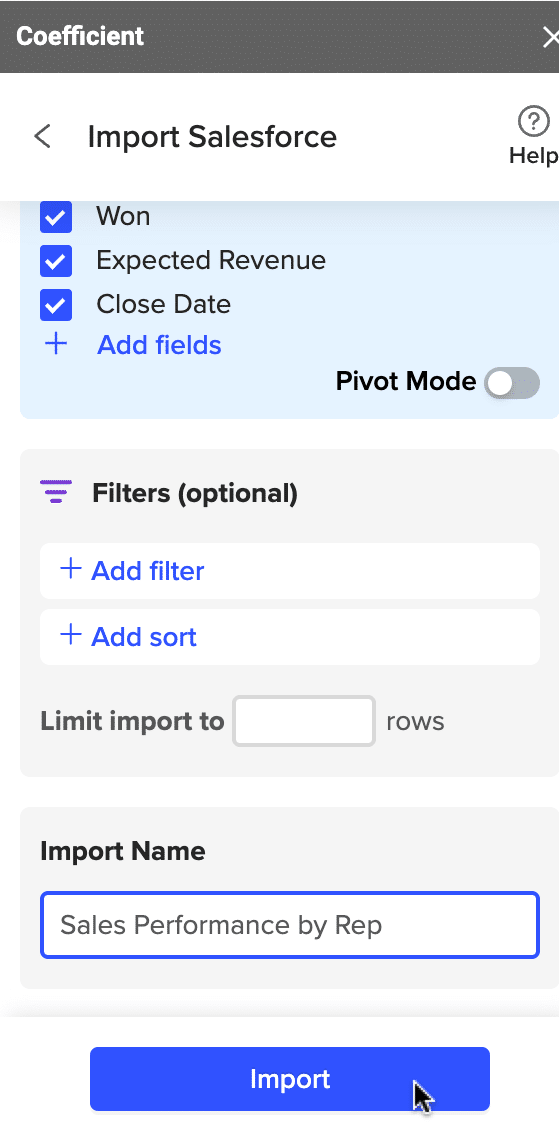
Once all the fields are selected, name your import and click ‘Import’ to send your data to Google Sheets.
3. Analyze Sales Rep Performance
Now let’s calculate each sales rep’s average deal size and win rate by creating custom formulas with Coefficient’s GPTX functions.
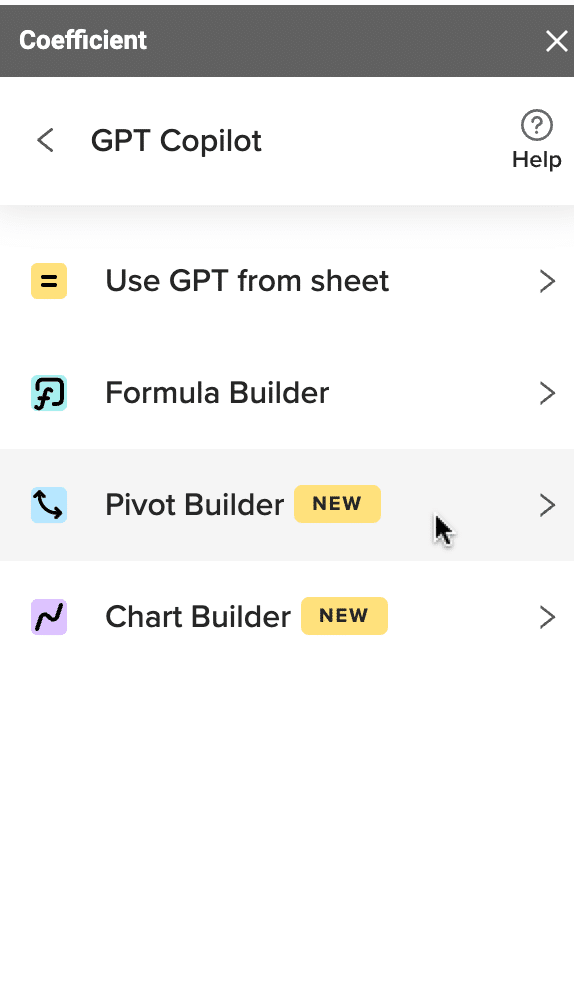
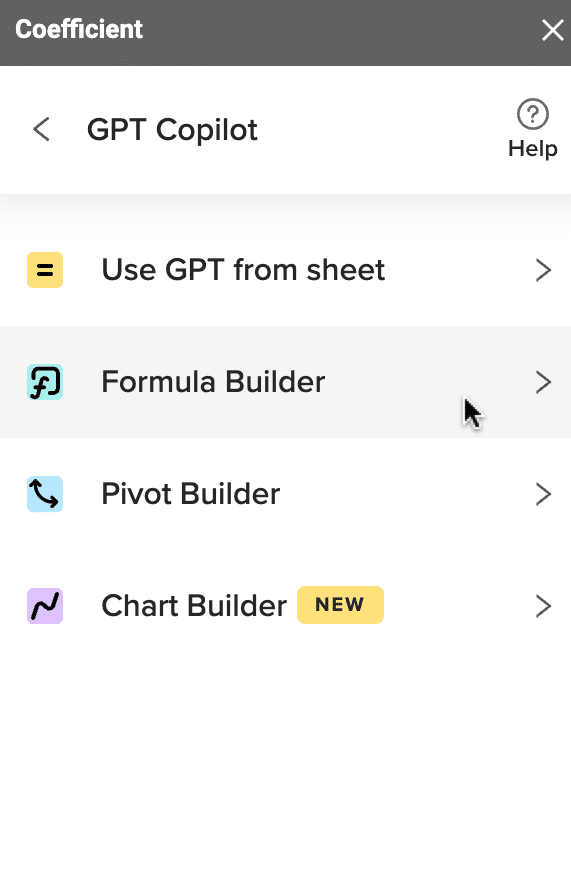
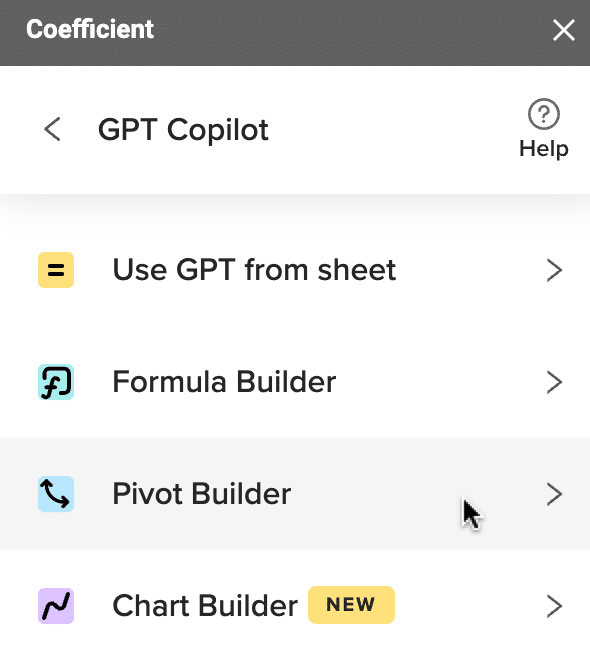
Go back to Coefficient’s main menu and click ‘GPT Copilot.’
Select ‘Pivot Builder.’
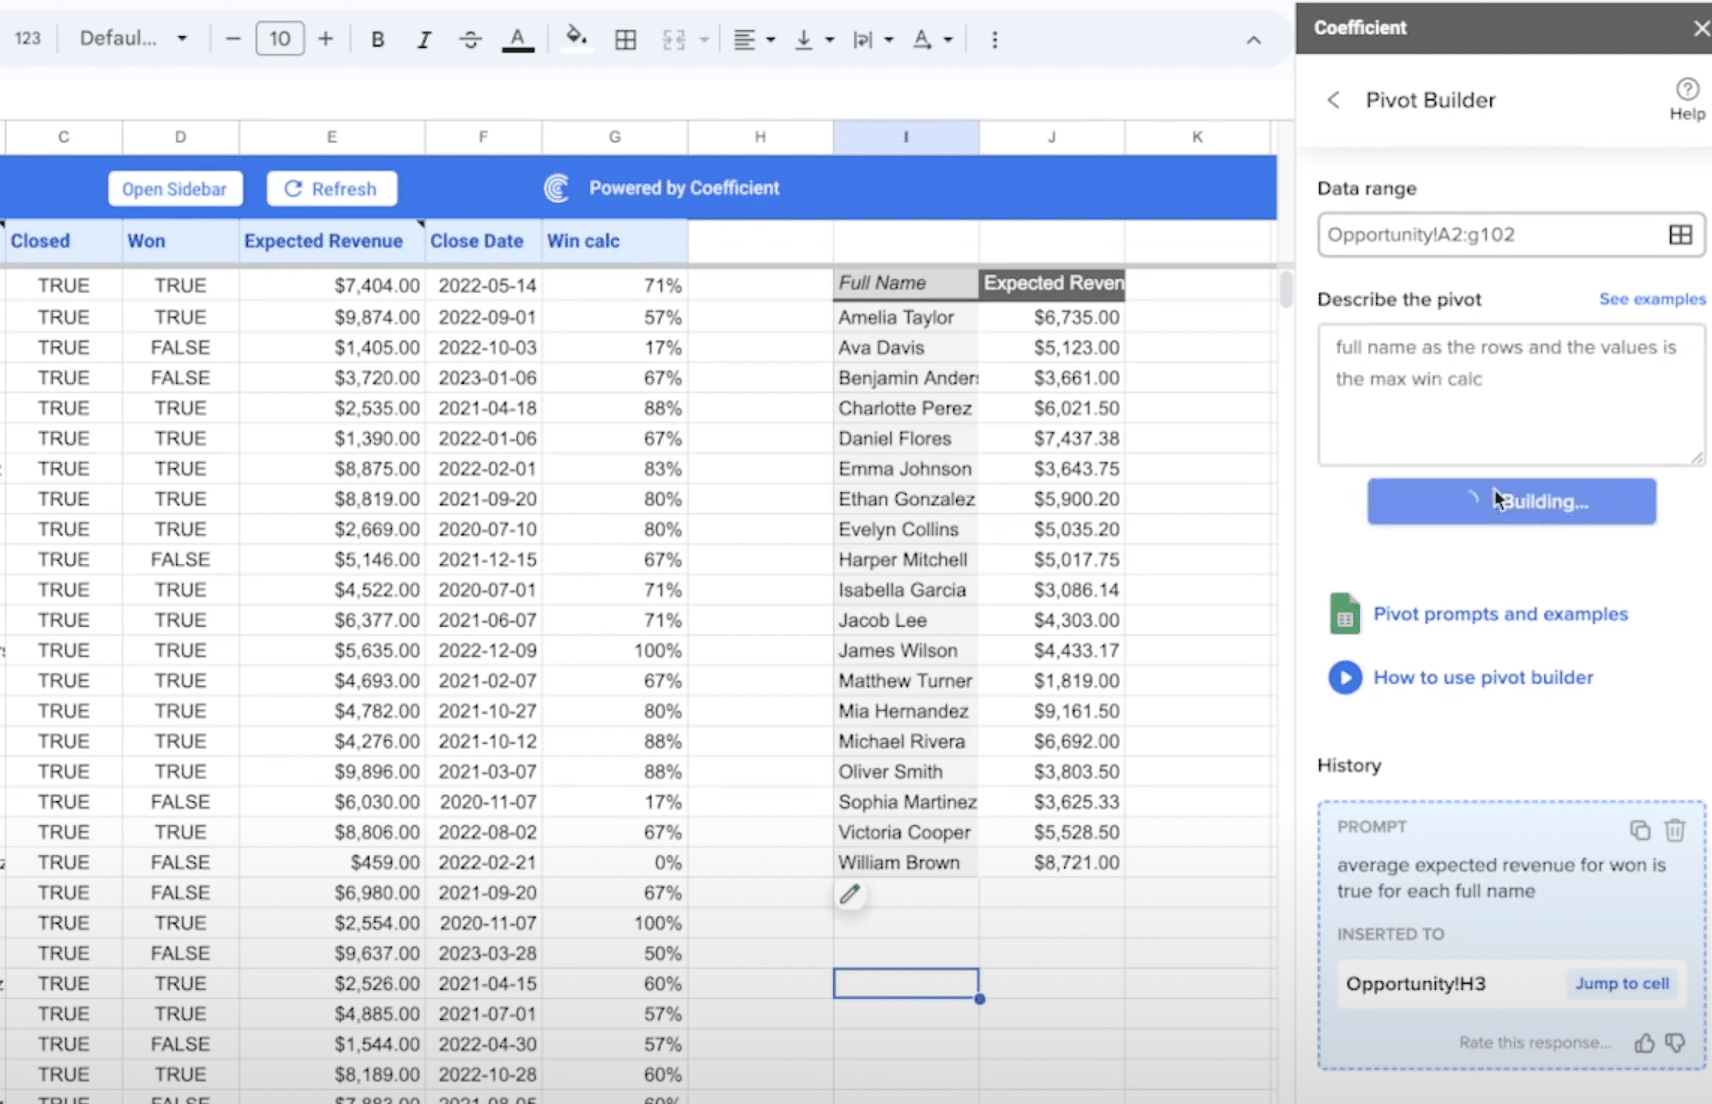
Use your cursor to select your data range. For this example, the range is Opportunity!A2:F102.
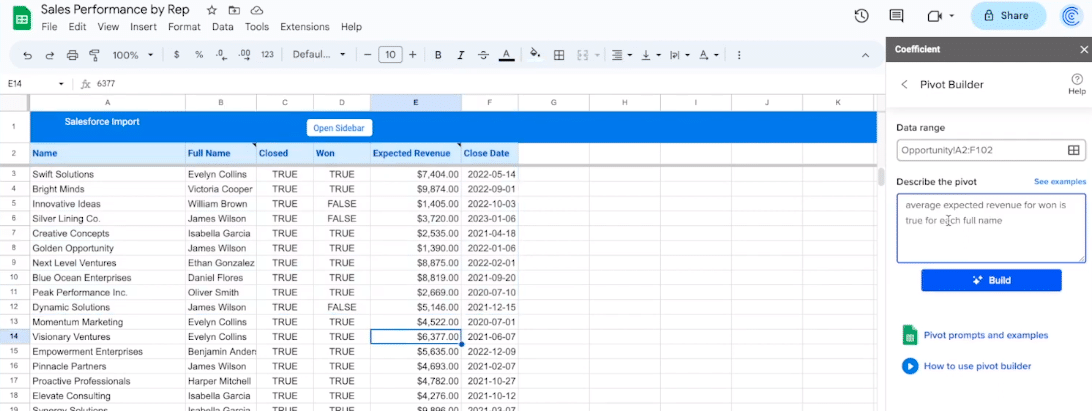
Next, describe the pivot you wish to build in the text box. In this example, the prompt we’ll use is: “average expected revenue for won is true for each full name”.
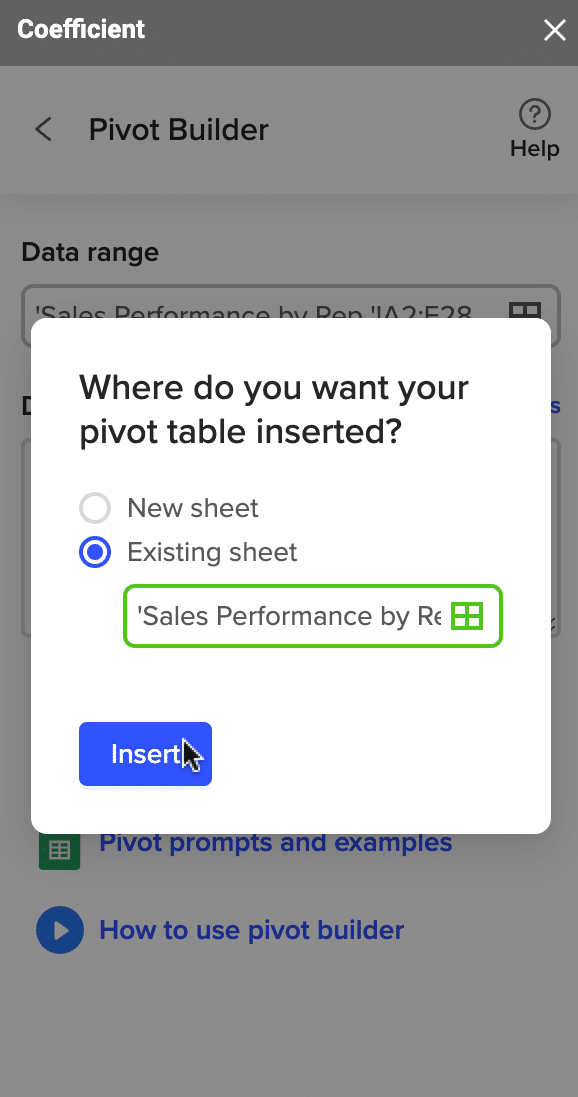
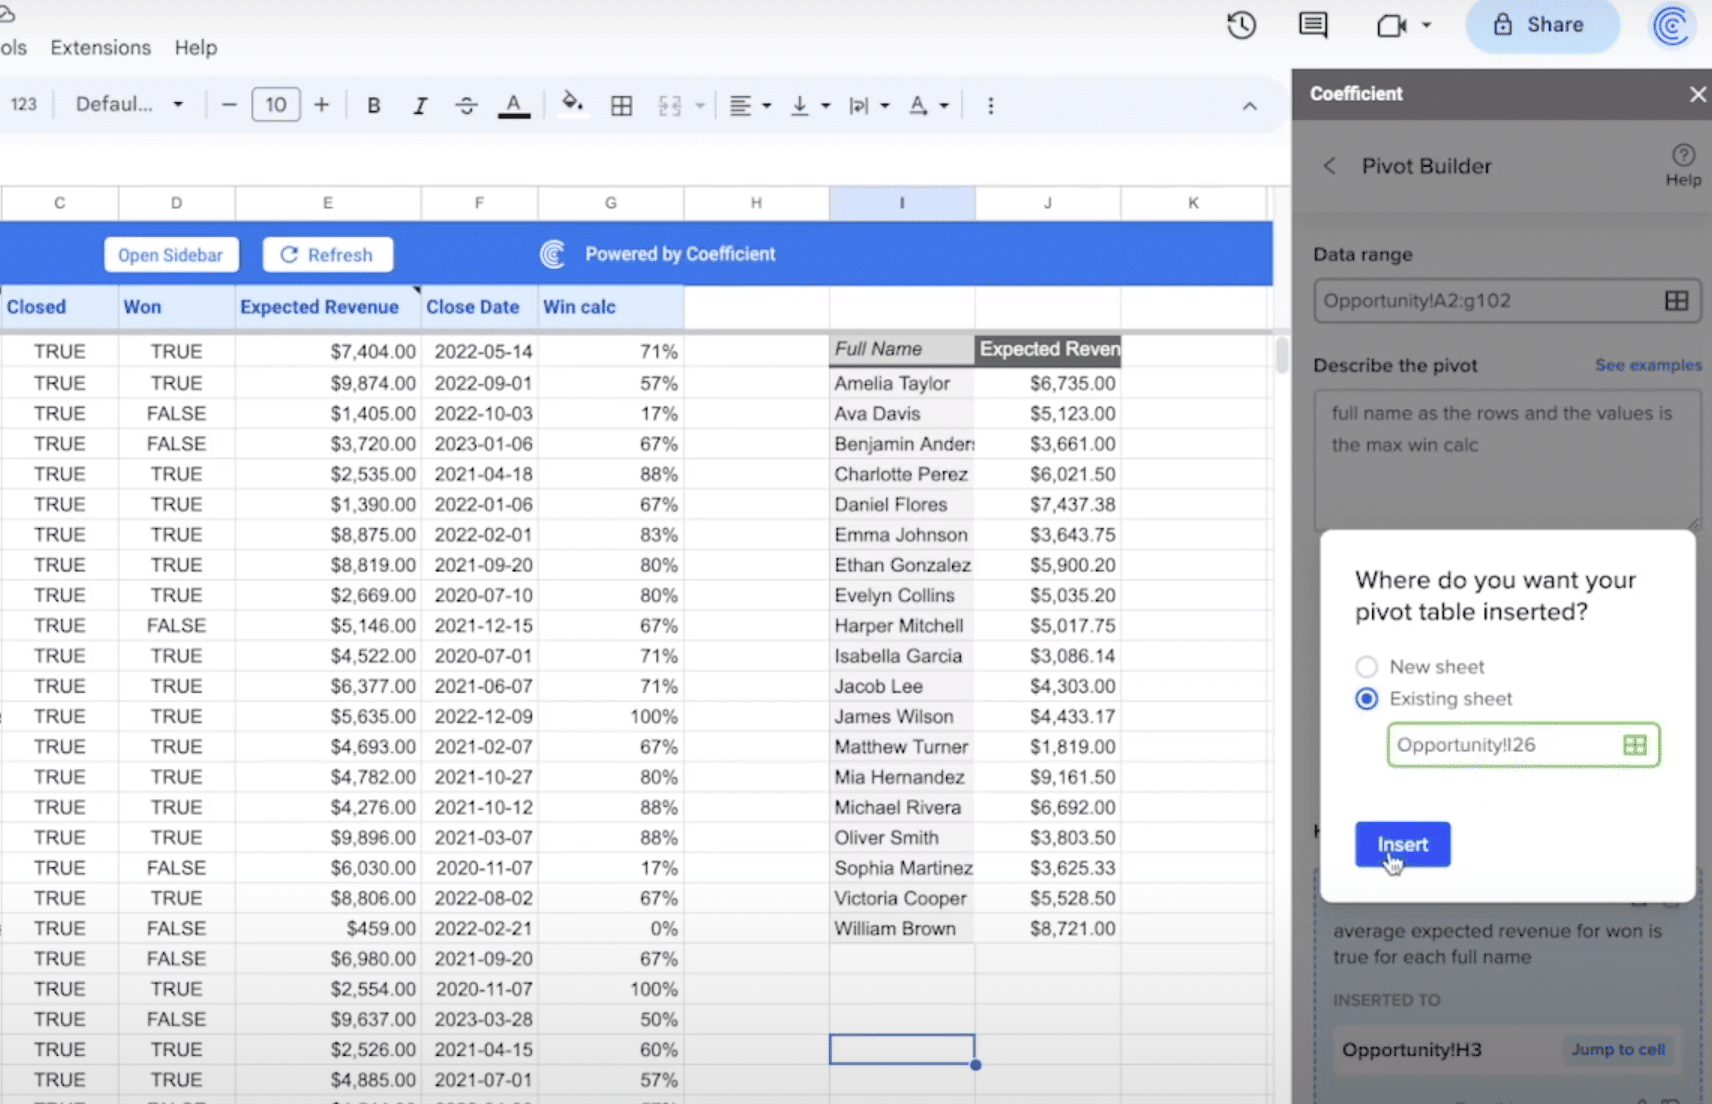
Now click ‘Build’ and insert your pivot table in an empty cell on your spreadsheet.
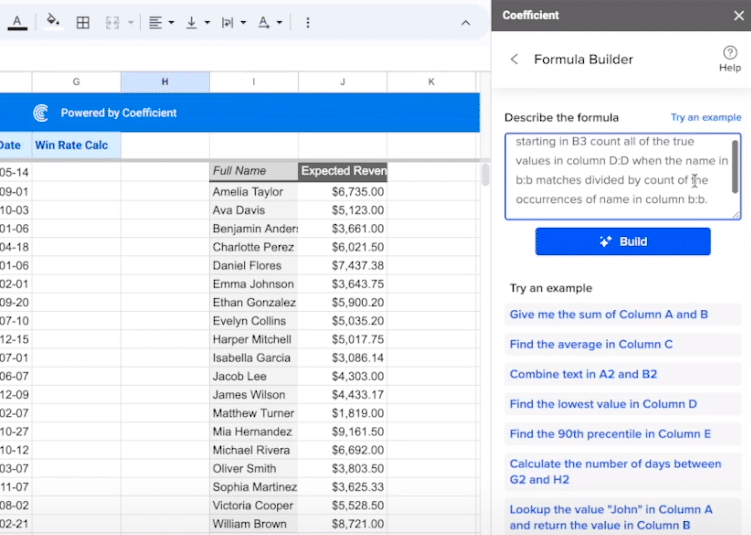
Next, we’ll create a custom formula with the Formula Builder to calculate individual rep win rate.
Describe the formula you wish to build.
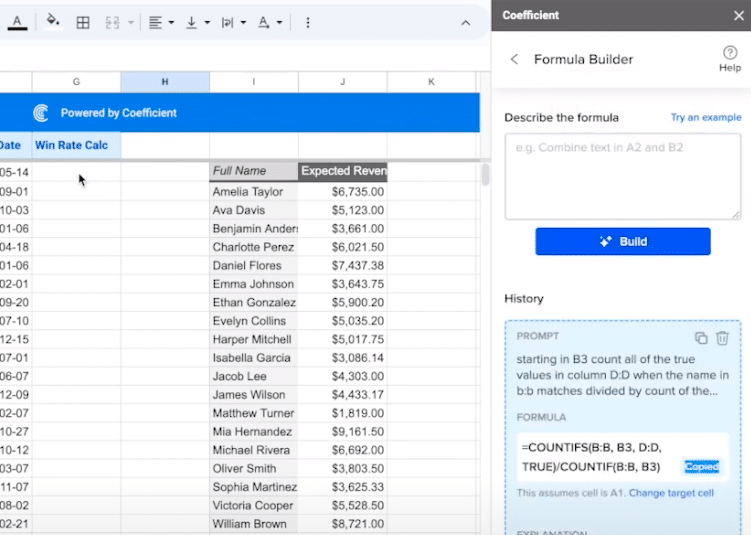
For this example, our prompt is: “starting in B3 count all of the true values in column D:D when the name in b:b matches divided by count of the occurrences of name in column b:b”.
Create a new column called ‘Win Rate Calc,’ and copy and paste the formula builder’s output into the cell below it. For this example, the formula is:
=COUNTIFS(B:B,B3, D:D, TRUE)/countif(B:B, B3)
Drag the formula down for all your sales reps. Now format the row by percentage. Click the % icon on the toolbar.
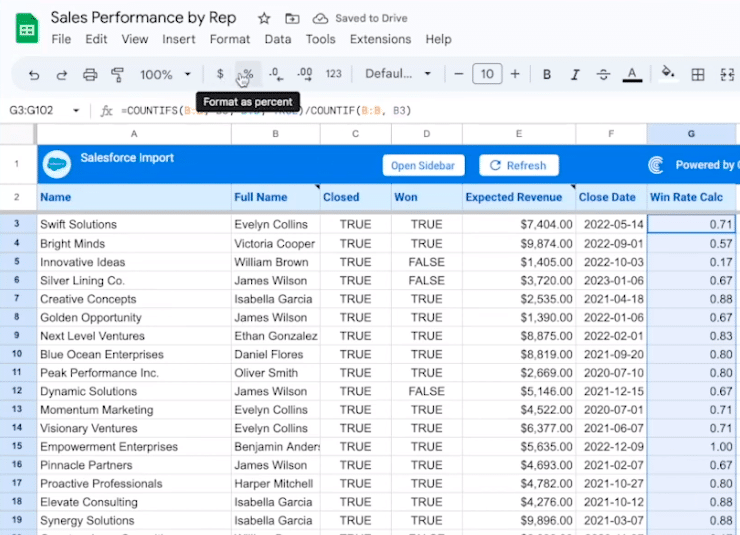
And finally, remove a decimal to make the data easier to read. Click the .0 icon on the toolbar.
Next, we’ll build a pivot table to track sales rep sales performance over time. Return to the GPT Copilot menu and select ‘Pivot Builder.’
Use your cursor to select the data range and describe the pivot you wish to create.
In this example, the prompt is: “full name as the rows and the values is the max win calc”.
Insert the formula into your spreadsheet.
Next, we’ll group by salesperson and pivot by month and year.
Select the data range. Enter this prompt in the text box: “group by expected revenue by full name where won is true, pivot by close data year and close date month”.
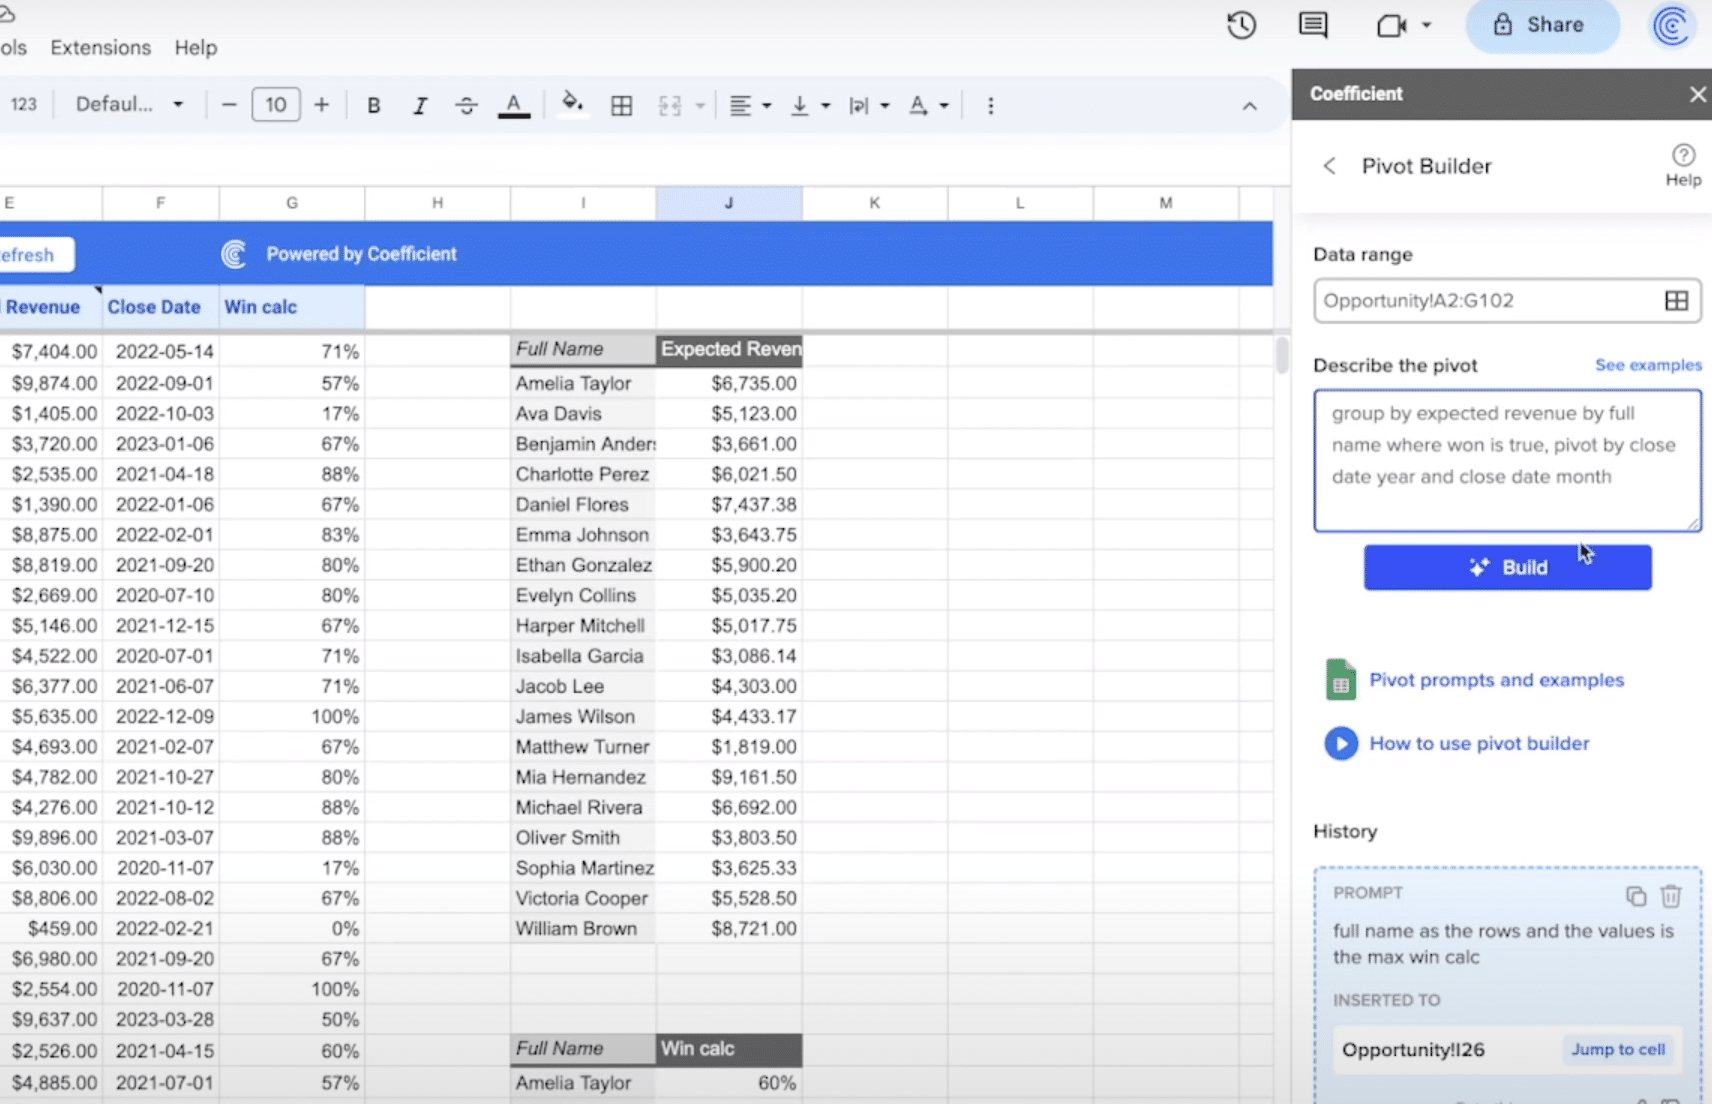
Select ‘Build’. Now insert the formula into an empty cell.
As a last step, let’s calculate the number of deals won and revenue generated per rep.
Use your cursor to select the data range. Then describe the table you want to build in Pivot Builder.
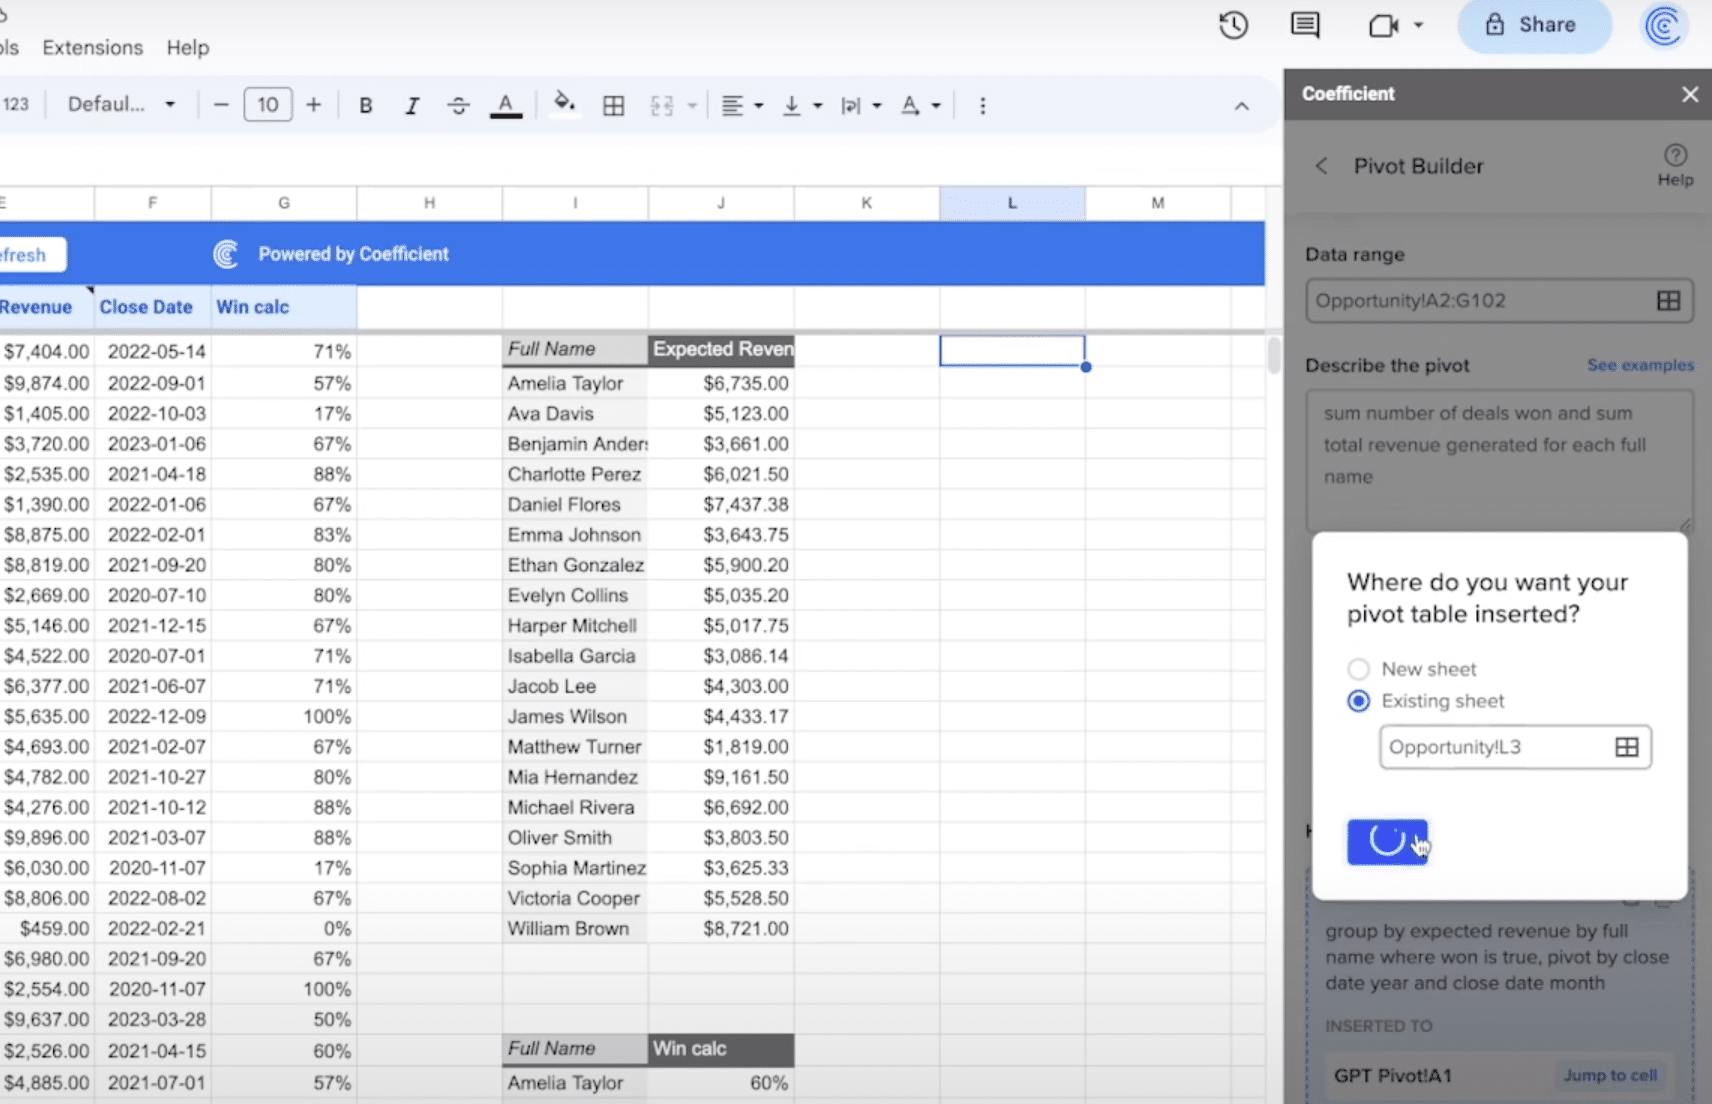
In this example, the prompt is: “Sum number of deals won, and sum total revenue generated when won is true for each full name”.
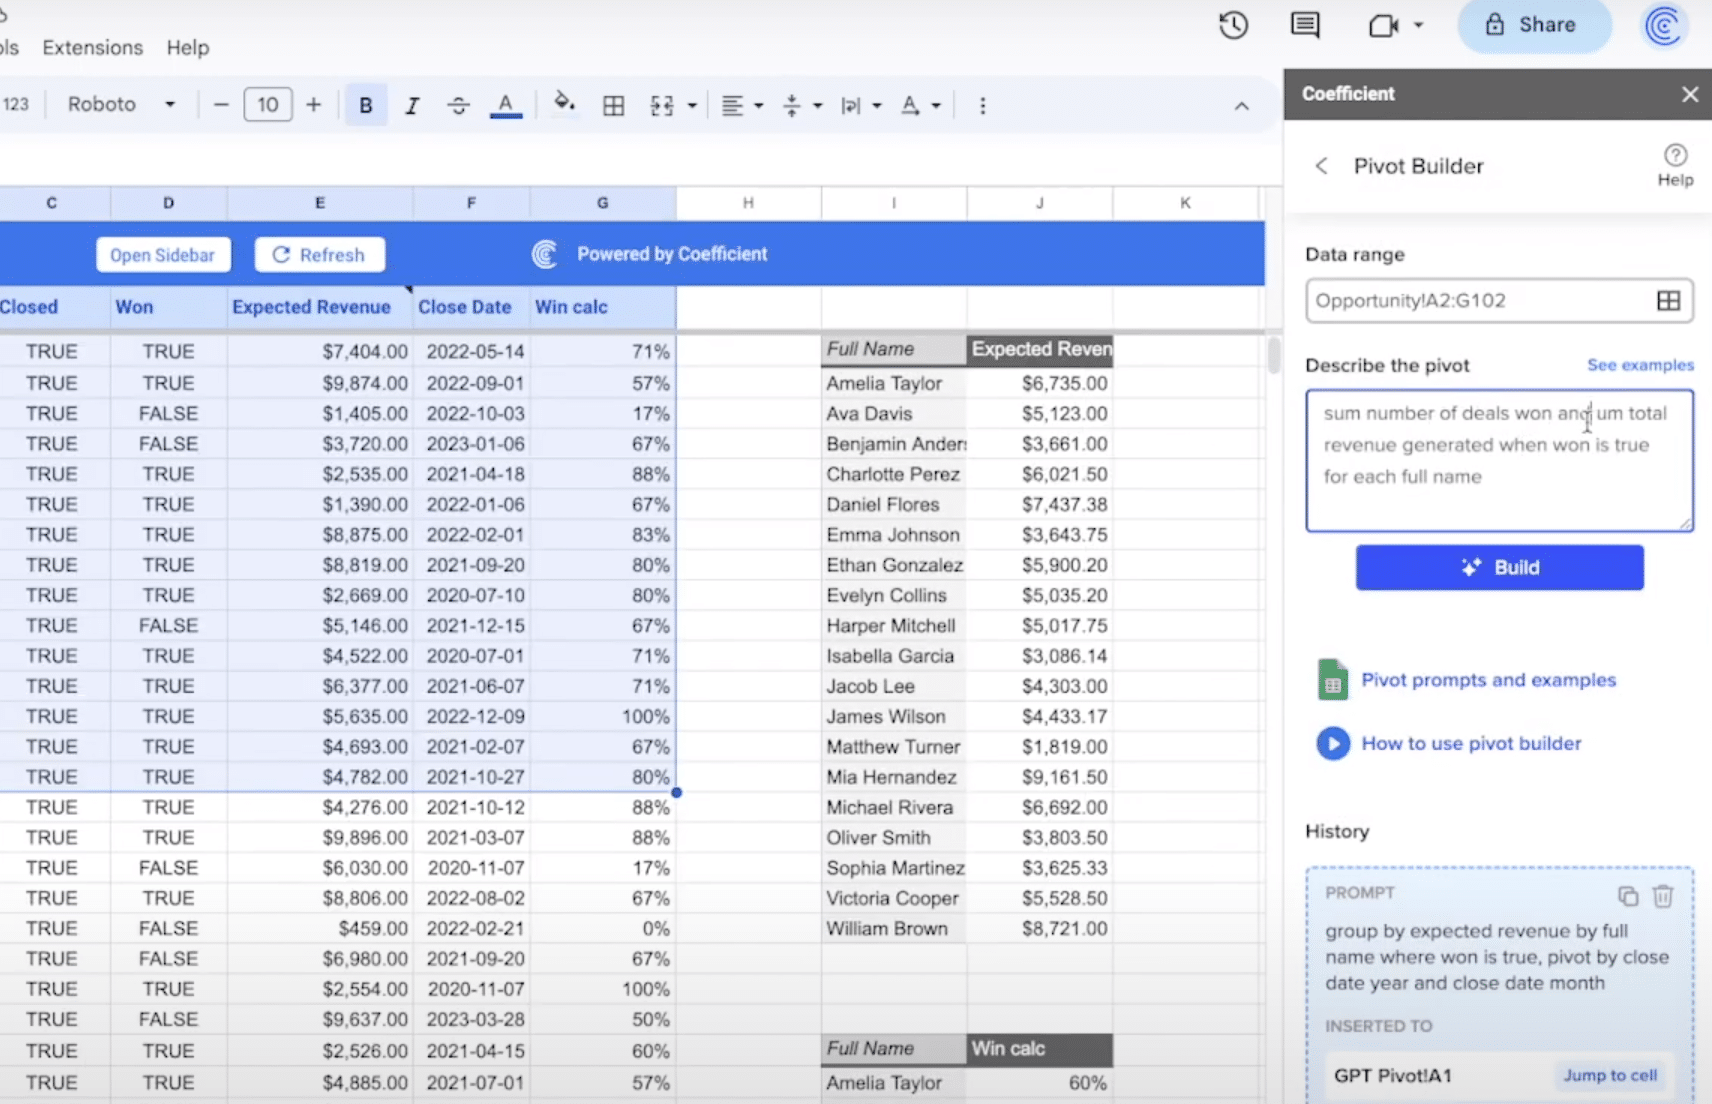
Select ‘Build’. Insert the formula into a cell to generate the calculation.
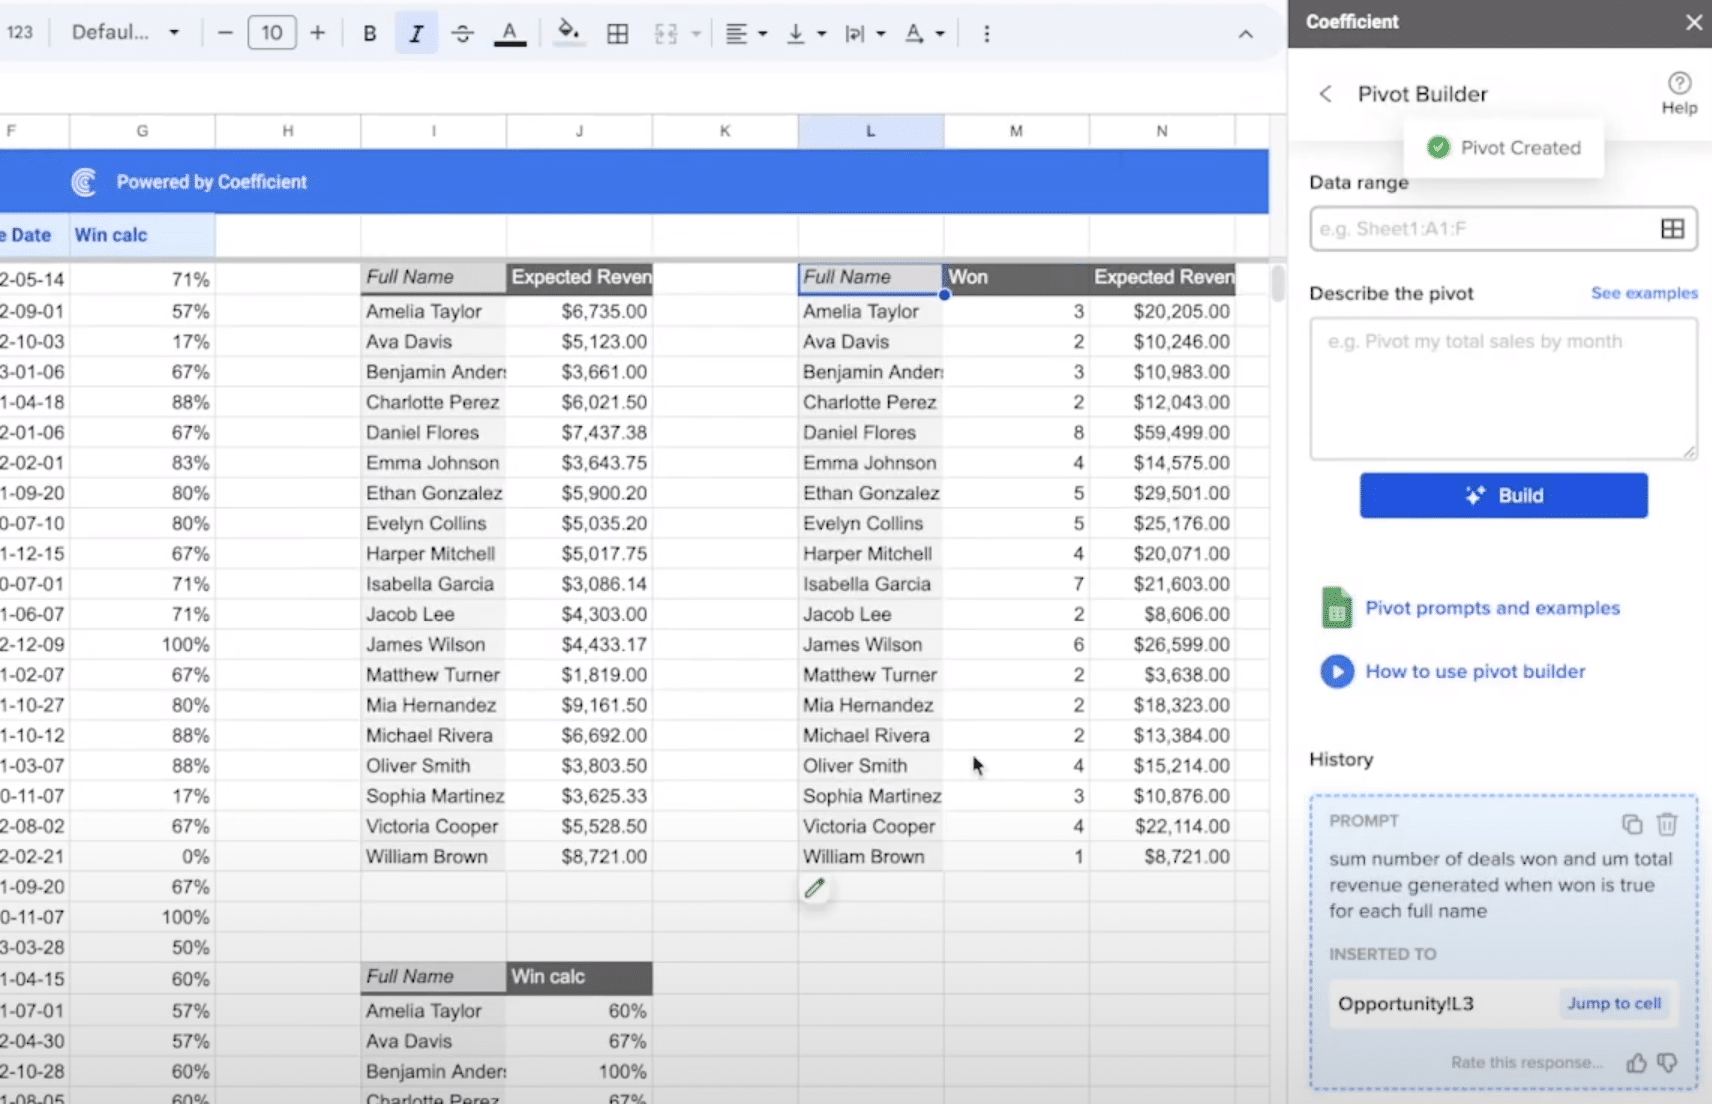
And there you have it! Now you can analyze the performance of your individual sales reps directly inside Google Sheets.
Sales Rep Performance Analysis with Live Data in Google Sheets
Coefficient combines the power of AI, live data, and Google Sheets, allowing you to perform sales rep analysis, sales forecasting, and other critical sales calculations in a fraction of the time.
Get started with Coefficient for free to bring enhanced sales analysis to Google Sheets with the power of AI.
