
Qlik and Tableau have dominated the enterprise business intelligence market for over a decade. Both are serious platforms built for serious data work: complex multi-source environments, governed self-service analytics, and dashboards that need to perform at scale. If you are evaluating them against each other in 2026, the core question is not which one is better in the abstract. It is which one fits your data model, your team’s technical capability, and your total cost of ownership.
This guide compares Qlik and Tableau across the dimensions that actually determine whether a BI platform succeeds inside an organization: architecture, analytics approach, AI features, pricing, ease of use, and deployment. It also covers where both tools fall short, and what teams running on Google Sheets or Excel should consider before committing to either platform.
Qlik vs Tableau: quick comparison
| Qlik Sense | Tableau | |
| Core engine | Associative QIX engine (in-memory) | VizQL / Hyper extract engine |
| Analytics approach | Free-form associative exploration | Query-based, visual drag-and-drop |
| Best for | Complex multi-source data exploration | Polished dashboards and data storytelling |
| AI features | Qlik Answers (gen AI), Insight Advisor, NLP queries | Tableau Pulse, Tableau Agent (formerly Einstein Copilot) |
| Pricing model | Capacity-based (Qlik Cloud) or per-user | Per-user role-based (Viewer, Explorer, Creator) |
| Starting price | $825/month (Starter, 20 users) | $15/user/month (Viewer) |
| Deployment | Cloud, on-premise, hybrid | Cloud (Tableau Cloud), on-premise (Tableau Server), hybrid |
| Learning curve | Steeper — scripting and data modeling required | Moderate — drag-and-drop but advanced features take time |
| Embedded analytics | Strong | Strong — Tableau for polished branded embeds |
Core architecture and analytics approach
The most important difference between Qlik and Tableau is not the interface. It is the data engine underneath, and the model of analysis that engine enables.
Qlik: the associative engine
Qlik’s QIX engine loads data into a compressed, in-memory columnar store and maintains relationships between every field across every data source simultaneously. When a user clicks a value in one chart, Qlik instantly recalculates every other chart on the dashboard to show what is associated with that selection and what is excluded. There are no predefined drill-down paths. Users can explore any relationship in any direction without an analyst having set up that path in advance.
This is genuinely powerful for organizations with complex, multi-source data where the questions users need to ask cannot all be anticipated during dashboard design. The trade-off is implementation complexity. Qlik’s associative model requires skilled data engineers to build clean, well-structured data models using Qlik Script. Getting data into Qlik correctly is not a weekend project.
Tableau: visual query-based analytics
Tableau translates visual intent into queries through its VizQL engine. A user drags a field onto a canvas, Tableau constructs the underlying query and returns a visualization. Data can be queried live from a source database or pulled into Tableau’s Hyper engine as an in-memory extract for faster performance. Tableau excels at pixel-perfect dashboards, sophisticated design control, and data storytelling. Its Level of Detail (LOD) expressions give analysts fine-grained control over aggregation logic that would require complex scripting in other tools.
The limitation is linearity. The exploration paths in a Tableau dashboard are largely defined by the analyst who built it. Business users can filter and drill on what has been exposed, but they cannot freely explore relationships the way Qlik’s associative model enables. For organizations that need polished, consistent dashboards consumed by a broad audience, this is rarely a problem. For organizations that need exploratory self-service analytics across complex data, it can be a constraint.
AI and ML capabilities
Both platforms made significant AI investments in the last couple of years. The capabilities are meaningfully different in design philosophy.
Qlik AI: Qlik Answers and Insight Advisor
Qlik’s AI suite centers on two products. Insight Advisor uses machine learning to automatically surface chart suggestions, detect associations, and generate natural language descriptions of data patterns. It is embedded into Qlik Sense and available without additional configuration for users who have the right license tier.
Qlik Answers is the generative AI layer, launched in 2024 and built on models including Amazon Bedrock. It allows users to ask questions in plain English against unstructured data sources, such as documents, PDFs, and knowledge bases, alongside structured analytics data. This positions Qlik as one of the few BI platforms that bridges structured and unstructured data in a single AI interface. Qlik Predict adds no-code predictive analytics for building and deploying ML models without data science expertise.
Tableau AI: Tableau Pulse and Tableau Agent
Tableau’s AI strategy runs through two products. Tableau Pulse delivers proactive, personalized insights: it monitors the KPIs a user subscribes to, continuously scans for anomalies, and pushes plain-language summaries and trend explanations directly to users in Slack or email. It is designed for decision-makers who need insight delivered to them rather than having to log in and explore a dashboard.
Tableau Agent, formerly known as Einstein Copilot for Tableau, is the generative AI assistant embedded across the Tableau Cloud platform. It handles data preparation, calculation creation, visualization generation, and data source documentation through natural language input. It is built on Salesforce’s Einstein Trust Layer and requires a Tableau+ subscription. One important constraint: Tableau Agent requires a connected Salesforce org for its generative AI features, which is a meaningful dependency for organizations not already in the Salesforce ecosystem.
| AI capability | Qlik | Tableau |
| Natural language queries | Insight Advisor, Qlik Answers | Tableau Agent |
| Proactive / push insights | Limited | Tableau Pulse (strong) |
| Generative AI assistant | Qlik Answers (structured + unstructured) | Tableau Agent (structured data, Tableau Cloud only) |
| Predictive analytics | Qlik Predict (no-code ML) | Einstein Discovery |
| Unstructured data support | Yes — Qlik Answers | No |
| Salesforce dependency | None | Required for Tableau Agent gen AI features |
| Availability | Varies by license tier | Tableau+ subscription required |
Pricing and total cost of ownership
Pricing is where the Qlik vs Tableau decision gets complicated quickly. Both platforms have moved toward more complex licensing models, and both carry implementation costs that dwarf the license fees for most organizations.
Qlik pricing (2026)
Qlik shifted to capacity-based pricing for Qlik Cloud in 2025, meaning you pay for the volume of data loaded and processed rather than strictly per seat. Legacy user-based licensing still applies to some deployments, with Professional users running $70–$150/month and Analyzer (read-only) users at $30–$50/month. The Qlik Sense Business plan starts at $825/month for 20 users. Enterprise pricing requires a custom quote.
The headline license cost is not the full picture. Implementation for a mid-sized Qlik deployment typically runs $55,000–$220,000. Training costs add $1,500–$3,000 per person. Data engineering to build and maintain Qlik’s data models typically requires 30–40 hours per week of ongoing effort. Organizations consistently report that the non-license costs in year one significantly exceed the license fees.
Tableau pricing (2026)
Tableau uses role-based per-user pricing: Viewer at $15/user/month, Explorer at $42/user/month, and Creator at $75/user/month, all billed annually. Tableau+ — required for Tableau Agent and the full AI feature set — is not publicly priced and requires a sales conversation. Organizations running Tableau at scale on Tableau Server (on-premise) face additional infrastructure and administration costs on top of license fees.
Tableau is generally considered more expensive per user than Qlik at smaller deployments but can be more cost-predictable at scale due to the role-based model. The Explorer and Creator tiers carry meaningful per-user costs for large analyst populations.
| Cost factor | Qlik | Tableau |
| Entry price | $825/month (20 users, Business plan) | $15/user/month (Viewer) |
| Power user license | $70–$150/user/month (Professional) | $75/user/month (Creator) |
| AI features | Varies by tier | Tableau+ (custom pricing) |
| Implementation (mid-market) | $55,000–$220,000 | $20,000–$100,000+ |
| Data engineering overhead | High — Qlik Script model required | Moderate — data prep outside Tableau |
| Free tier | Very limited (25MB, 5 users) | Tableau Public (public data only) |
Ease of use and learning curve
Qlik
Qlik presents two distinct experiences. For business users consuming published dashboards, the interface is intuitive and the associative filtering is genuinely powerful once understood. For the developers building those dashboards and data models, Qlik has one of the steeper learning curves in the BI market. Qlik Script, the proprietary language used to load and model data, requires real expertise to use correctly. Poorly structured data models create performance problems that are difficult to diagnose and fix.
Guided Analytics in Qlik Sense and Insight Advisor reduce the barrier for business users, but the underlying complexity does not disappear. Organizations that have successfully deployed Qlik at scale typically have dedicated Qlik developers or administrators. Organizations that tried to deploy it without that expertise report high abandonment rates.
Tableau
Tableau is consistently rated as easier to adopt for new users, particularly analysts who are comfortable with data but not with programming. The drag-and-drop interface is genuinely intuitive for basic visualization work. Where the learning curve steepens is in advanced features: LOD expressions, table calculations, data blending, and performance optimization all require meaningful investment to master.
For business users consuming dashboards, Tableau is generally easier than Qlik to navigate. For analysts building complex analyses, the depth is there but takes time to unlock. Tableau’s community and documentation are among the strongest in the BI market, which helps.
Deployment and scalability
Both platforms support cloud, on-premise, and hybrid deployment. The practical differences come down to the direction each vendor is pushing and the infrastructure requirements of each model.
Qlik
Qlik Cloud is the current-generation SaaS offering, supported on AWS and Azure. Qlik Client-Managed (formerly Qlik Sense Enterprise on Windows) remains available for organizations with strict data residency or security requirements. Qlik’s associative engine scales well for large datasets and high-cardinality data due to its in-memory columnar architecture, though complex apps with very large data volumes require careful data model design to maintain performance.

Stop exporting data manually. Sync data from your business systems into Google Sheets or Excel with Coefficient and set it on a refresh schedule.
Get Started
Tableau
Tableau Cloud is the SaaS option, supported on AWS, Azure, and Google Cloud. Tableau Server is the on-premise and private cloud option. Tableau’s Hyper engine is highly performant for extract-based analytics. Live connections to large databases perform well when the underlying warehouse is well-optimized. Tableau recommends pushing heavy computation to the database layer rather than into Tableau itself for large-scale deployments.
How to choose: Qlik vs Tableau
Neither platform is universally better. The right choice depends on what your data environment looks like, what your team can support, and what kind of analytics your users actually need.
Choose Qlik if:
- Your users need to explore complex relationships across many data sources without predefined drill-down paths
- Your data is messy, multi-source, and requires significant transformation before it can be analyzed
- You need to blend structured analytics with unstructured data sources through a single AI interface (Qlik Answers)
- You have dedicated data engineering resources to build and maintain Qlik’s data models
- You are not in the Salesforce ecosystem and want AI features without a Salesforce dependency
Choose Tableau if:
- Your priority is polished, visually sophisticated dashboards consumed by a broad stakeholder audience
- Your analysts are comfortable with data but not with scripting languages
- You need proactive AI-driven insights pushed to users without requiring them to log in and explore (Tableau Pulse)
- You are already in the Salesforce ecosystem and want tight CRM-to-analytics integration
- You need strong embedded analytics with precise design control for customer-facing applications
Consider neither if:
Both Qlik and Tableau are enterprise platforms with enterprise pricing and enterprise implementation requirements. If your team runs primarily on spreadsheets, if your data volumes do not justify the infrastructure overhead, or if the six-figure implementation costs are not in budget, there is a strong case for a different category of tool entirely.
A third option: Coefficient for spreadsheet-native analytics
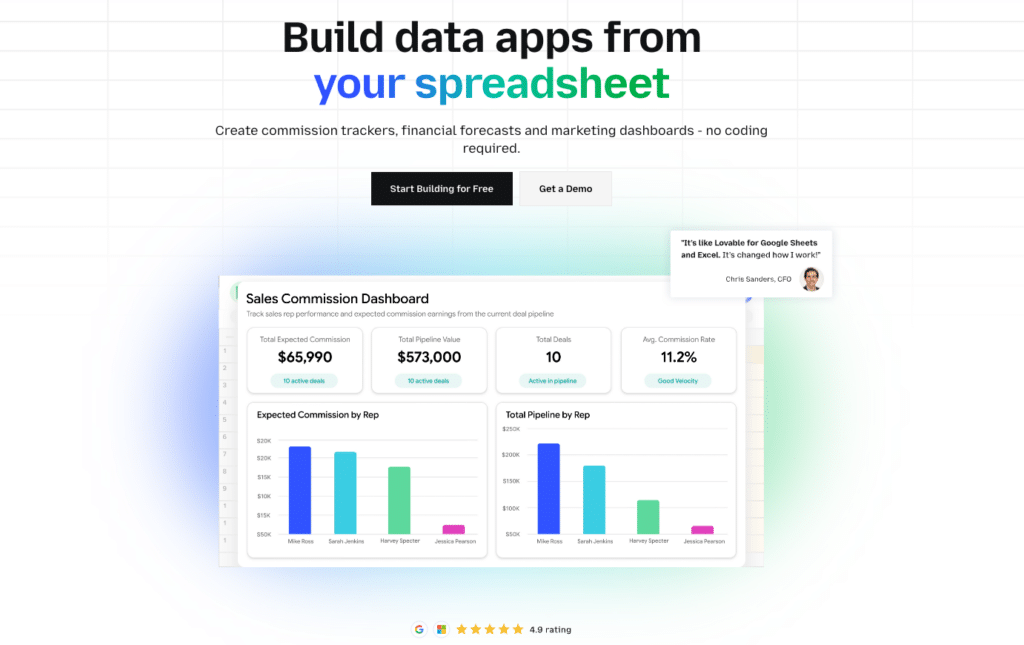
Qlik and Tableau solve a real problem: turning complex, multi-source enterprise data into governed, scalable analytics. But they introduce a different problem for many teams — platform adoption, training overhead, licensing cost, and the requirement to pull analysts out of the tools they already work in.
For marketing, sales, finance, and operations teams whose primary working environment is Google Sheets or Excel, Coefficient is a different category of answer. It connects spreadsheets directly to 150+ business systems including Salesforce, HubSpot, Snowflake, and NetSuite with scheduled auto-refresh, so dashboards stay current without manual exports. The AI Sheets Assistant builds reports, writes formulas, and generates pivot tables and charts from plain English prompts. Live Web Dashboards turn any spreadsheet model into a shareable, auto-updating web dashboard without a separate BI platform.
| Qlik | Tableau | Coefficient | |
| Works in spreadsheets | No | No | Yes — Google Sheets and Excel |
| Learning curve | High | Moderate | Zero — uses existing spreadsheet skills |
| Starting price | $825/month | $15/user/month | Free; paid from $49/month |
| Per-user fees | Yes | Yes | No |
| Live data connections | Yes | Yes | Yes — 150+ connectors |
| Two-way sync (write-back) | Limited | No | Yes |
| AI assistant | Qlik Answers, Insight Advisor | Tableau Agent, Pulse | AI Sheets Assistant |
| Published web dashboards | Yes | Yes | Yes — Live Web Dashboards |
| Implementation cost | $55k–$220k | $20k–$100k+ | None |
| Best for | Enterprise data exploration | Visual storytelling at scale | Business teams in spreadsheets |
Coefficient is not a replacement for Qlik or Tableau in environments that need enterprise data governance, complex embedded analytics, or associative exploration across hundreds of millions of rows. It is the right tool for business teams who need live data, automated reporting, and shareable dashboards without leaving the spreadsheet environment they already use every day.
Try Coefficient free and connect your first data source in minutes.
Qlik vs Tableau: FAQs
Is Qlik better than Tableau?
Neither is categorically better. Qlik’s associative engine makes it stronger for free-form data exploration across complex, multi-source environments. Tableau is stronger for polished visual dashboards, data storytelling, and teams that prioritize ease of use. The right choice depends on your data complexity, team capabilities, and use case.
What is the main difference between Qlik and Tableau?
The core architectural difference is the analytics engine. Qlik uses an associative model that maintains relationships between all data points simultaneously, allowing users to explore in any direction without predefined paths. Tableau uses a query-based model that retrieves data in response to visual actions, which is faster and more intuitive for structured analysis but limits free-form exploration.
How much does Qlik cost in 2026?
Qlik Sense Business starts at $825/month for 20 users. Enterprise pricing is custom. User-based licensing runs $70–$150/month for Professional users and $30–$50/month for Analyzer (read-only) users. Implementation costs for mid-market deployments typically run $55,000–$220,000 on top of license fees.
How much does Tableau cost in 2026?
Tableau is priced by user role: Viewer at $15/user/month, Explorer at $42/user/month, and Creator at $75/user/month, all billed annually. Tableau+ — required for the full AI feature set including Tableau Agent — is custom-priced. On-premise deployments via Tableau Server carry additional infrastructure costs.
Does Tableau have AI features?
Yes. Tableau Pulse delivers proactive, plain-language insights pushed to users based on their subscribed KPIs. Tableau Agent (formerly Einstein Copilot for Tableau) is an AI assistant embedded in Tableau Cloud that handles data prep, calculation creation, and visualization generation through natural language. Tableau Agent requires a Tableau+ subscription and a connected Salesforce org for its generative AI capabilities.
Does Qlik have AI features?
Yes. Qlik’s AI suite includes Insight Advisor for automated chart suggestions and NLP queries, Qlik Answers for generative AI against both structured and unstructured data sources, and Qlik Predict for no-code predictive analytics. Qlik Answers does not require a Salesforce connection, which is a differentiator versus Tableau Agent.
Which is easier to use, Qlik or Tableau?
Tableau is generally considered easier to learn, particularly for analysts coming from a non-technical background. Its drag-and-drop interface is intuitive for basic visualization work. Qlik requires more technical depth, especially in data modeling and scripting, which creates a steeper learning curve for developers. For business users consuming finished dashboards, both are reasonably accessible.
What are the alternatives to Qlik and Tableau?
Common alternatives include Power BI (strongest for Microsoft-centric environments, lowest entry cost), Looker (strong semantic layer and governed self-service), and ThoughtSpot (NLP-first analytics). For teams whose work lives primarily in spreadsheets, Coefficient connects Google Sheets and Excel to 150+ data sources with live refresh and AI-assisted reporting, without requiring a separate BI platform or training overhead.


