Qlik and Power BI are both Gartner Magic Quadrant Leaders in Analytics and Business Intelligence. They have been for sixteen consecutive years. But they are built on completely different architectural philosophies and serve different buyer profiles. Getting the choice wrong costs more than the licence fee.
This guide cuts through the feature tables. It covers what Qlik and Power BI actually cost in 2026, what changed recently, where each platform genuinely outperforms the other and which team should pick which tool.
| Quick verdict: Power BI wins for Microsoft-ecosystem organisations on cost and ease of adoption. Qlik wins for teams that need the associative engine for complex data exploration, or for SaaS companies that need embedded analytics at scale. For most mid-market organisations, Power BI is the default choice. Qlik earns its premium when the associative model genuinely changes how your team explores data. |
What Each Platform Actually Is in 2026
Qlik: Now Qlik Cloud Analytics
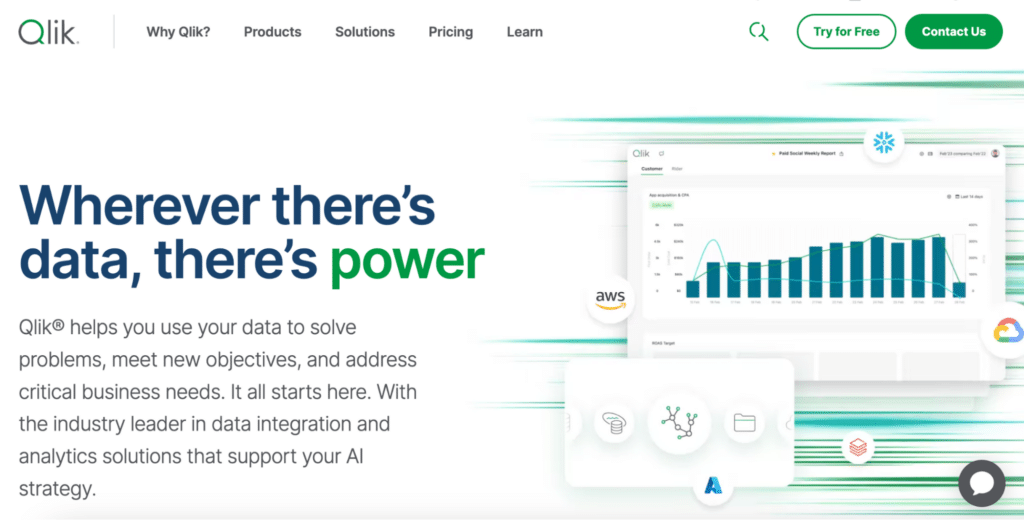
The company’s current flagship product is Qlik Cloud Analytics, not QlikView (the legacy product that many Power BI comparisons still benchmark against). Qlik has also acquired Talend, creating a combined data integration and analytics platform: Qlik Talend Cloud. In 2026, Qlik is positioning as a full data pipeline-to-analytics stack, not just a BI visualisation tool.
Qlik’s defining technical differentiator is its associative engine. Unlike query-based tools that return results for a predefined query path, Qlik’s engine indexes all possible data relationships in memory. When a user selects a value, Qlik shows what is related (green), what is unrelated (white) and what is excluded (grey). This enables data exploration patterns that are genuinely difficult to replicate in Power BI or Tableau.
Power BI: Now the BI Layer of Microsoft Fabric
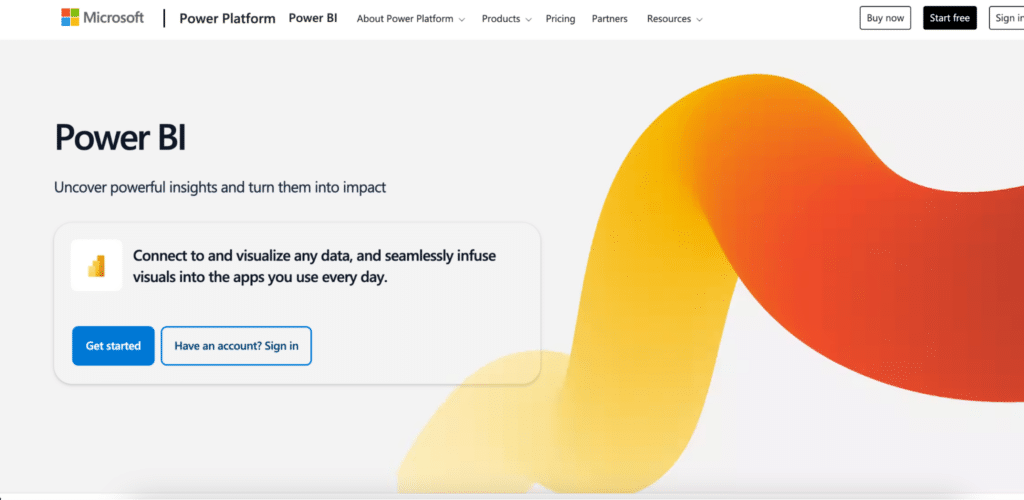
Power BI is no longer a standalone product. In 2026, it is the visualisation and reporting layer of Microsoft Fabric, Microsoft’s unified data platform that brings together data engineering, warehousing, data science and business intelligence under one capacity licence. For organisations committed to Azure and Microsoft 365, Power BI is effectively bundled into a broader infrastructure investment rather than evaluated as a separate purchase.
Microsoft Copilot in Power BI adds AI-generated report pages, DAX formula writing and dataset summarisation. This is an add-on at $30/user/month on Pro licences, and is included in Fabric capacity SKUs.
Qlik vs Power BI: What It Actually Costs
This is where the comparison is starkest. Power BI is considerably cheaper at entry level. Qlik’s capacity model becomes more competitive at enterprise scale.
Power BI Pricing
| Plan | Price | What it includes |
|---|---|---|
| Free / Desktop | $0 | Report creation only. Cannot publish or share. |
| Pro | $14/user/month | Publish, share and collaborate. Standard refresh frequency. |
| Premium Per User (PPU) | $24/user/month | Advanced AI, larger models, higher refresh frequency. |
| Copilot add-on | +$30/user/month | AI report generation, DAX writing, dataset summarisation. |
| Fabric capacity (F64+) | From ~$8,000/month | Removes per-viewer cost. Copilot included. Unified data platform. |
Qlik Cloud Analytics Pricing
| Plan | Price | What it includes |
|---|---|---|
| Starter | $825/month (annual) | 20 full users, 25 GB data capacity. For small teams. |
| Standard | $2,500/month (annual) | 20 full users, 50 GB data capacity. For mid-market teams. |
| Premium | From ~$5,000/month | Larger capacity, advanced governance, AutoML, alerting. |
| Enterprise SaaS | Custom (contact sales) | Unlimited consumers, dedicated capacity, SLA commitments. |
Important note: Qlik’s Starter and Standard plans include a fixed number of full users (20). For teams needing more users, the Enterprise SaaS capacity model typically works out more cost-effective. Qlik argues its total cost of ownership is more predictable than Power BI at enterprise scale, because all features including AutoML, alerting and automations are included without add-ons.
Real-world cost context for 50 users: Power BI Pro at $14/user runs $8,400/year. Qlik Standard at $2,500/month runs $30,000/year. For a Microsoft 365 E5 organisation where Power BI Pro is included in existing licences, the cost gap becomes even wider. Qlik’s pricing is justified when the associative engine creates analytical value that Power BI cannot replicate.
The Associative Engine: Qlik’s Real Differentiator
Most comparison articles describe the associative engine abstractly. Here is concretely what it means in practice.
In Power BI, a user runs a report or query and gets results for that specific question. To explore a different dimension, they modify the report or filter. The exploration is bounded by what the report author anticipated.
In Qlik, a user clicks any value in any visualisation. The entire dataset immediately recalculates. Green shows what is associated with that selection. Grey shows what is excluded. White shows what is unrelated. No predefined drill-down path is needed. A sales manager can click on a specific product, immediately see which regions, reps, time periods and deal sizes are associated with it, and explore in any direction without modifying the report.
This matters for organisations with complex, heterogeneous data where the valuable insights are in unexpected cross-dimensional relationships. It is less relevant for organisations with predictable, well-understood reporting needs where the questions are known in advance.
Feature Comparison: Qlik vs Power BI
| Feature | Qlik Cloud Analytics | Power BI |
|---|---|---|
| Data exploration model | Associative engine: explore any relationship without predefined paths | Relational model: query-based, report-author-defined drill paths |
| Data visualisation | 30+ interactive chart types, auto-highlighting of patterns | 30+ chart types, strong customisation, marketplace visuals |
| Ease of use (business users) | Moderate: associative model is intuitive once learned | High: familiar to Excel and Office users |
| Ease of use (developers) | Steeper: QlikScript, set analysis and associative model require training | Moderate: DAX has a learning curve but strong documentation |
| AI features | Insight Advisor, AutoML included, natural language queries | Copilot (add-on at $30/user/month), Q&A, Azure ML integration |
| Microsoft ecosystem | Connector-based, not native | Native: Excel, Teams, SharePoint, Azure, Fabric |
| Data integration | Qlik Talend Cloud: full data pipeline and integration platform | Power Query + Dataflows: solid but less enterprise-grade than Talend |
| Embedded analytics | Strong: capacity model suits SaaS embedded deployments | Power BI Embedded (Azure): available but consumption-based billing |
| Mobile | Responsive design, offline access | View-only app, requires mobile-optimised layout |
| On-premises | Qlik Sense Enterprise on Windows | Power BI Report Server |
| Pricing model | Capacity-based (predictable at scale) | Per-user Pro, capacity for Fabric (complex at scale) |
| Entry price (teams) | $825/month (Starter, 20 users) | $14/user/month (Pro) |
AI Features: Copilot vs Qlik Insight Advisor
Microsoft Copilot in Power BI
Copilot is available as a $30/user/month add-on for Power BI Pro users, and is included in Fabric capacity SKUs. In 2026 it generates complete report pages from a plain-English prompt, writes DAX formulas from a description of the calculation you need, and summarises large datasets with narrative insights. Copilot’s quality depends heavily on the underlying data model: a well-governed semantic model produces useful outputs, a poorly structured one does not. See Microsoft’s Copilot documentation for current capabilities.
Qlik Insight Advisor and AutoML
Qlik Insight Advisor uses natural language to generate charts and insights from plain-English questions. AutoML, included in Qlik Cloud Premium and Enterprise, lets analysts build and deploy predictive models without writing code. These capabilities are included in Qlik’s plan pricing rather than sold as add-ons, which is a meaningful distinction at the enterprise level where Power BI’s Copilot costs add up across many users.
Which Should You Choose?
| Your situation | Recommendation |
|---|---|
| Your organisation runs Microsoft 365 or Azure | Power BI. The ecosystem integration is native and Power BI may already be included in existing Microsoft licences. |
| Your team explores complex, multi-source data with unpredictable questions | Qlik. The associative engine genuinely enables exploration patterns that Power BI cannot match. |
| You are a SaaS company embedding analytics in a customer-facing product at scale | Qlik. The capacity model is more cost-predictable at large consumer counts than Power BI Embedded’s consumption billing. |
| Your analysts are Excel users who need a short ramp-up time | Power BI. The DAX and interface familiarity is a real advantage. Qlik’s QlikScript takes longer to learn. |
| You need a full data integration and analytics platform, not just BI | Qlik. Qlik Talend Cloud covers the data pipeline layer that Power BI does not. |
| You are mid-market with a tight budget and standard reporting needs | Power BI. At $14/user/month vs Qlik’s $825/month minimum, the cost advantage is decisive for most mid-market use cases. |
| You need predictive modelling without a dedicated data science team | Qlik. AutoML is included in Premium and Enterprise plans. Power BI’s ML capabilities require Azure ML integration. |
| Your team works in Google Sheets or Excel alongside BI dashboards | Coefficient alongside either tool. See below. |
When Your Team Needs Live Data in Spreadsheets
Both Qlik and Power BI are built for analysts who create dashboards that business users then consume via a BI platform. The workflow assumes someone builds the report and someone else reads it.

Stop exporting data manually. Sync data from your business systems into Google Sheets or Excel with Coefficient and set it on a refresh schedule.
Get Started
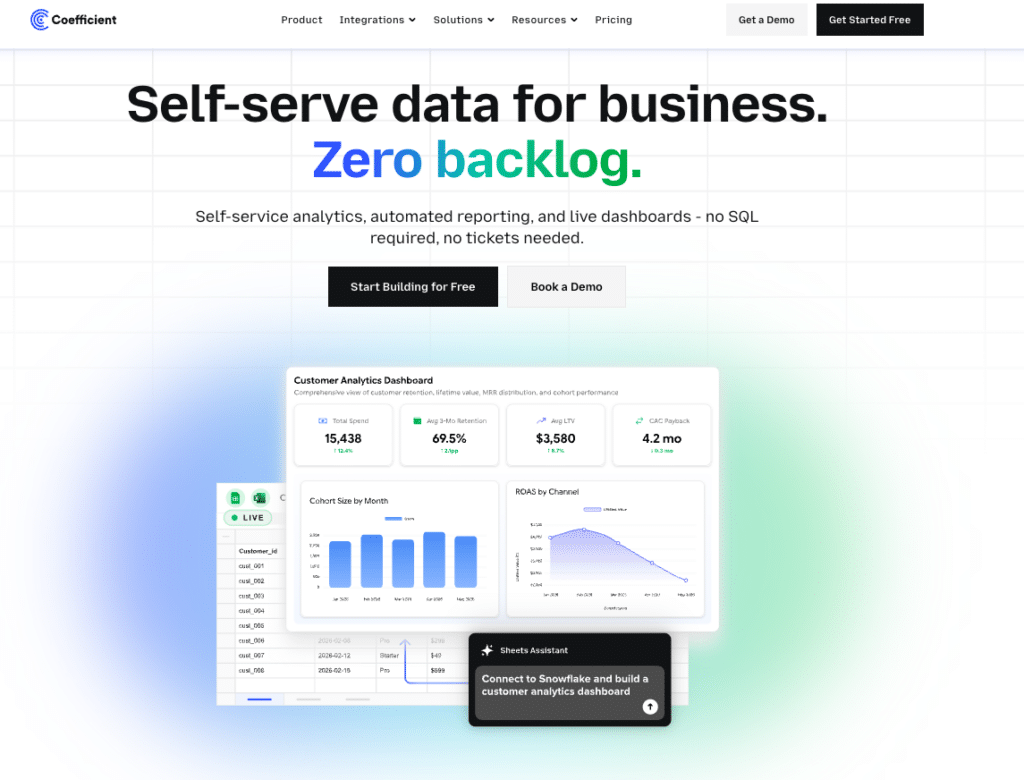
Finance managers, RevOps leads and ops teams often work differently. They analyse in Google Sheets or Excel, share via links, and need live data without filing a request.
Coefficient connects Google Sheets and Excel to 100+ source systems, including Salesforce, HubSpot, NetSuite, Snowflake, QuickBooks and more, with scheduled auto-refresh and two-way sync. Vibe Reporting lets teams describe a dashboard in plain English and publish a live, shareable web dashboard from their spreadsheet data, without a BI platform licence.
For teams already using Qlik or Power BI, Coefficient fills the last mile where business users need live data access outside the BI tool.
| “Coefficient automated everything. Instead of manually exporting data every day, I just sit back and watch the data update automatically.” Christian Budnik, FP&A Analyst, Solv |
Frequently Asked Questions
Is Power BI cheaper than Qlik?
Yes, at entry level. Power BI Pro costs $14/user/month. Qlik Cloud Analytics Starter starts at $825/month for 20 users ($41/user/month equivalent). For a 50-user team, Power BI Pro runs $8,400/year vs Qlik Standard at $30,000/year. At enterprise scale with many consumers, Qlik’s capacity model can become more cost-predictable than Power BI’s per-user licensing.
What is Qlik’s associative engine and why does it matter?
Qlik’s associative engine indexes all possible data relationships in memory rather than running predefined queries. When a user clicks any value, the entire dataset recalculates instantly, showing what is related (green), excluded (grey) and unrelated (white). This enables data exploration without predefined drill-down paths. Users can discover unexpected cross-dimensional relationships that query-based tools like Power BI require report authors to anticipate in advance.
Is QlikView the same as Qlik Sense?
No. QlikView is Qlik’s legacy product from the 1990s. Qlik Sense, now called Qlik Cloud Analytics, is the current platform. Many Power BI vs Qlik comparisons still benchmark against QlikView, which Qlik considers misleading. If you are evaluating Qlik in 2026, evaluate Qlik Cloud Analytics.
Does Power BI work with Qlik data?
Not natively. Teams can export data from Qlik and import it into Power BI, but this is a manual process. Most organisations choose one platform rather than running both. Some larger organisations use Qlik for data exploration and Power BI for standardised reporting on top of the same underlying data source.
Which is better for embedded analytics?
Qlik is generally better for SaaS companies embedding analytics in customer-facing products at large scale. Its capacity model means consumer counts do not drive up costs linearly. Power BI Embedded is available through Azure, but its consumption-based billing can become unpredictable as user counts grow. Both platforms support white-labelling and SSO.
What happened to QlikView?
QlikView is Qlik’s legacy product and is still supported, but Qlik’s development focus is entirely on Qlik Cloud Analytics. Organisations still running QlikView are encouraged to migrate to Qlik Cloud Analytics. New evaluations should not consider QlikView.
What is Qlik Talend Cloud?
Qlik Talend Cloud is the combined data integration and analytics platform created after Qlik acquired Talend in 2023. It covers the full data pipeline from source to insight: data ingestion, transformation, quality management and analytics. For organisations needing both ETL capabilities and BI in one platform, Qlik Talend Cloud is a meaningful differentiator over Power BI, which relies on Power Query and Dataflows for data preparation.


