As a Pipedrive user, you know the importance of data in driving your business forward. But getting that data out of Pipedrive and into a format you can analyze can be a challenge.
That’s where Microsoft Excel comes in.
In this guide, we’ll show you three methods for integrating Pipedrive with Excel, including a no-code solution that makes it easy for anyone to get the data they need.
Why Pipedrive Microsoft Excel Integration?
By integrating Pipedrive with Excel, you can:
- Save time by automating data exports
- Create custom reports tailored to your business needs
- Make informed decisions based on real-time data
Pipedrive Microsoft Excel Integration: 3 Methods
Method 1| Coefficient: No-Code, Fully Automated
Coefficient is a no-code tool that allows you to export Pipedrive data to Excel in just a few clicks. Here’s how it works:
To install Coefficient, open Excel from your desktop or in Office Online.
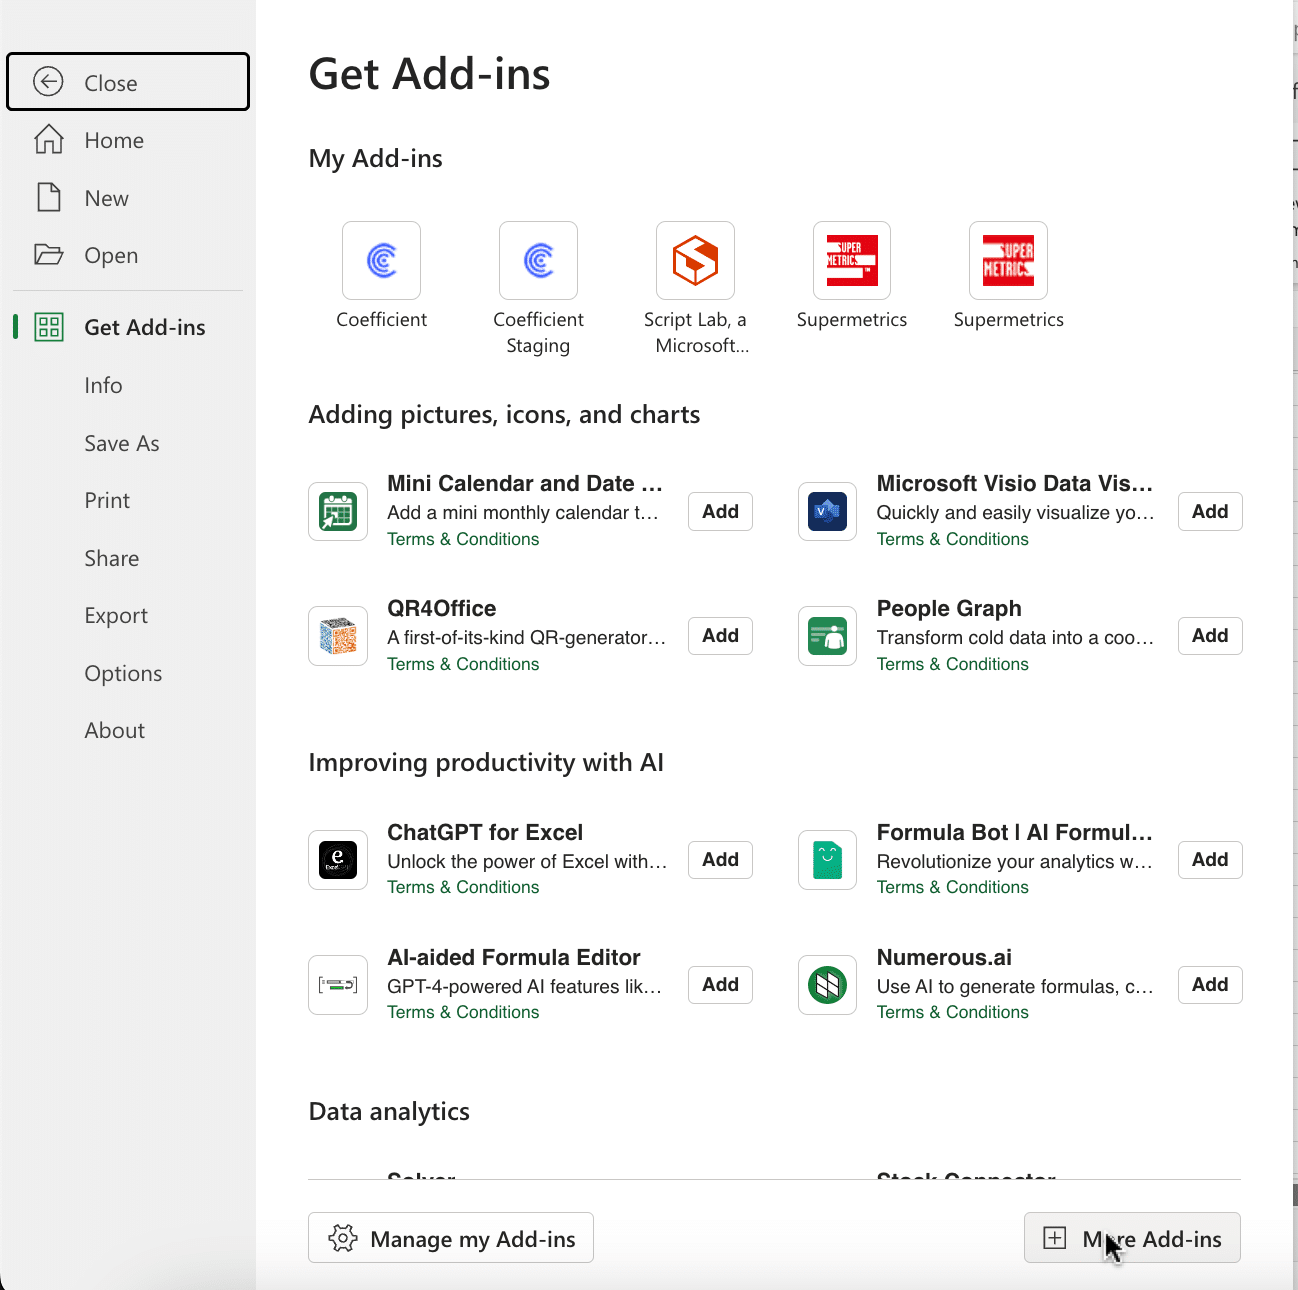
Click ‘File’ > ‘Get Add-ins’ > ‘More Add-Ins.’
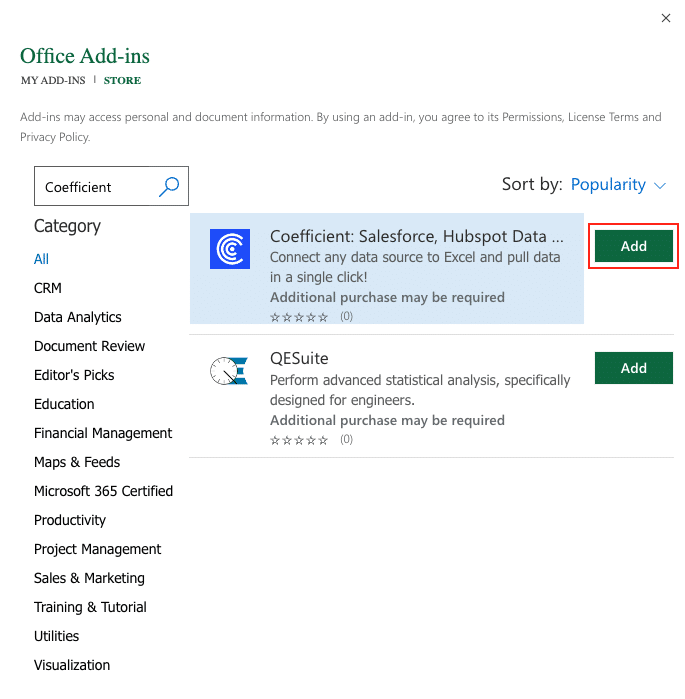
Type “Coefficient” in the search bar and click ‘Add.’
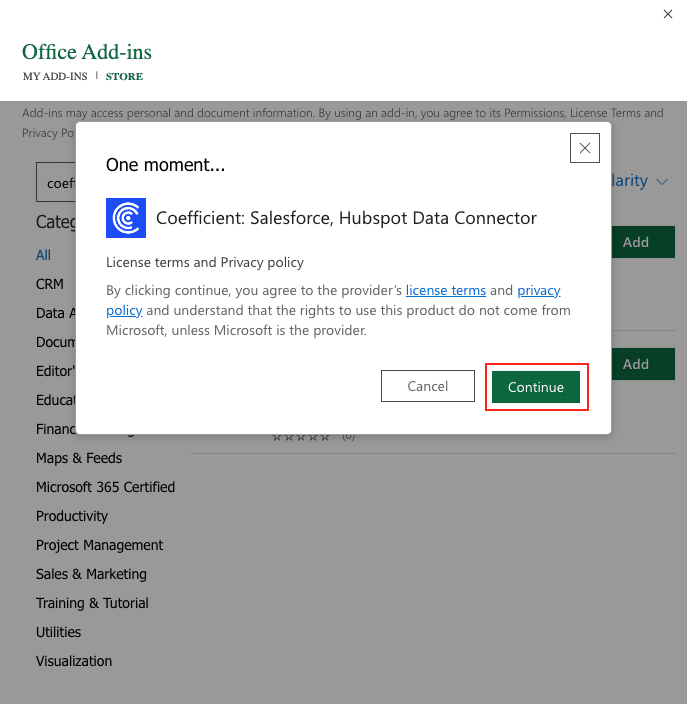
A pop-up will open up. Follow the prompts to complete the installation.
Once finished, you will see a “Coefficient” tab at the top navigation bar.
Click ‘Open Sidebar’ to launch Coefficient.
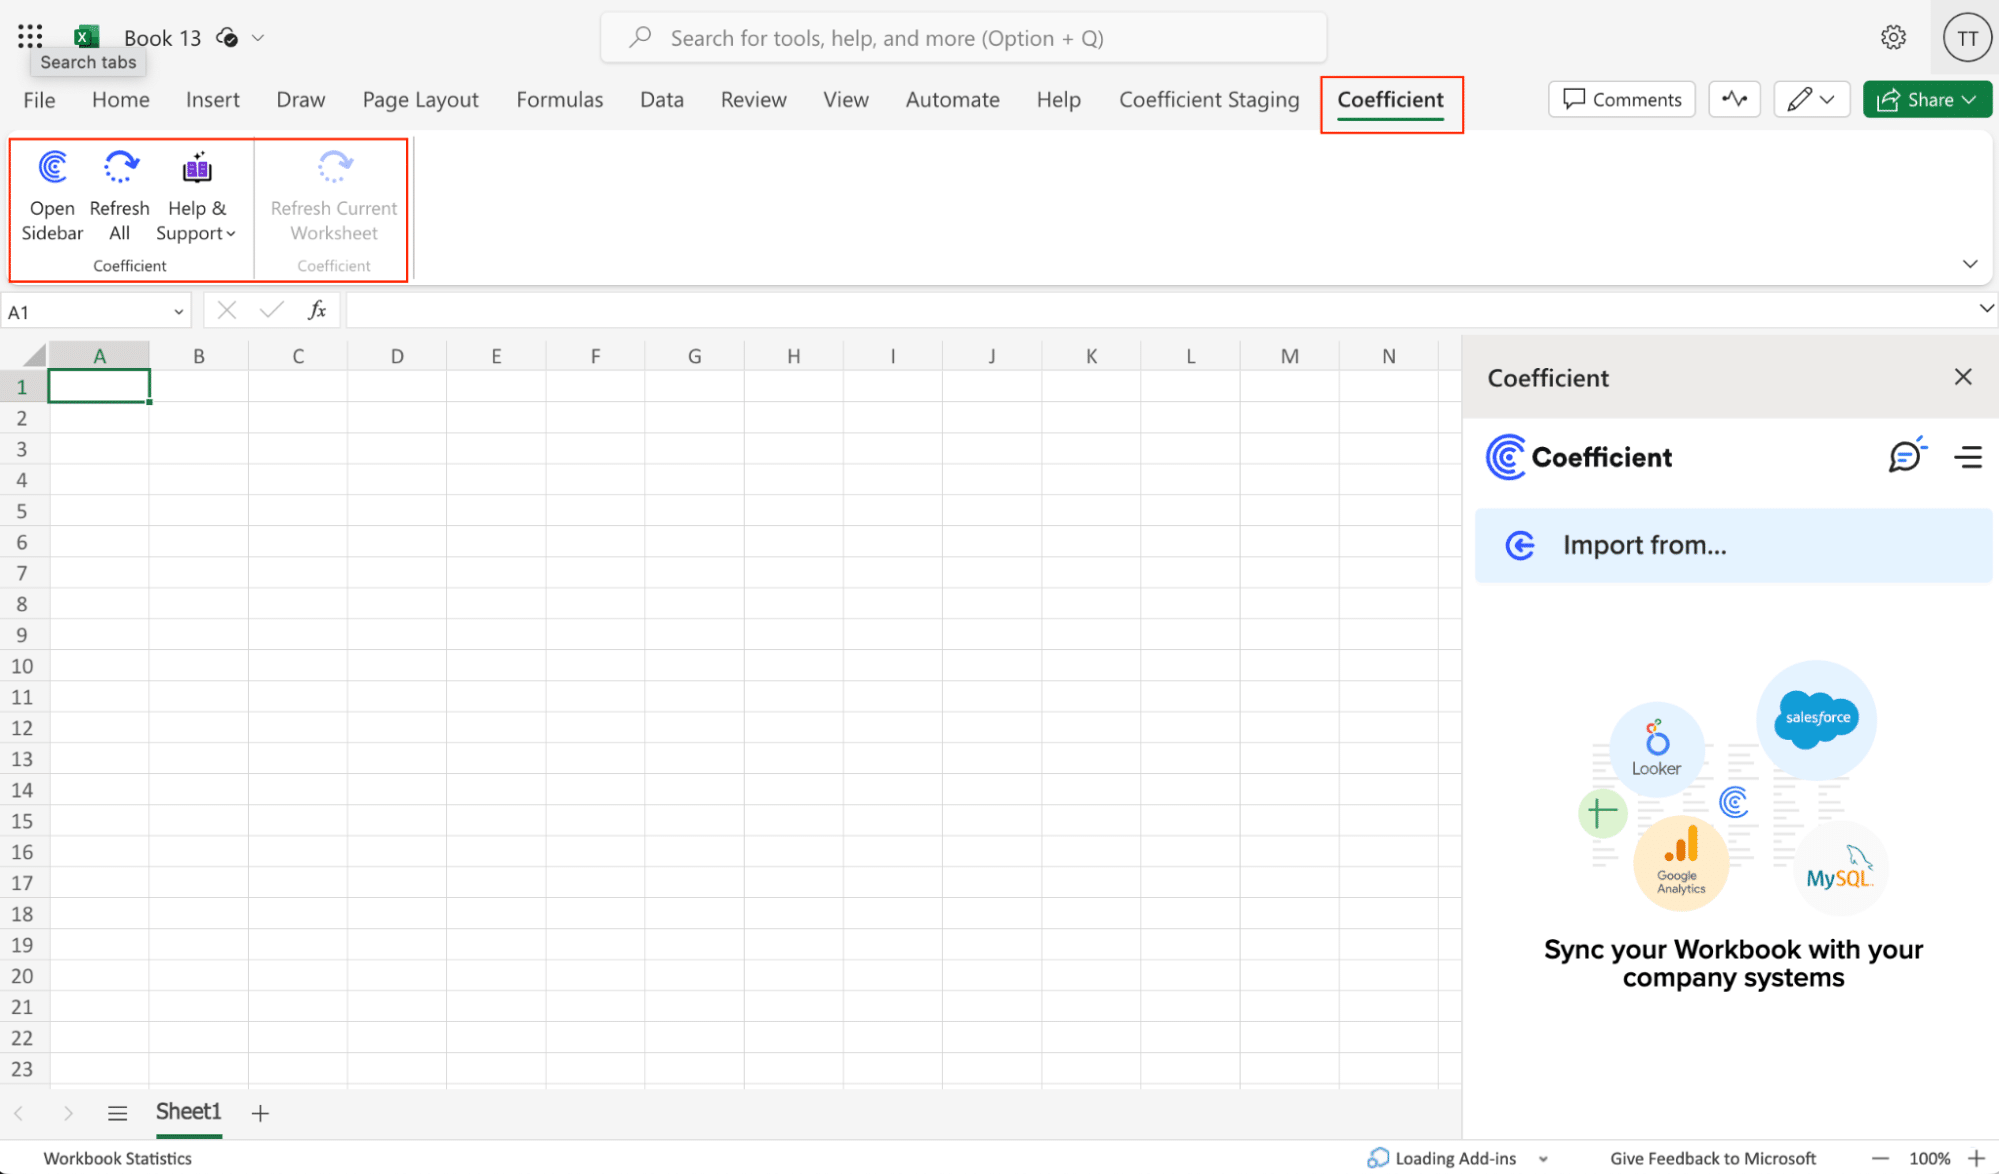
Select ‘Import from…’

Scroll down until you see Pipedrive and click ‘Connect.’

Follow the prompts to authorize Coefficient to access your Pipedrive account.

Enter your credentials to log in to your Pipedrive account. (if you are not already logged in)

You will then be redirected to a page allowing Coefficient to be installed for your user and company.
Click “Continue to the App” and start creating an import with your Pipedrive data.

After connecting, return to Pipedrive from the Coefficient menu ‘Import From…’ > ‘Pipedrive.’
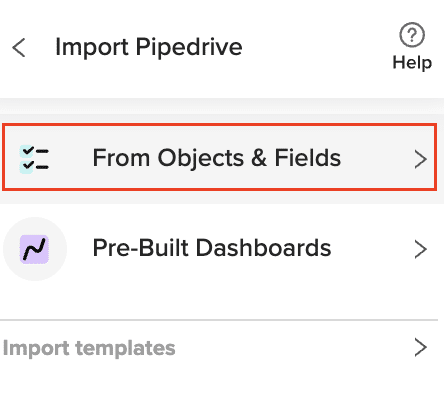
Click ‘From Objects & Fields.’
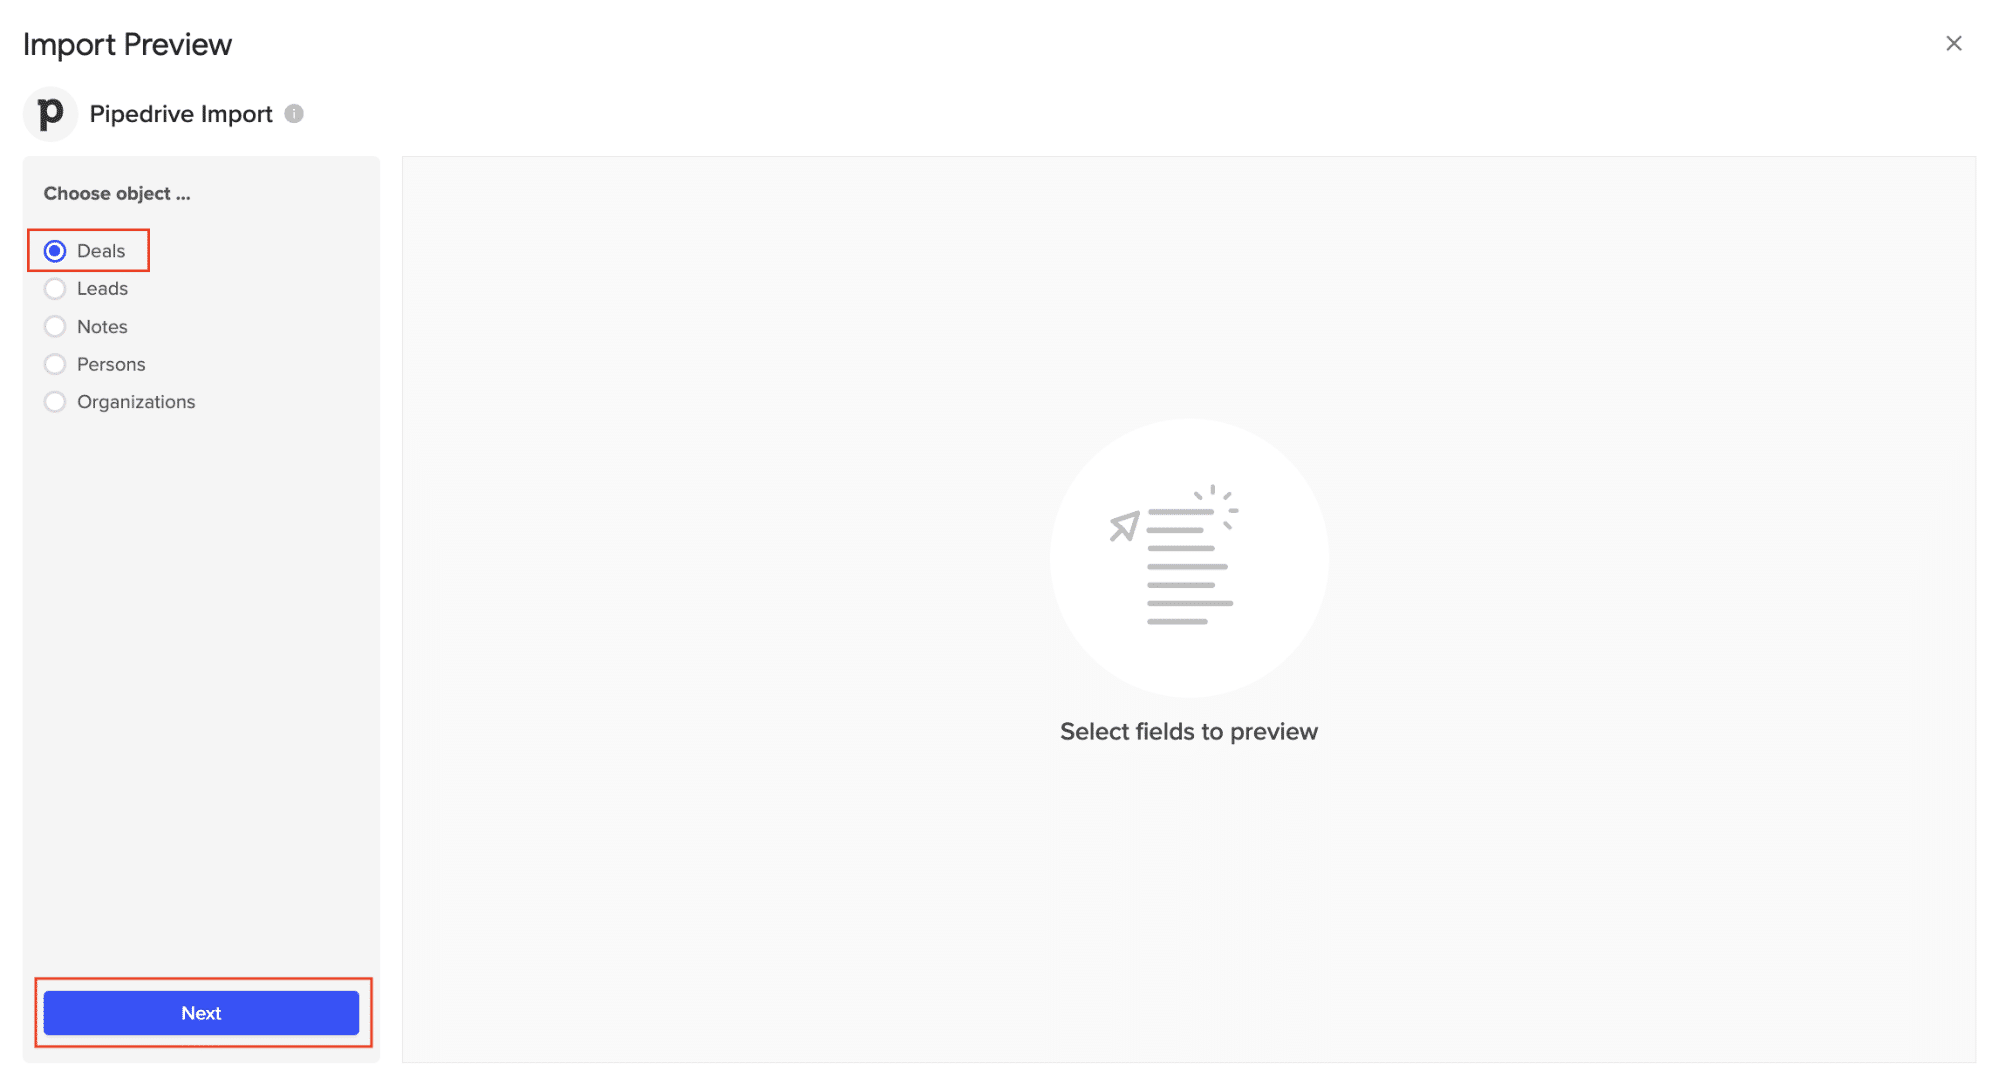
Select a Pipedrive object (eg. Deals) from the Import Preview window then hit ‘Next.’
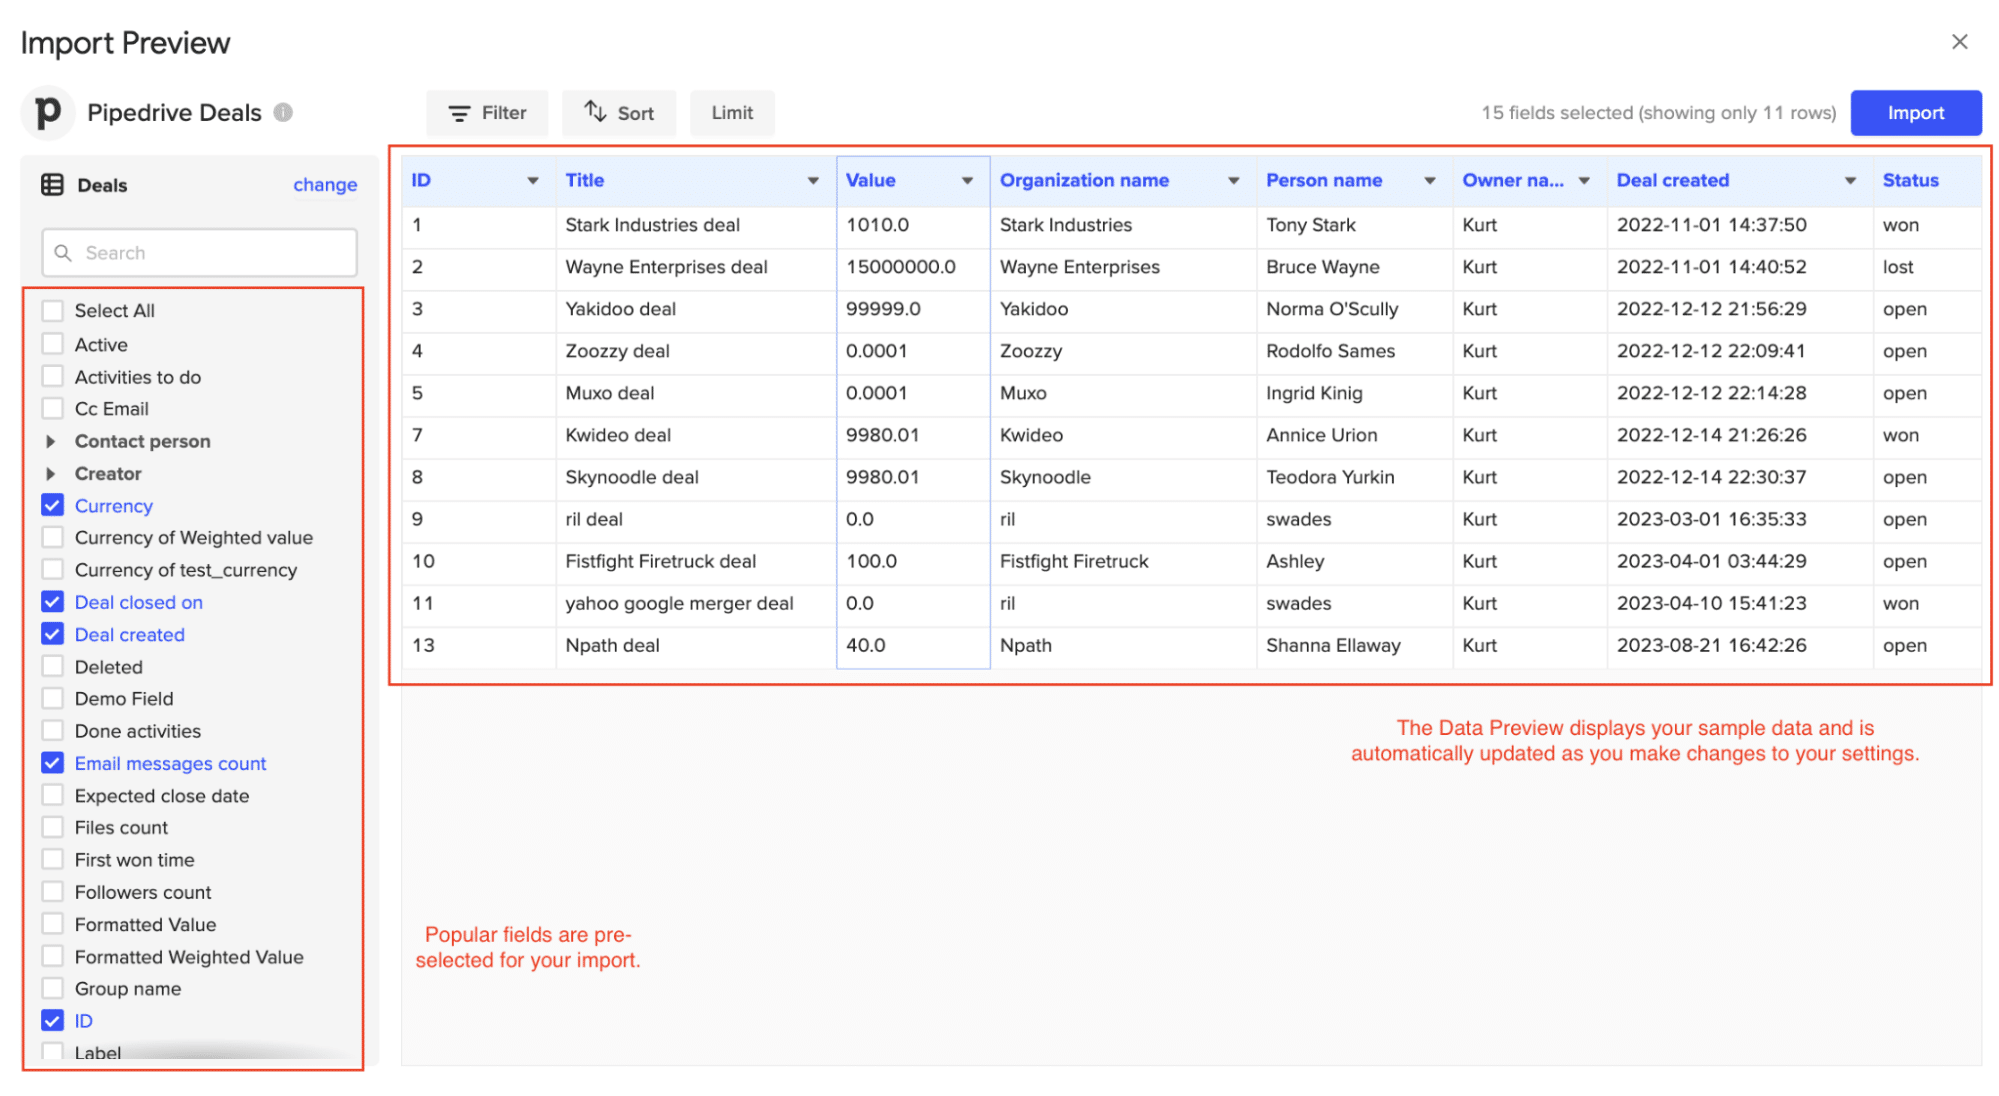
Check the box(es) corresponding to the fields you would like to include in this import. Some of the more popular fields may already be selected – you can uncheck them if you would like to exclude them from the import.
The data previewer on the right side of the screen should display the selected fields.
Under the “Filter” dropdown, you can select a ready-made filter, which will then be applied to the sample data in the preview. These filters are defined within Pipedrive and you can add/edit them directly in the Pipedrive UI.
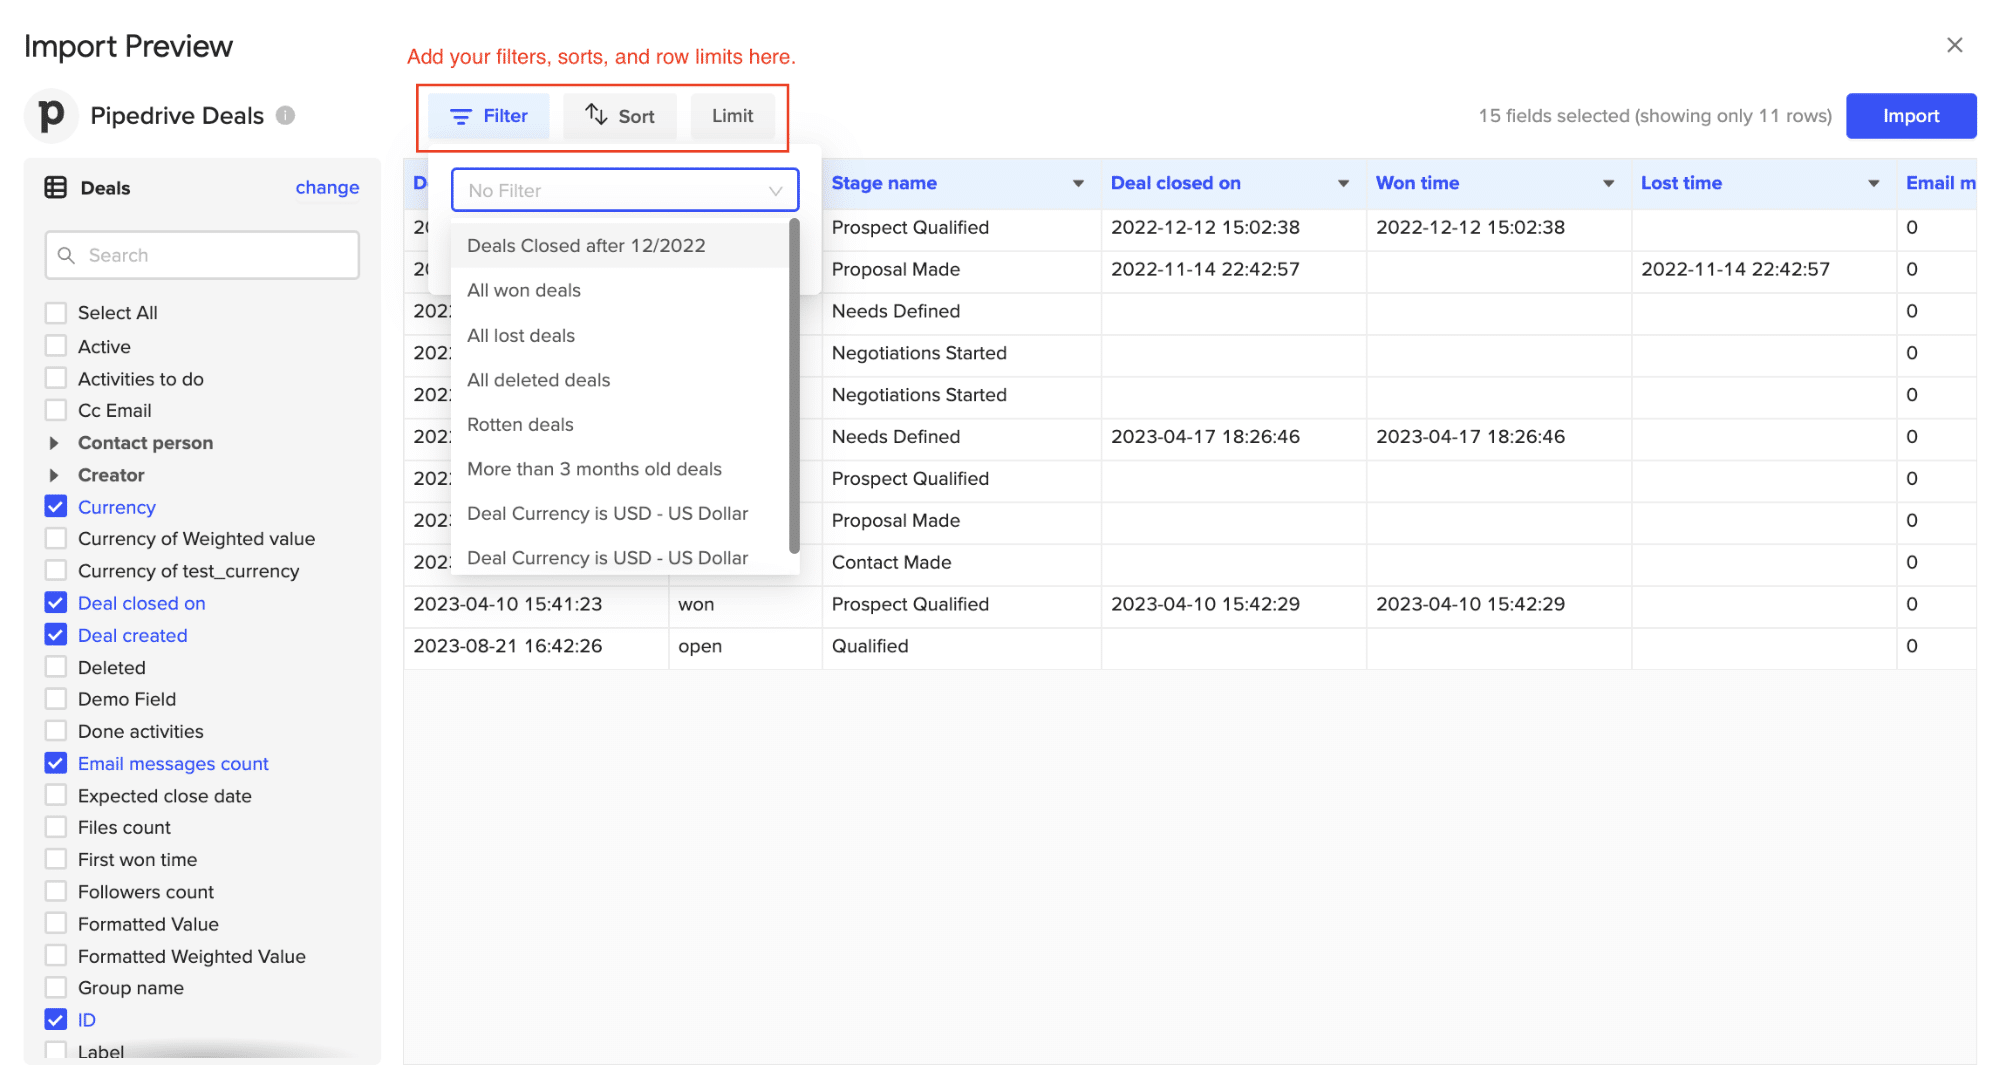
You can further customize your import adding sorts or limits as needed.
Click ‘Import’ on the top right of your screen when you’re finished.
Your Pipedrive data will automatically populate your Excel spreadsheet in a few seconds!

You can also set up automatic data updates to schedule data syncs between Pipedrive and Excel. Choose whether to run daily, hourly, or weekly automatic data updates.

Stop exporting data manually. Sync data from your business systems into Google Sheets or Excel with Coefficient and set it on a refresh schedule.

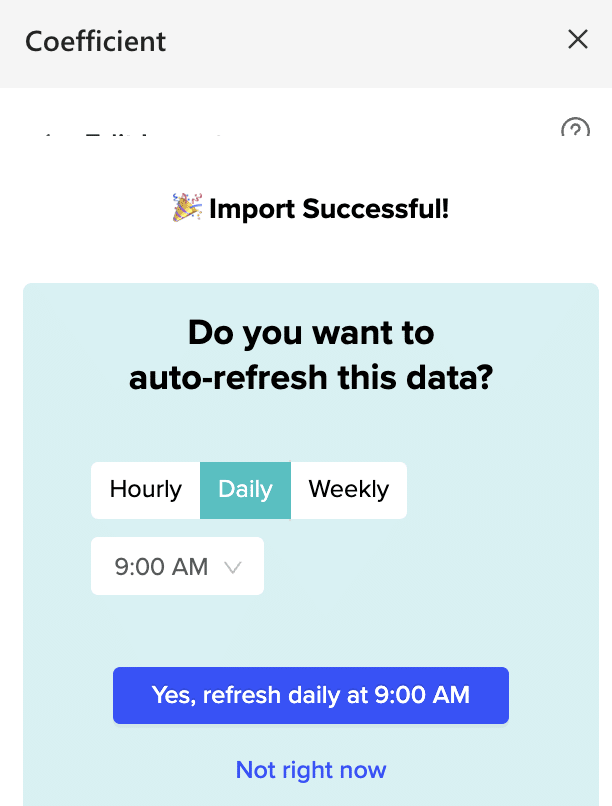
With automatic data updates, your Pipedrive data is always up-to-date in your spreadsheet. That means you can build live dashboards and reports on top of the data without performing cumbersome manual updates.
Pros and Cons:
- Pros:
- Cons: The only downside to Coefficient is that any scheduled automations are not free forever. However, its pricing plans are affordable, and its benefits far outweigh the app’s costs.
Method 2| Zapier
Zapier Integration Zapier is a web-based service that allows you to create automated workflows between different apps, including Pipedrive and Excel.
Here’s a step-by-step guide on how to set it up:
Log into your Zapier account. Click ‘+ Create’ > ‘New Zap.’

Choose Pipedrive as your trigger app and select the event that will trigger the workflow (e.g., New Report)
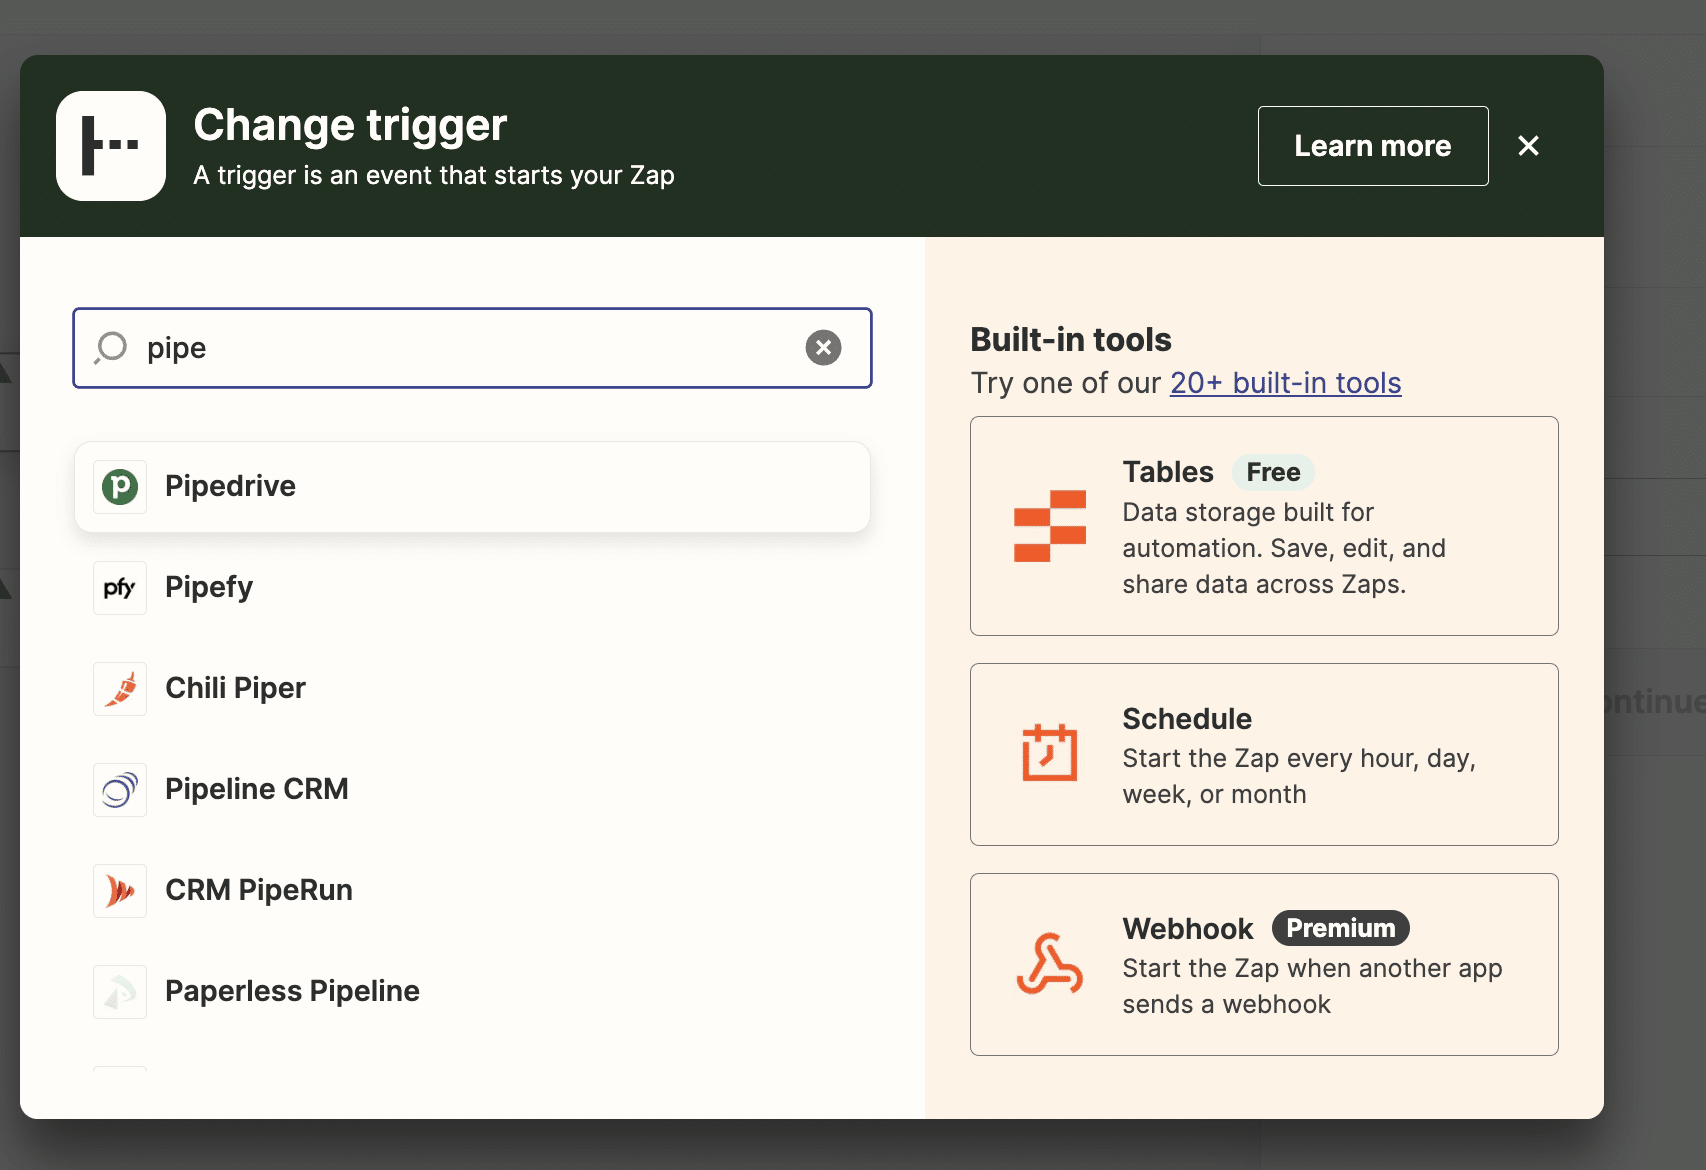
Choose Pipedrive as your trigger app and select the event that will trigger the workflow (e.g., New Report). Follow the prompts to connect your Pipedrive account to Zapier.
Connect your Pipedrive account to Zapier by providing your API key, following the steps above.
Choose Microsoft Excel Online as your action app.
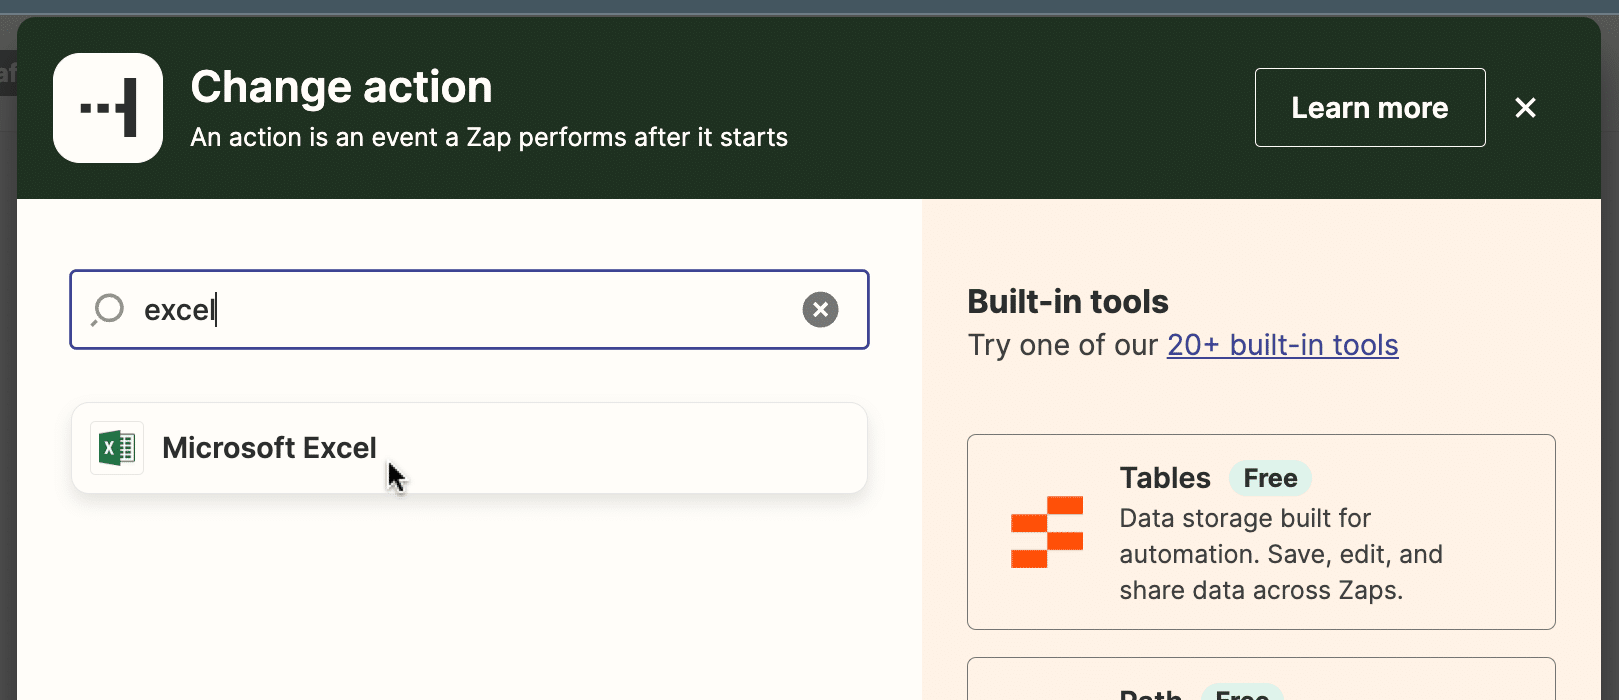
Select “Create Spreadsheet Row” as the action event.

Follow the prompts to connect your Microsoft account.

From here:
- Map the data fields from Pipedrive to the corresponding columns in your Excel spreadsheet.
- Test your Zap to ensure it’s working correctly.
- Turn on your Zap, and it will automatically add new Microsoft Ads data to your Excel spreadsheet as it comes in.
Pros:
- Automates data transfer between Pipedrive and Excel
- No coding required
- Flexible trigger options (daily, weekly, monthly)
Cons:
- Requires a Zapier subscription for more advanced features and higher volume of tasks
- May have some limitations in terms of customization compared to the API method
- Dependent on Zapier’s platform stability and performance
Take the Leap with Pipedrive Microsoft Excel Integration
By integrating Pipedrive with Excel, you can take your data analysis to the next level. With tools like Coefficient, the process is easier than ever – even if you don’t have coding skills.
Ready to get started? Try Coefficient for free today and see how easy it is to unlock the power of your Pipedrive data in Excel.
Try it for free!


