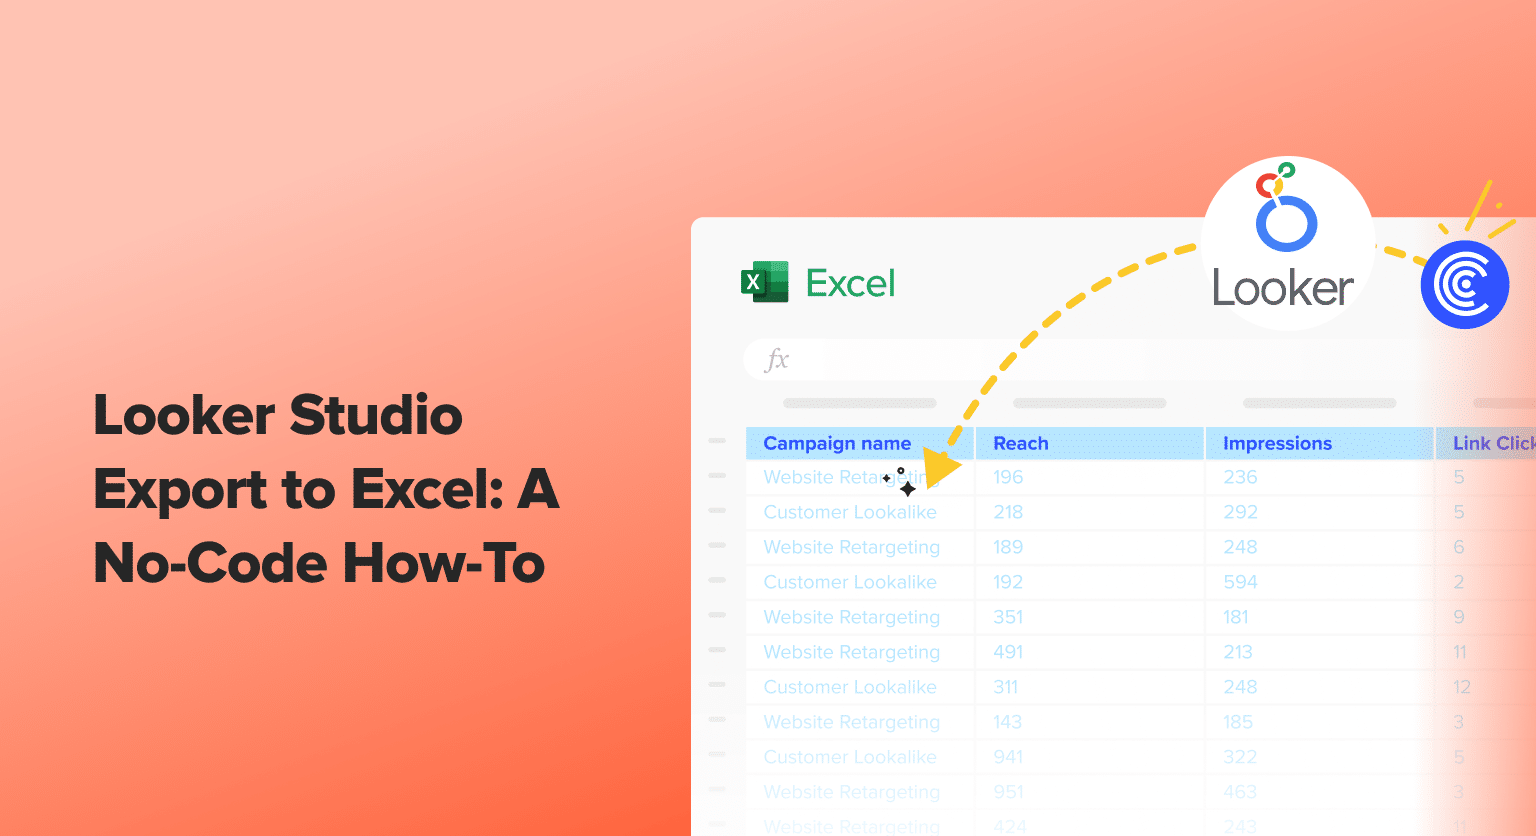
Read the following guide to learn how to export data from Looker Studio data to Excel easily.
While Looker Studio delivers cutting-edge BI solutions for intricate data analysis, accessing and manipulating this data directly within Excel remains a challenge for many SalesOps teams.
Fortunately, there’s a smoother path to integrate Looker data into Excel, bypassing manual data conversion and enhancing your analytical capabilities.
This guide will explore three: Coefficient, Manually, and with Office Scripts.
Looker Studio Export to Excel: Why do It?
Can Looker Connect to Excel? Absolutely.
With the Looker Excel plugin, integrating Looker data into Excel becomes straightforward. This connection transforms how go-to-market professionals analyze and leverage their data for strategic decision-making.
Looker Excel capabilities enable simpler access to vital KPIs, directly within Excel. This bypasses the manual, error-prone process of data transfer, enhancing accuracy and efficiency.
The Looker Export to Excel feature streamlines data manipulation, allowing teams to focus more on strategy and less on data management challenges.
How to Export Data from Looker Studio to Excel: Top Methods
Method 1: Coefficient
Coefficient is by far the fastest and easier way to export Looker Studio data to Excel, especially for Excel for Web users who are locked out of Power Query.
Coefficient features a user-friendly interface alongside a no-code approach. This allows even those with minimal experience in advanced data tools to effortlessly connect Looker Studio to Excel.
To install Coefficient, open Excel from your desktop or in Office Online.
Click ‘File’ > ‘Get Add-ins’ > ‘More Add-Ins.’
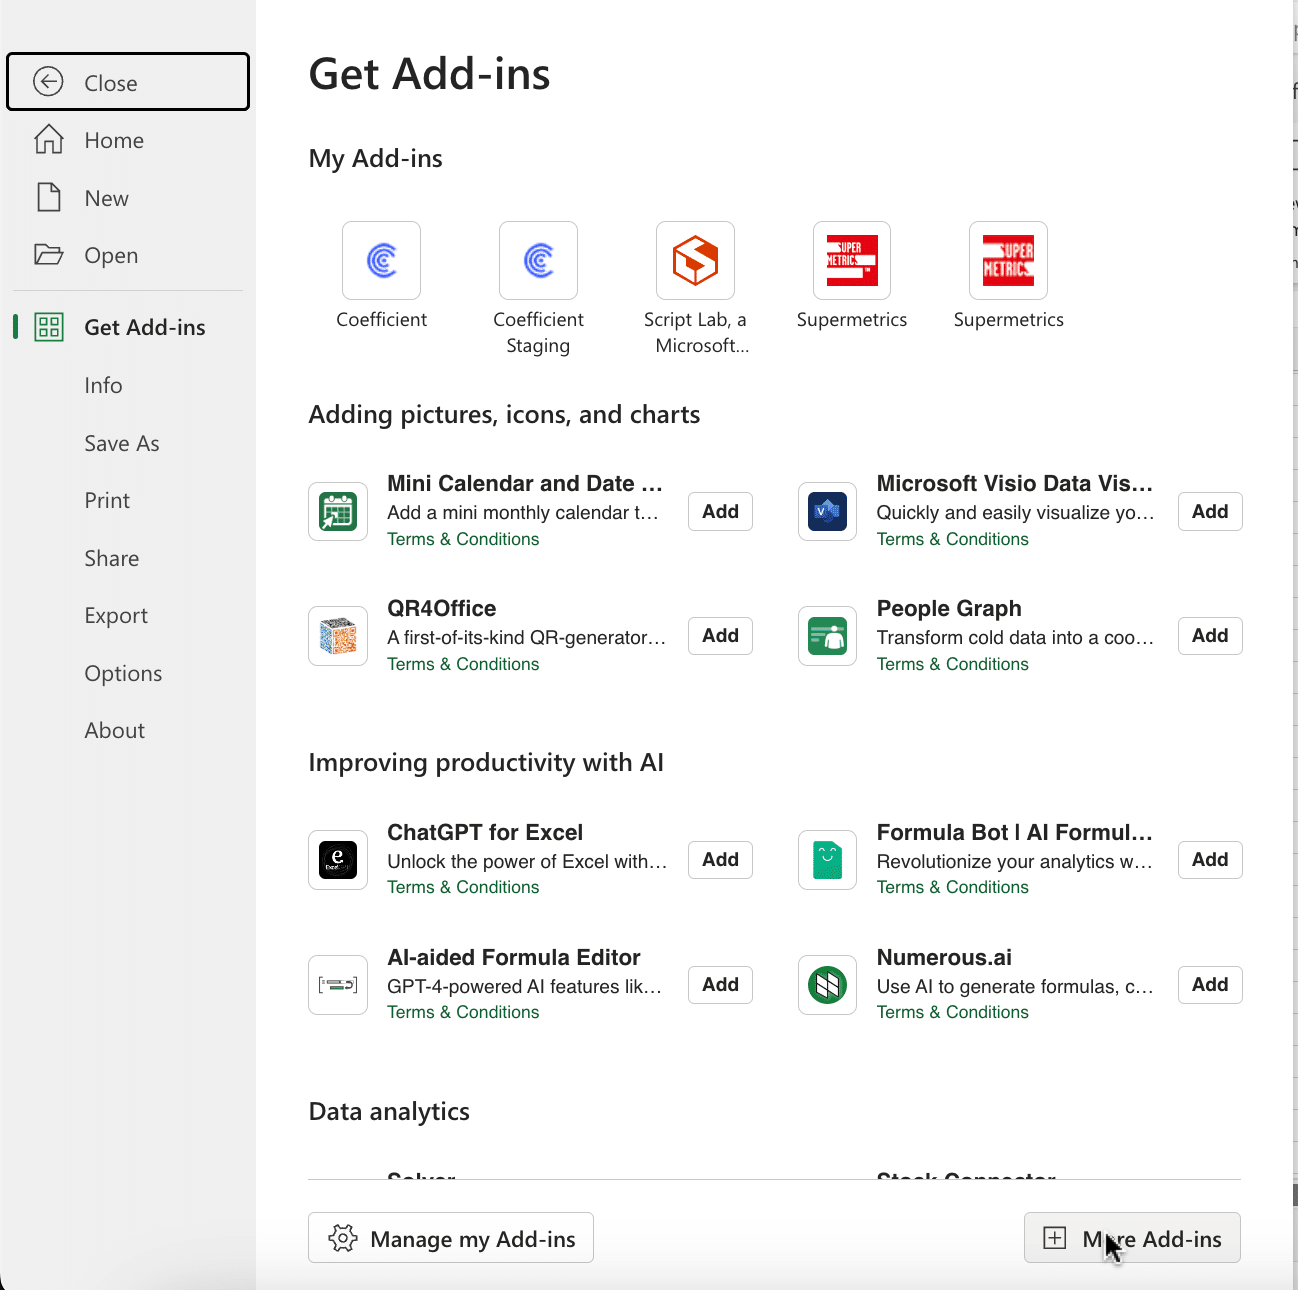
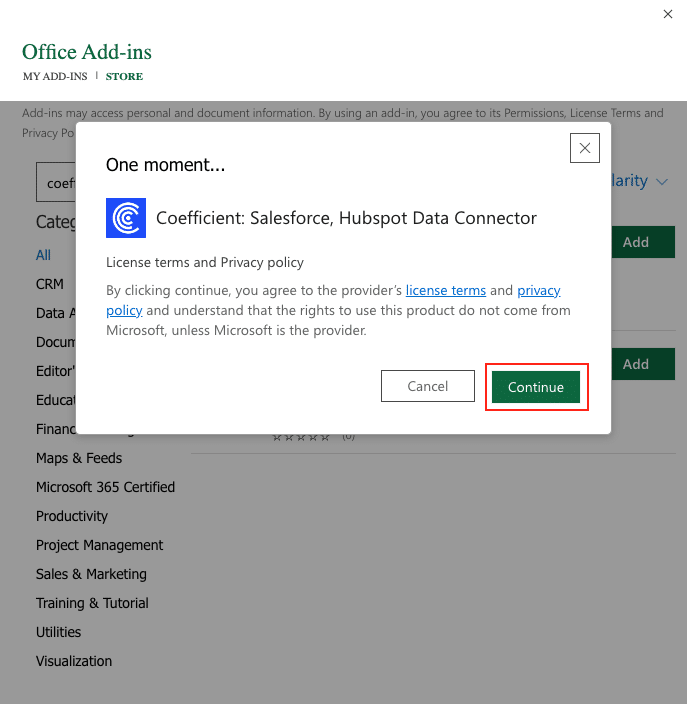
Type “Coefficient” in the search bar and click ‘Add.’
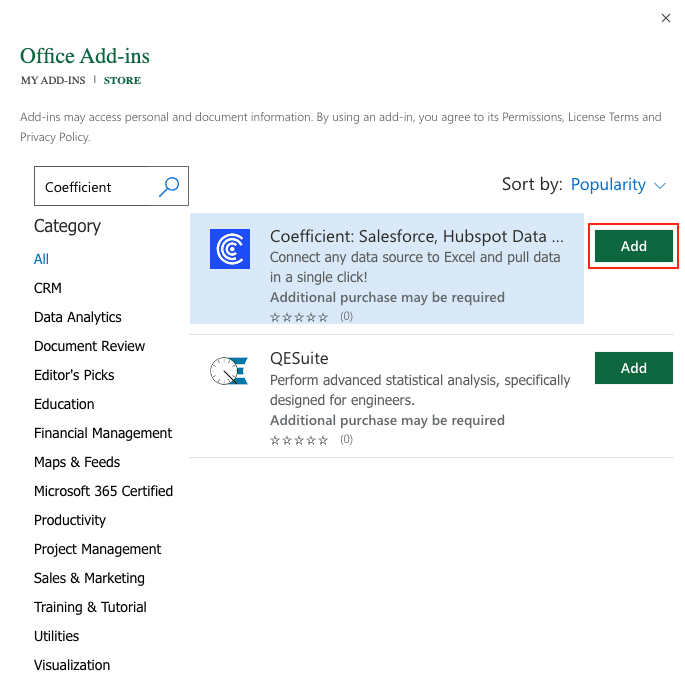
A pop-up will open up. Follow the prompts to complete the installation.
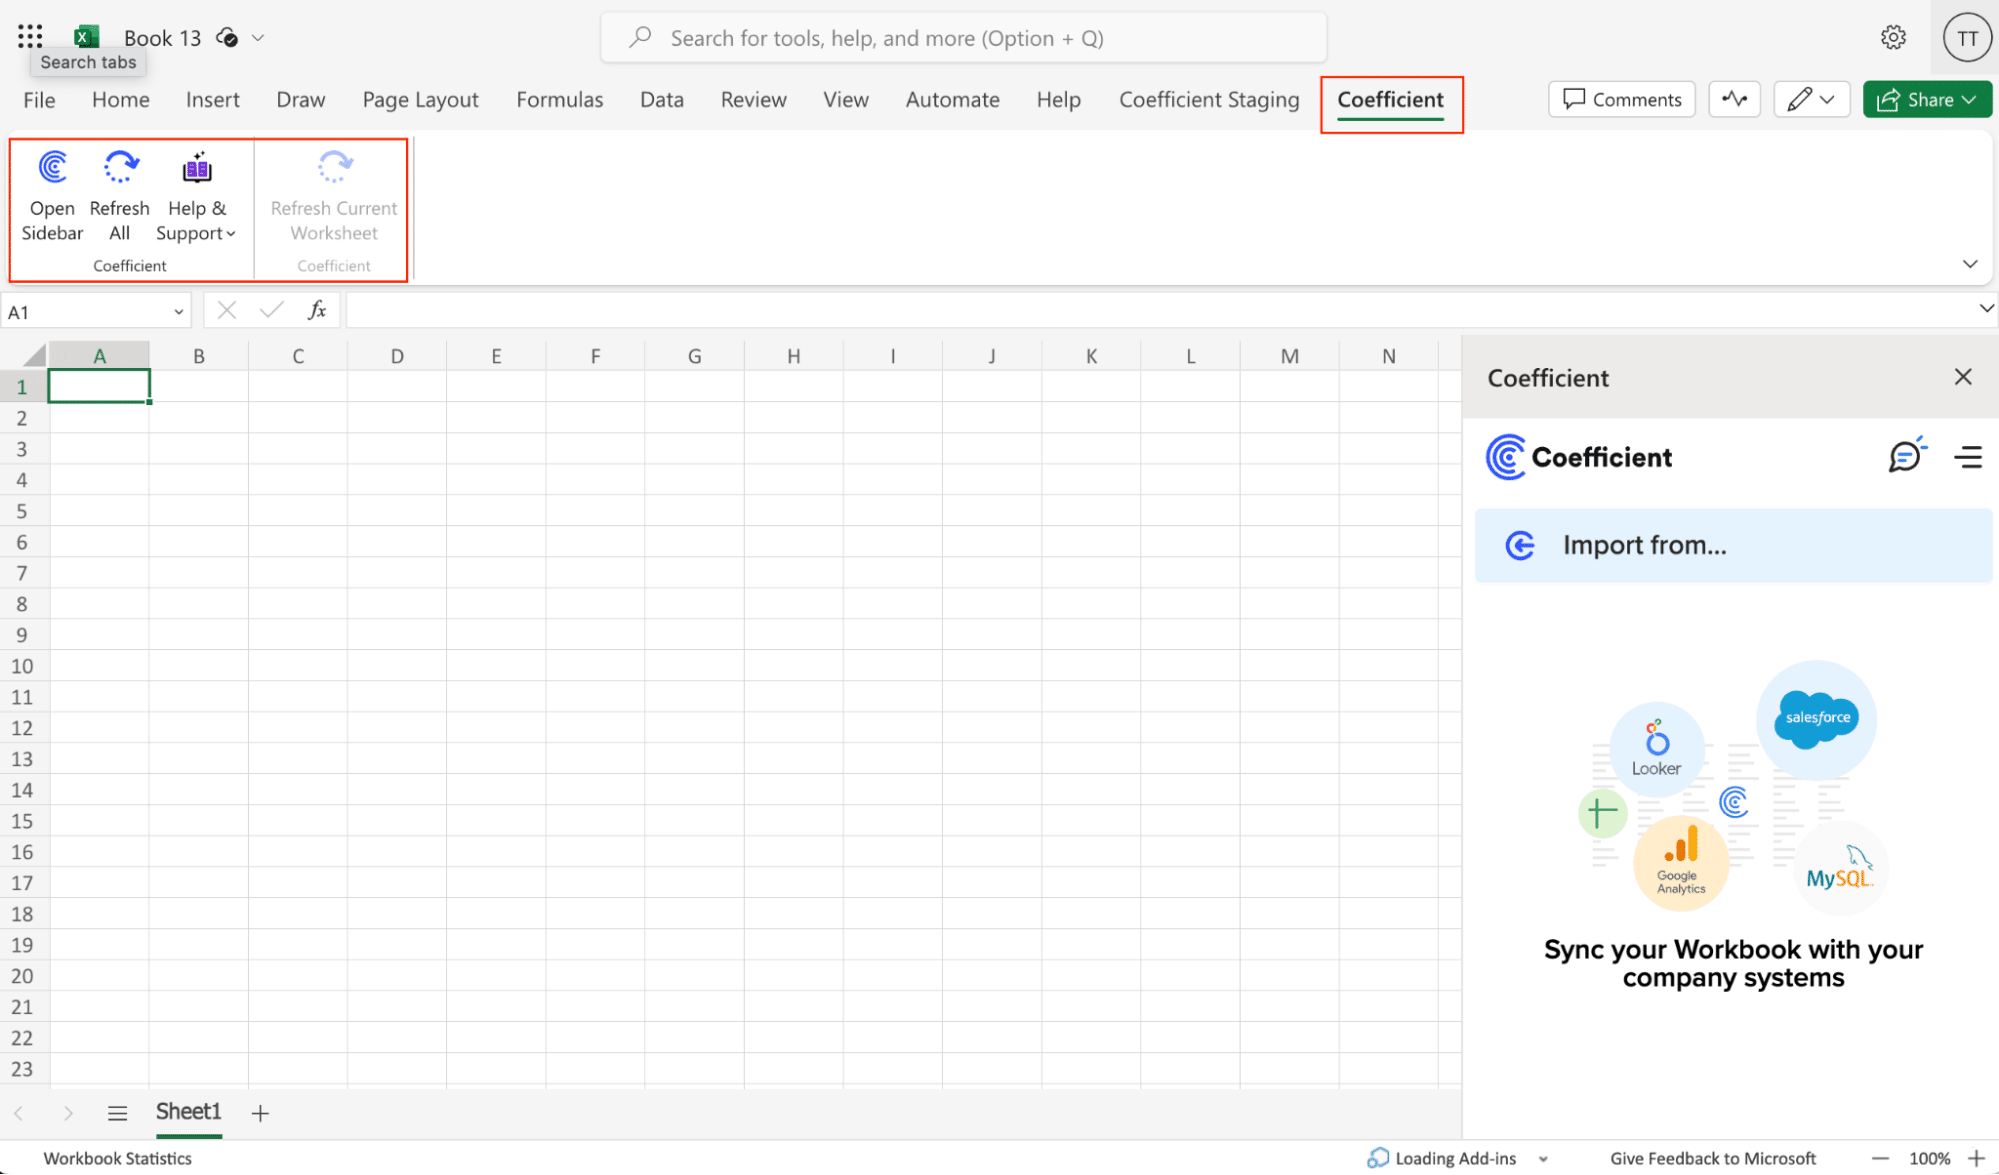
Once finished, you will see a “Coefficient” tab at the top navigation bar.
Click ‘Open Sidebar’ to launch Coefficient.
Select ‘Import from…’
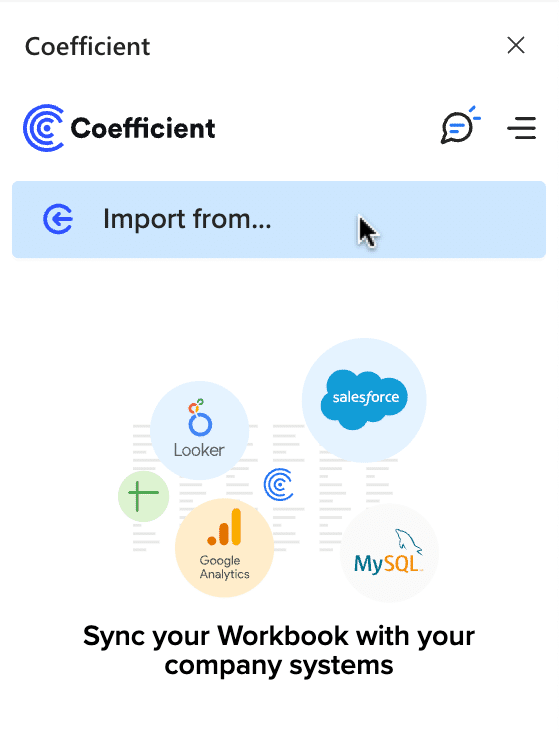
Scroll down until you find Looker in the menu.

Enter the URL you use to access your Looker account in the first field. You can find this URL by copying your organization’s Looker login page web address.
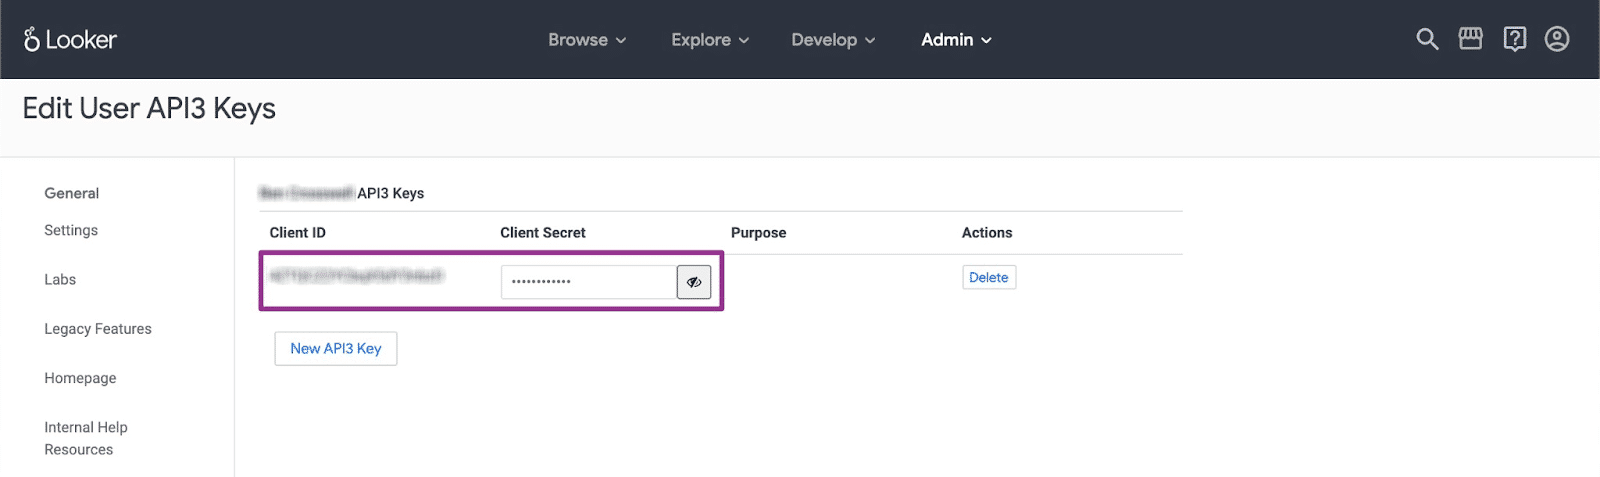
The Client ID and Client Secret appear in the admin panel of Looker. You might need to request those rights from your Looker admin.

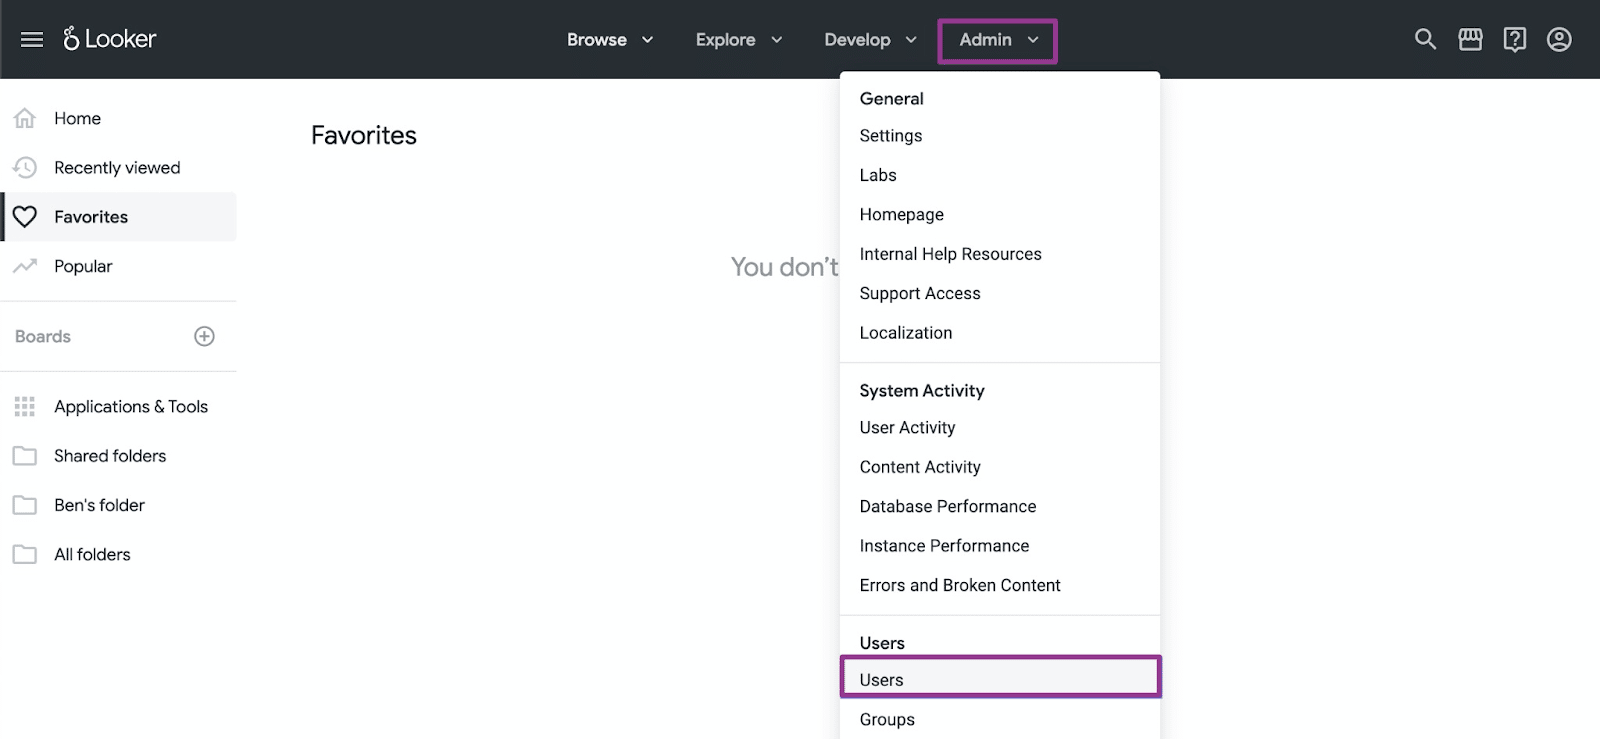
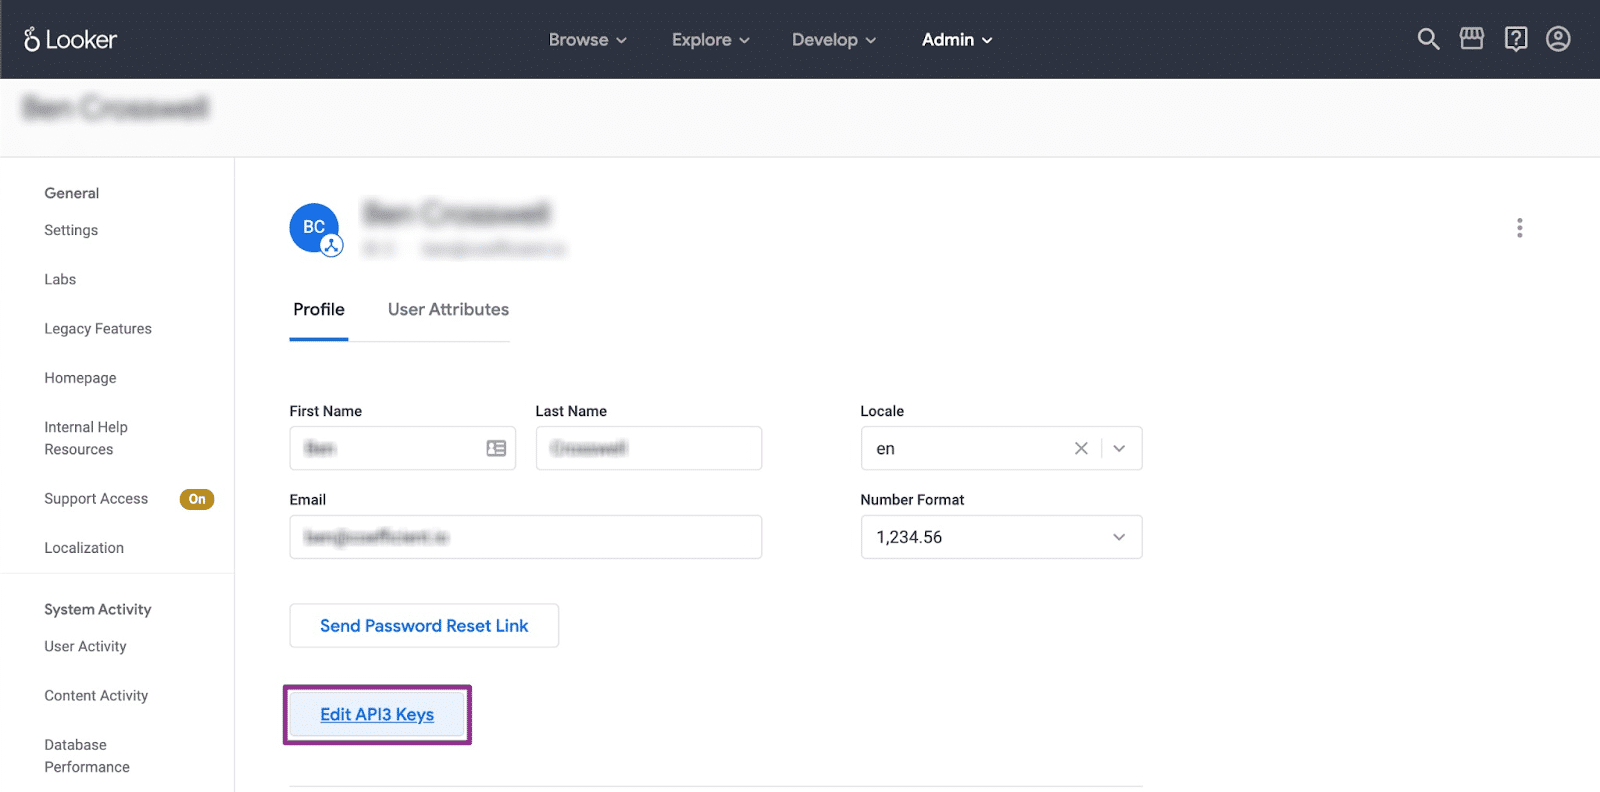
In Looker, navigate to the Admin section and click Users from the dropdown list.
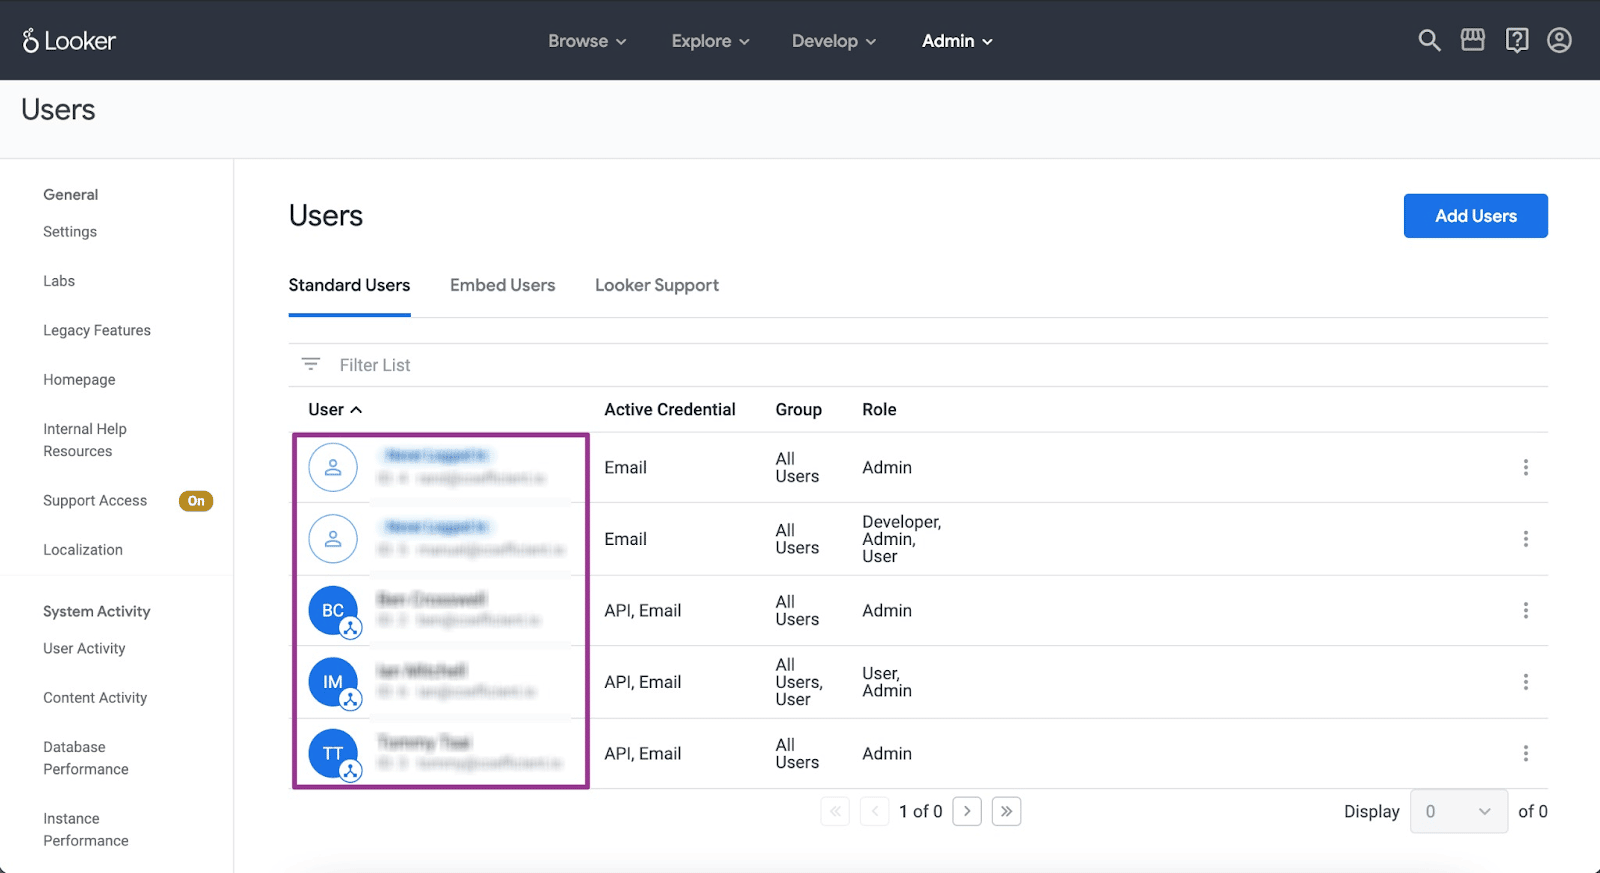
Select the appropriate Looker user.
Click Edit API3 Keys at the bottom of the user detail page.
Then copy the Client ID and Client Secret details. Paste them on the required fields in Coefficient’s side panel menu in Excel.
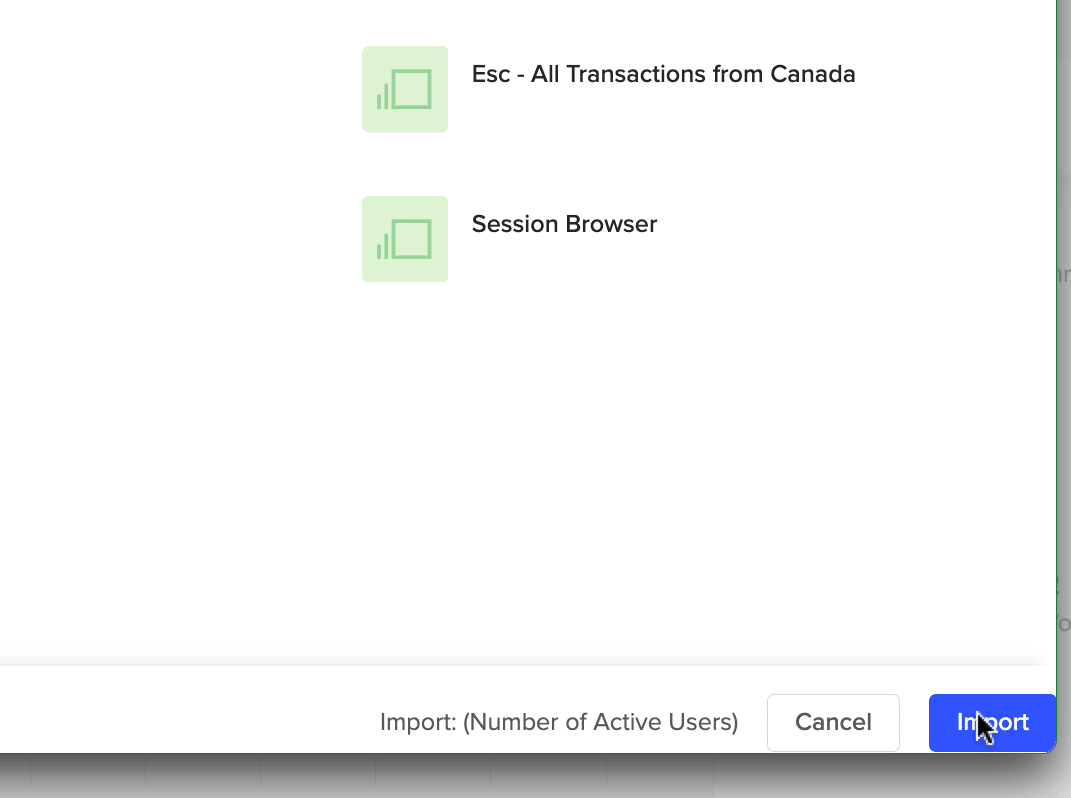
You’ll see a popup window that contains your available dashboards’ folder structure. This includes a navigation and search bar to help you find everything easily.
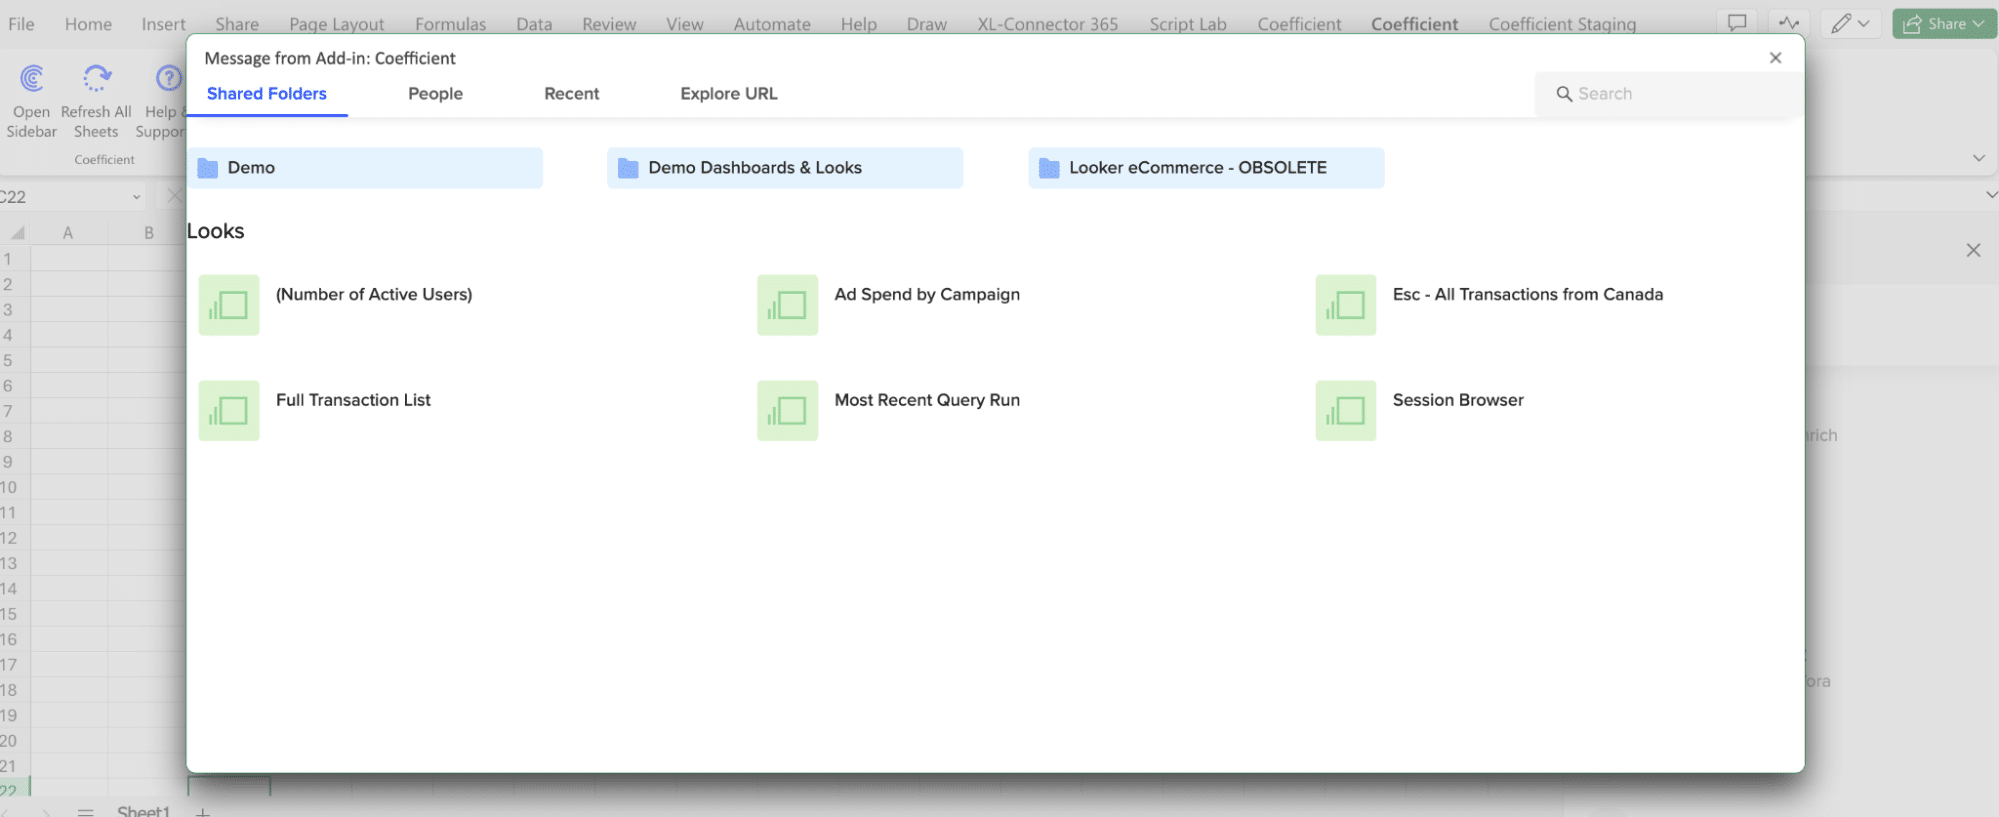
Now select the dashboard you want to pull into Excel.
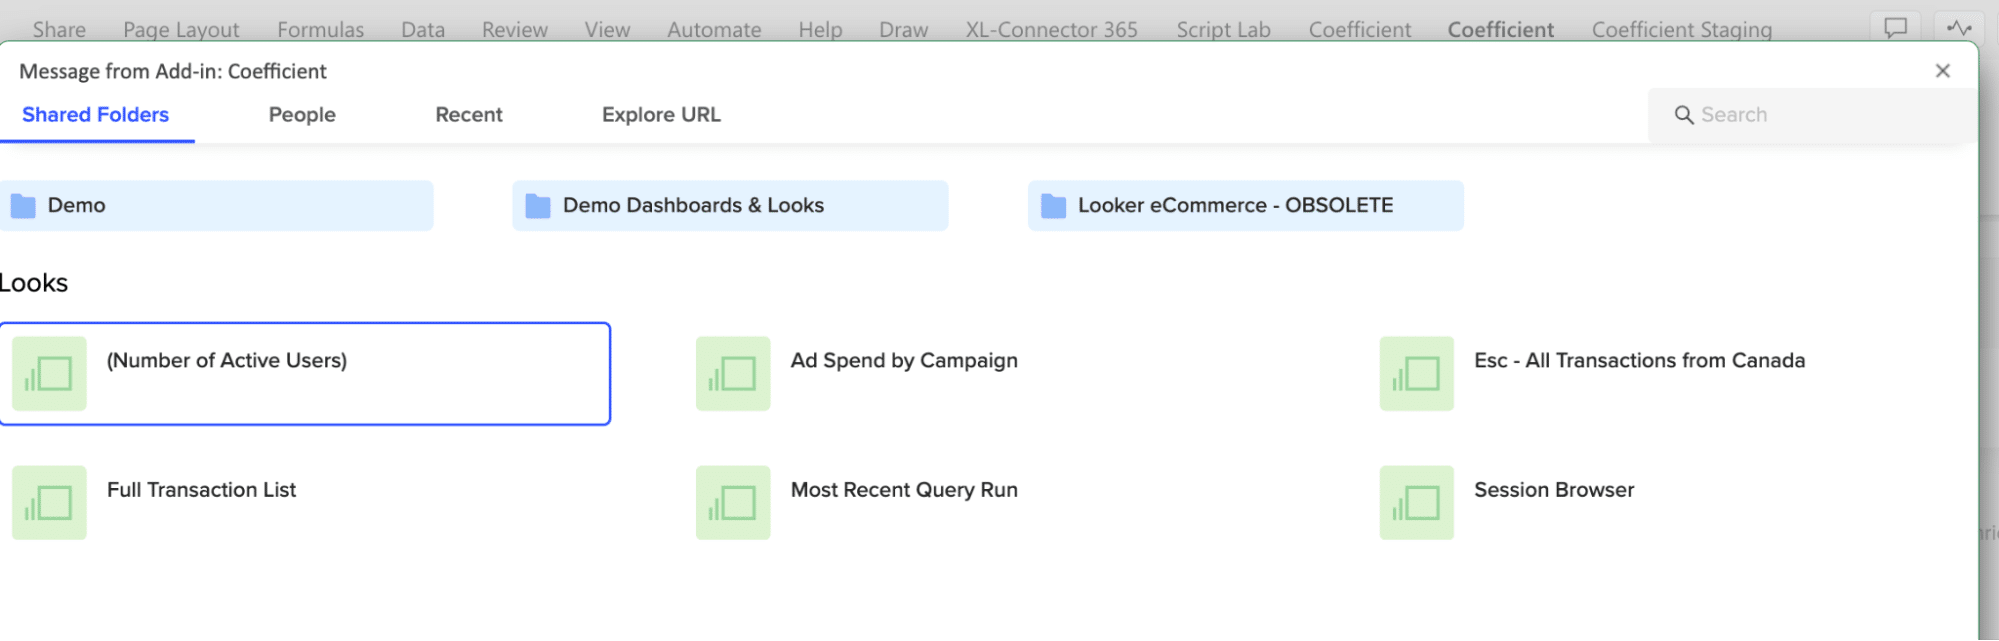
Click the Import button when you’re done.
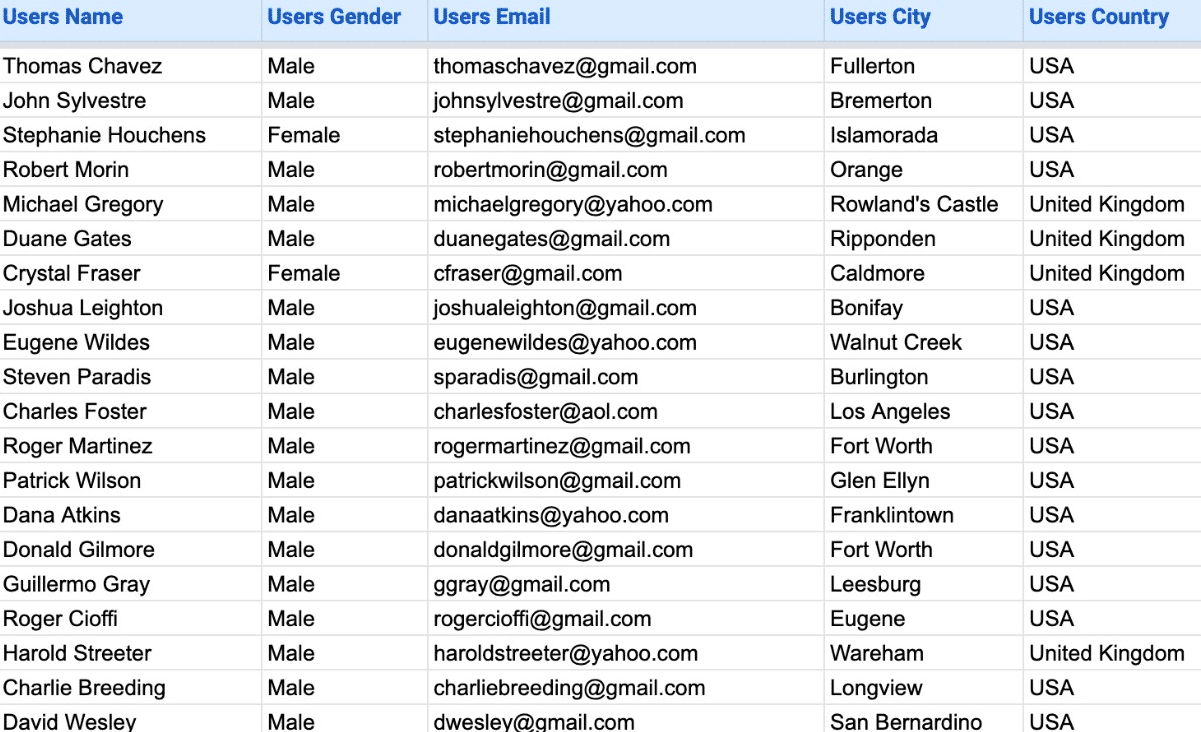
Coefficient will pull your Looker data into Excel instantly.
You can also set up automatic data updates to schedule data syncs between Looker and Excel. Choose whether to run daily, hourly, or weekly automatic data updates.
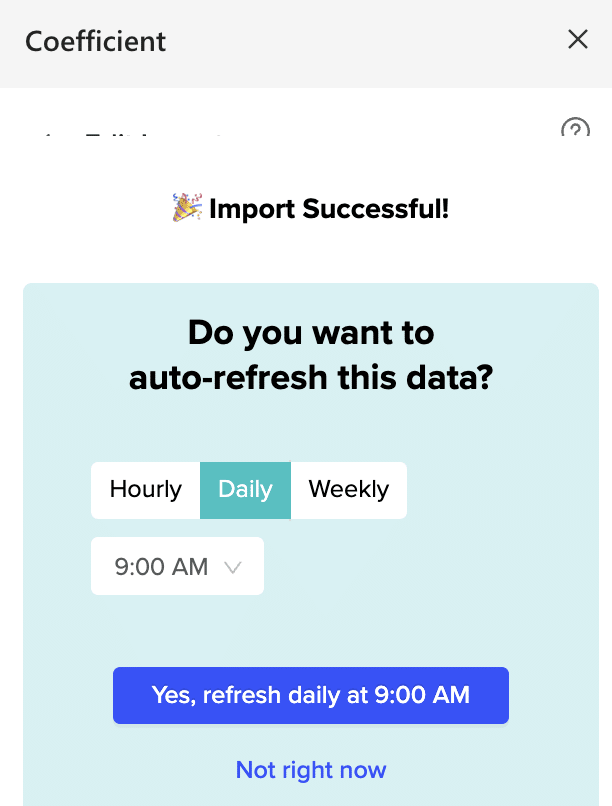
With automatic data updates, your Looker data is always up-to-date in your spreadsheet. That means you can build live dashboards and reports on top of the data without performing cumbersome manual updates.
Method 2: The Built-in Export Feature
You can extract data from Looker by downloading it as a CSV file. There are several different ways to do this.
Note: You need the download_without_limit or download_with_limit permission from a Looker admin to download content.
The Looker data download process depends on what part of Looker you’re using. You can download data from a Look or an Explore, dashboard, legacy dashboard, or a merged results query.
Exporting Data from a Look or an Explore
Here’s how to export data from a Look or an Explore.
Download the data by clicking the gear menu icon (upper right) on an Explore or Look page.
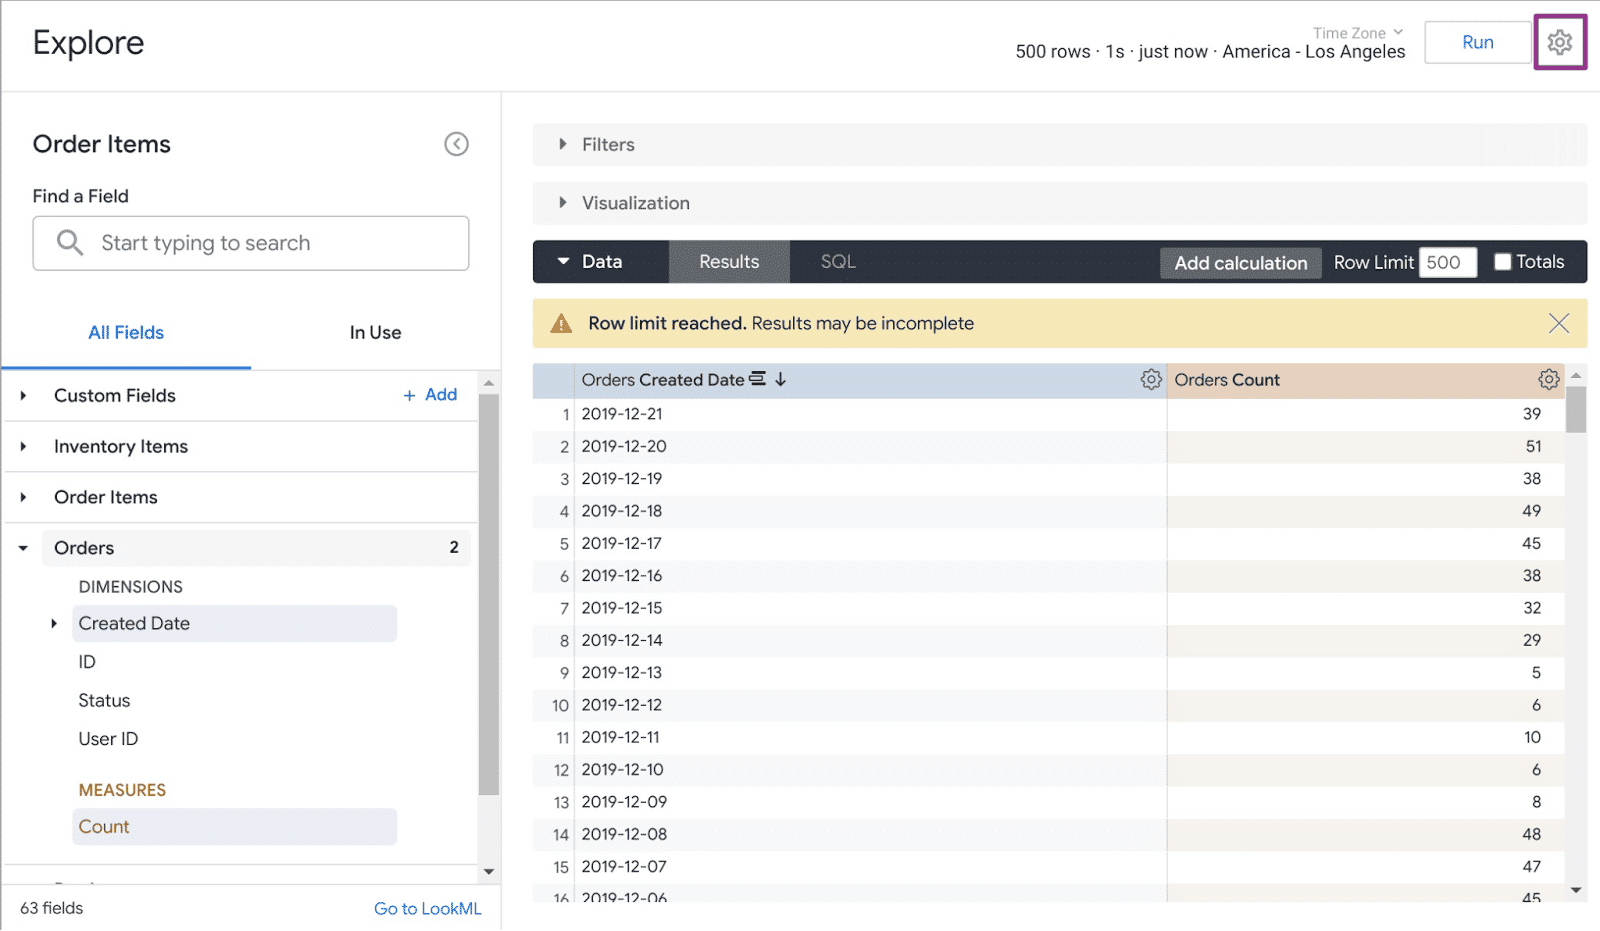
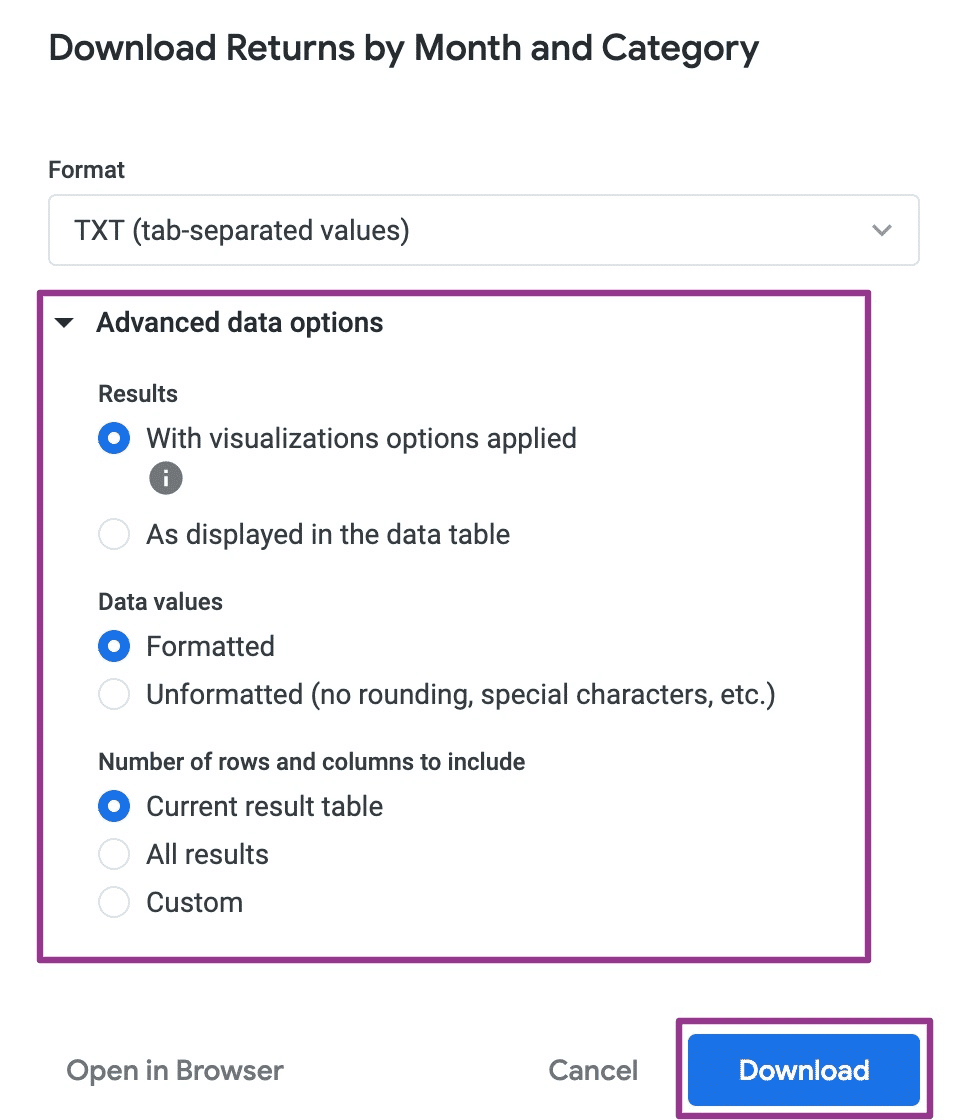
Click Download to open the Download window. Then name and format your download.
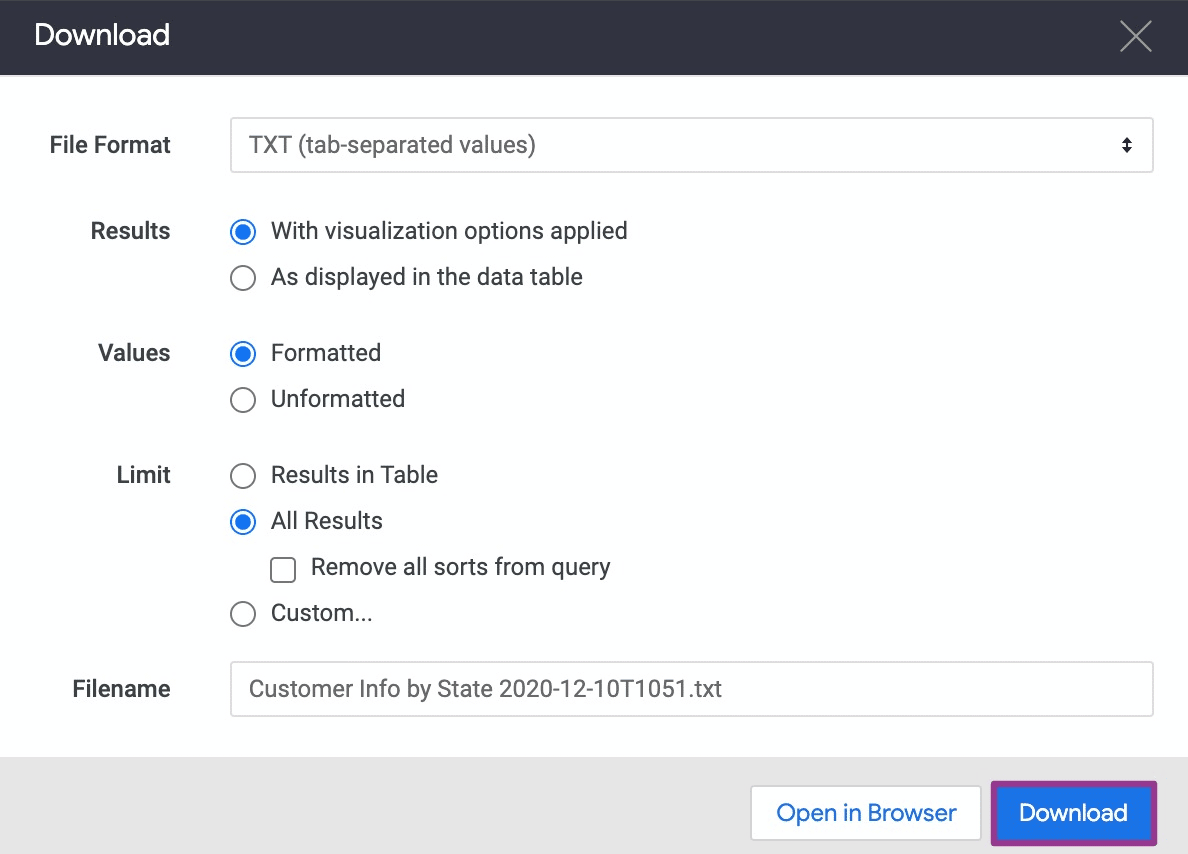
The following is a quick rundown of each field in the Download window:
- File Format. Looker lets you download data from Explores and Looks in TXT, JSON, Markdown, HTML, Excel spreadsheet, PNG (visualization image), and CSV file formats. SalesOps managers often download CSV files to copy-and-paste the data into their spreadsheets.
- Results. Select whether you want visualization or data table settings to apply to your data download.
- Limits. Choose how much data you want to download. You can specify a custom number of rows to extract. The row limit is 5,000 rows for users with download_with_limit permissions and 100,00 rows for other users.
- Filename. Use the pre-populated filename or create one for your download. Looker automatically appends the corresponding file extension.
After setting your preferences, click Open in Browser to view your download in-browser or Download to save the CSV file.
Extracting Data from a Merged Results Query
You can save your merged results queries to a dashboard and download it in PDF format or as a collection of CSV files.
However, you can’t download the data from only a single tile based on a merged results query. Instead, you’ll need to download the entire dashboard.
This option, in other words, doesn’t give you much flexibility to download only the Looker data you need.
Extracting Data from a Looker Dashboard
To download dashboards that use the new dashboard experience, click the three-dot menu and select Dashboard.
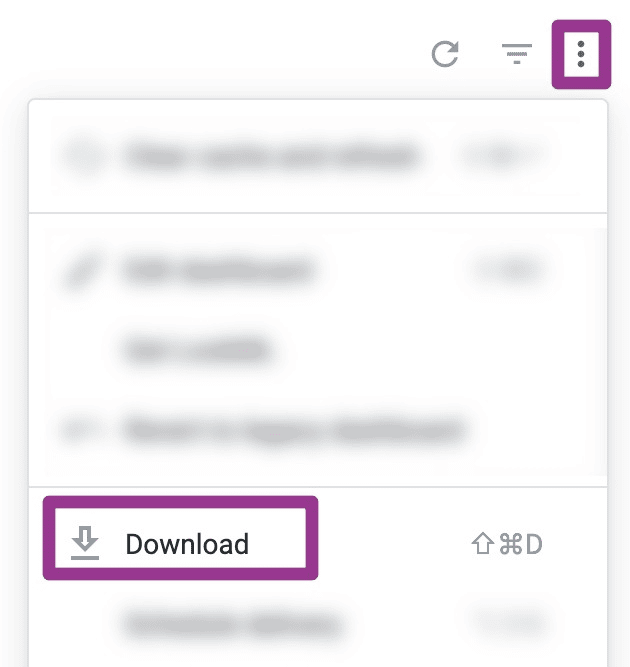
You will see the dialog box that allows you to choose PDF or CSV as your download file format.
Looker lets you download all your dashboard’s query tiles as a zipped collection of CSV files, excluding text tiles.
Here’s how you can do it:
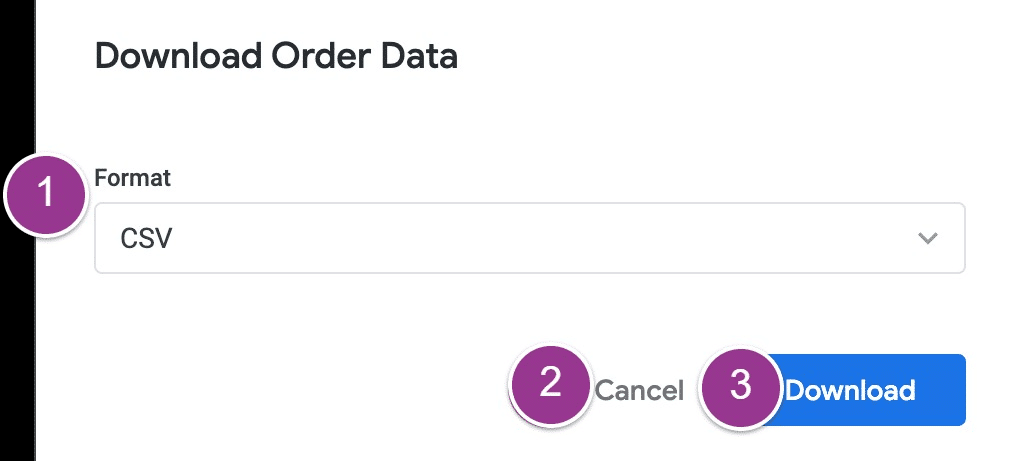
- Choose CSV from the Format menu
- Select Download to start downloading your zipped CSV file
Options for formatting your download, such as choosing results and setting custom row limits, are unavailable with this method.
The row limits correlate to the row limits of the tiles. Looker generates the zipped files via UTF-8 encoding.
Garbled file names can occur because of Looker’s UTF-8 encoding. When this happens, Looker recommends using a file extractor that supports UTF-8.
Extract Data from Dashboard Tiles
You can’t download data from dashboard tiles based on merged results queries.
However, data from merged results tiles are included when downloading a dashboard as a CSV collection or PDF file.
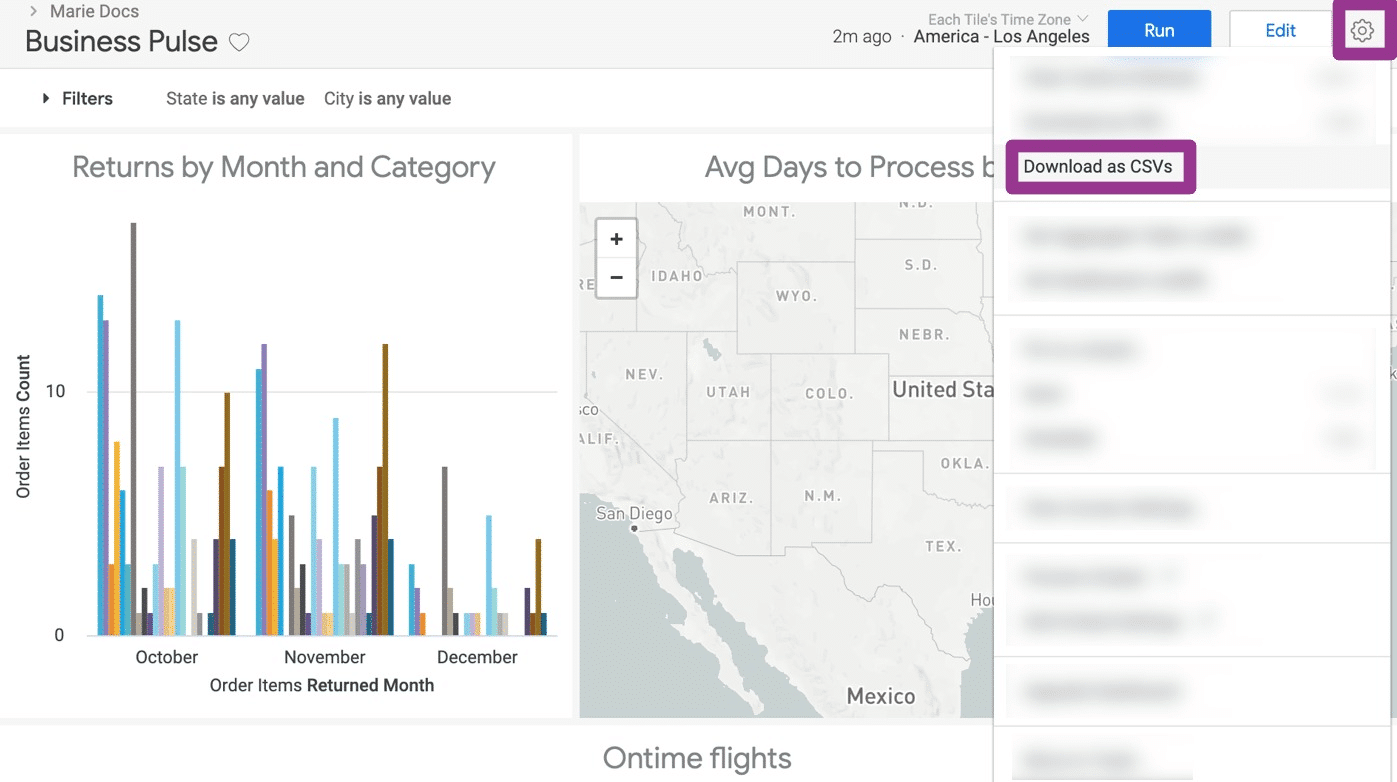
Click the three-dot menu icon on the tile to download data from a dashboard tile. Then select Download.
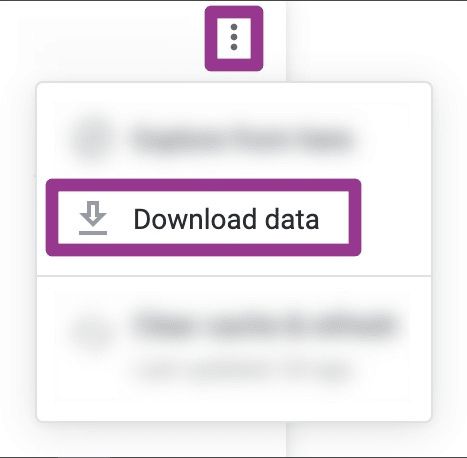
You’ll see a dialog box with options similar to a Look, an Explore, or a legacy dashboard tile download. You can expand the Advanced data options menu to view other download options.
Select CSV as your download file format. Then click Download after setting your download preferences.
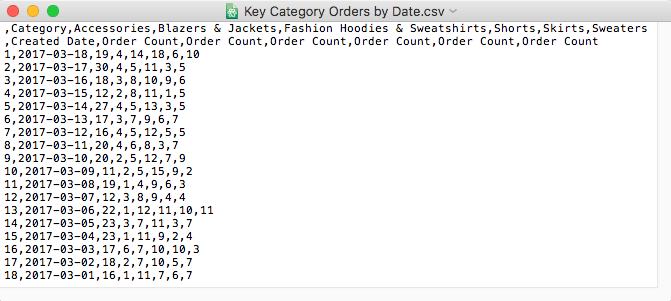
Extracting a Legacy Dashboard as CSV files
Click the gear icon at the upper right corner of the dashboard you want to download.
Select Download as CSVs to start downloading CSVs from a legacy dashboard.
The zipped file contains a separate CSV file for each of your dashboard tiles, including the formatted data used to build the tile in the dashboard.
Exporting Looker data can involve multiple steps, depending on where you pull the data from and the specific data you want to extract.
Each method takes a bit of a learning curve. But the main downside, with all of these methods, is that you cannot automate them and seamlessly incorporate them in your workflows.

Stop exporting data manually. Sync data from your business systems into Google Sheets or Excel with Coefficient and set it on a refresh schedule.

Method 3: Office Scripts
Office Scripts can be used to make HTTP GET requests to obtain data from external sources, such as Looker Studio’s exported data or APIs.
Step 1. Prepare Looker Studio Data Export or API Endpoint
Make sure your Looker Studio data or report can be accessed through a web-exported dataset URL or an API endpoint. You might need to use Google Sheets as an intermediary platform if Looker Studio doesn’t provide a direct API/URL for Excel integration.
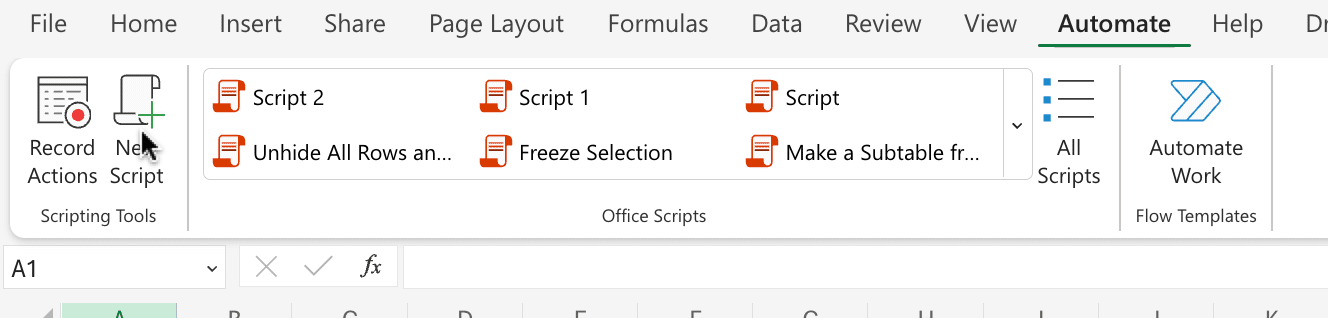
Step 2. Access Office Scripts in Excel for the Web
In Excel for the Web, open the workbook where you wish to import your Looker Studio data.
Select the “Automate” tab in the ribbon.Click on “New Script” to open the Code Editor.
Step 3. Create a Script to Fetch and Insert Data
You’ll write a script that uses fetch to make a GET request to your Looker Studio data URL/API. Then, parse the data and insert it into your workbook.
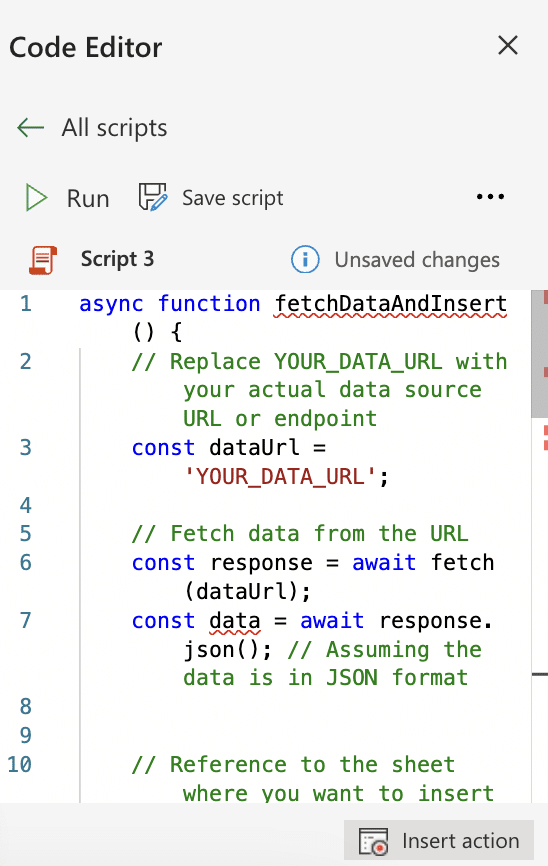
Here’s a simplified example script: async function fetchDataAndInsert() {
// Replace YOUR_DATA_URL with your actual data source URL or endpoint
const dataUrl = ‘YOUR_DATA_URL’;
// Fetch data from the URL
const response = await fetch(dataUrl);
const data = await response.json(); // Assuming the data is in JSON format
// Reference to the sheet where you want to insert data
let workbook = Excel.run(async (context) => {
const sheet = context.workbook.worksheets.getActiveWorksheet();
// Insert data in sheet; this example assumes data is an array of arrays
// You’d adjust this logic based on the actual structure of your Looker Studio data
data.forEach((row, index) => {
row.forEach((item, columnIndex) => {
sheet.getCell(index, columnIndex).values = [[item]];
});
});
await context.sync();
});
}
// Run the script function
fetchDataAndInsert();
Step 4. Customize the Script for Your Data
You might need to adjust the script based on the format and structure of your Looker Studio data.
You could be dealing with JSON arrays, objects, or even nested data, requiring further parsing and logic to properly insert the data into your Excel sheet.
Step 5. Run Your Script
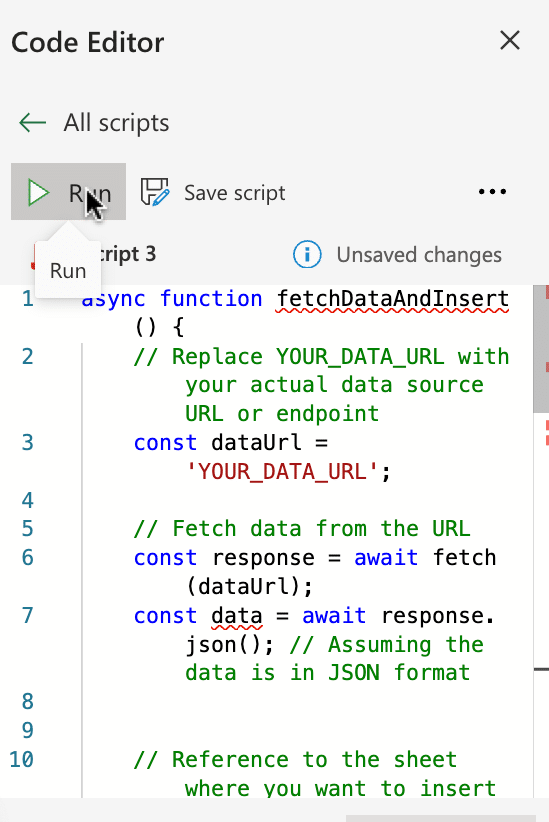
After ensuring your script accurately reflects the structure of your data, and the URL is correctly pointing to your Looker Studio data source, run the script through the panel.
This will fetch the data and populate it in your selected worksheet.
Export Looker Studio Data to Excel Effortlessly with Coefficient
Coefficient is a straightforward tool designed for simplicity, eliminating the need for technical setup and enabling you to transfer data from Looker Studio to Excel with minimal effort.
By doing away with the tediousness of manual data exporting and syncing, Coefficient allows you to engage with real-time data in Excel and craft custom Looker reports, significantly speeding up your processes.
Discover the advantages for yourself by trying Coefficient for free and see how it simplifies your data analysis tasks.


