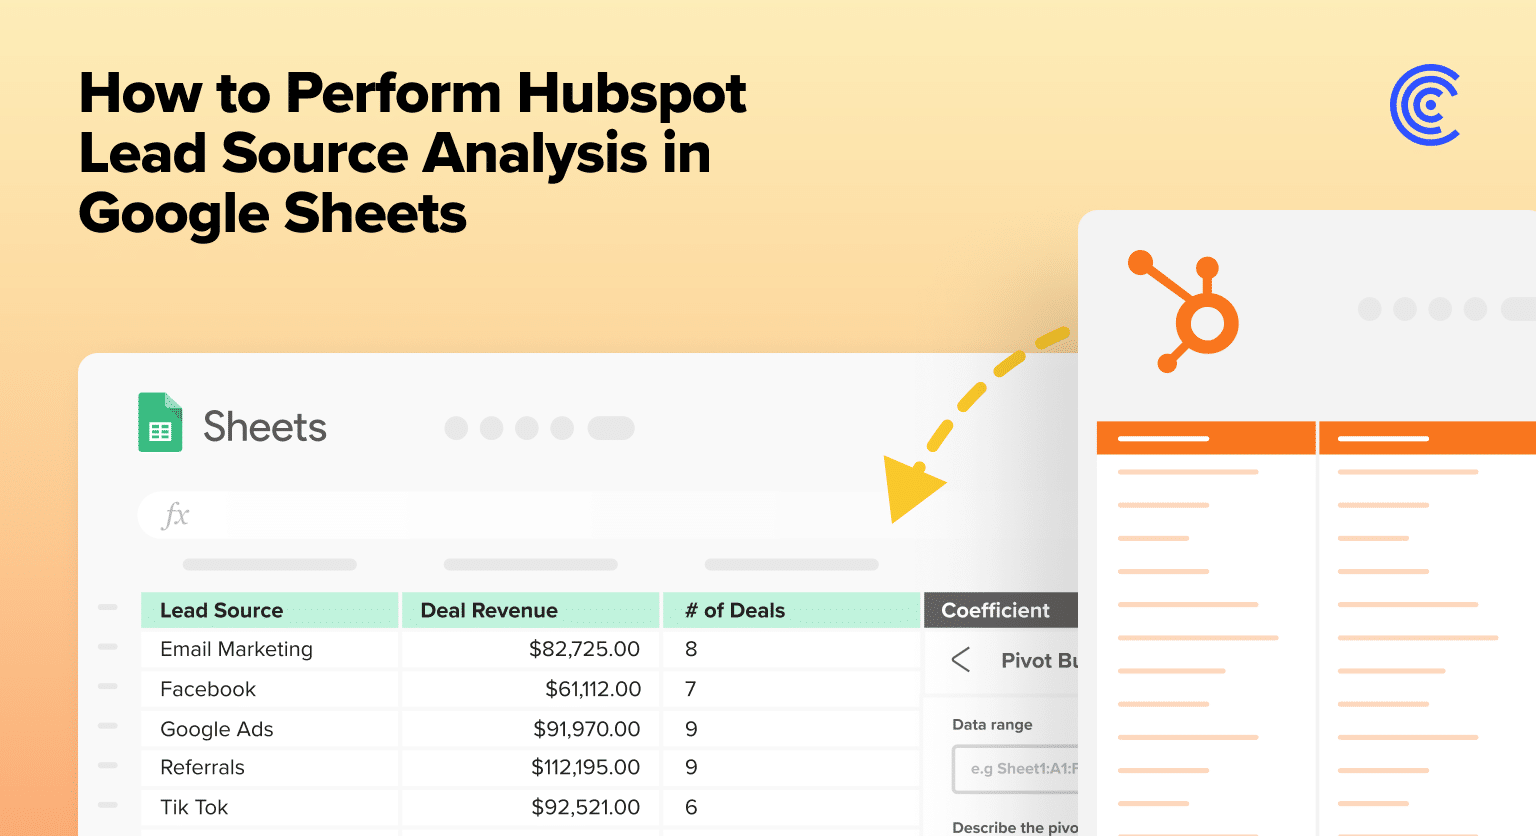
In order to optimize campaign strategy, budget allocation, and other marketing efforts, marketers need to understand where leads come from. That’s where lead source analysis comes in.
But manually conducting lead source analysis is incredibly labor-intensive, time-consuming, and error-prone.
Who hasn’t spent hours copying and pasting data into a spreadsheet only to find they made a mistake?
But here’s the good news: you can automatically perform lead source analysis entirely in Google Sheets, without all the hassle.
In this blog, we’ll show you how to generate a comprehensive lead source analysis with your HubSpot data using Coefficient’s GPT-powered pivot table builder.
Step-by-Step Guide: Analyze Lead Sources Directly in Google Sheets
Coefficient is a free Google Sheets add-on that allows you to connect your business systems to Google Sheets and pull real-time data into your spreadsheet.
Coefficient also comes with several powerful AI features that help marketers easily perform lead source analysis.
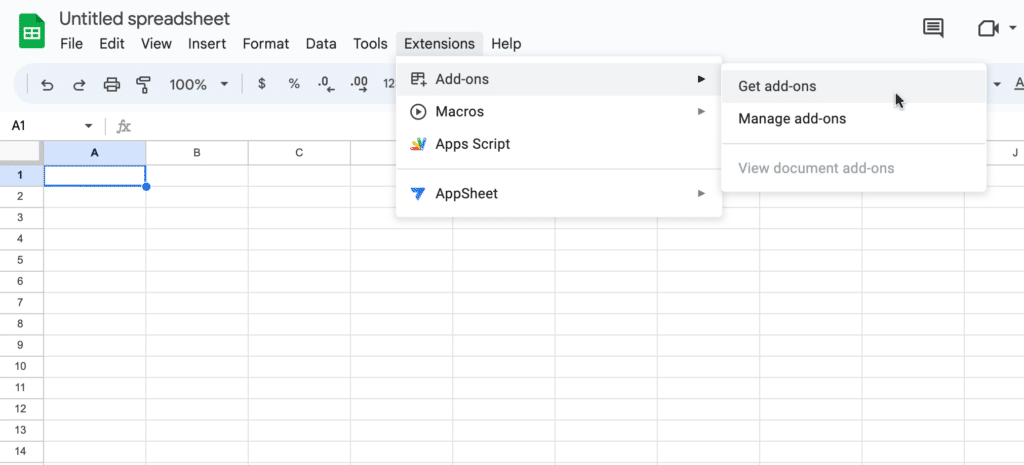
First, let’s install Coefficient. Open Google Sheets. Click Extensions on the menu bar and select ‘Add-ons’ -> ‘Get add-ons.’

This will launch Google Workspace Marketplace. In the search bar at the top, search for “Coefficient” and select the Coefficient app.

Grant Coefficient access to your Google account by pressing ‘Allow.’

Then, return to your Google Sheets menu and click on Extensions -> Coefficient -> Launch.

Coefficient will appear on the sidebar of your Google Sheet. Now you can import your live HubSpot data into Google Sheets.
Click ‘Import from…’ on the Coefficient sidebar menu.

Scroll down the sidebar to select HubSpot as your data source. Click ‘Connect.’

Now click ‘Authorize’ to grant Coefficient permission to access your HubSpot account.

Click ‘From Objects & Fields’ to import your data from HubSpot.

Select “Contacts” from the list of objects.

Choose the fields you want to import.

In this example, we’ll select: ‘ID,’ ‘Date,’ ‘Deal Name,’ ‘Lead Source,’ ‘Amount,’ ‘Deal Revenue,’ and ‘Status.’

Name your import and click ‘Import’ to pull your data into your spreadsheet. Your import should look something like this:

Stop exporting data manually. Sync data from your business systems into Google Sheets or Excel with Coefficient and set it on a refresh schedule.


Once your data is imported, we can start building our lead source analysis. Select ‘GPT Copilot’ from the Coefficient app menu.

Choose ‘Pivot Builder.’

Use your cursor to select the data range.

Pro tip: instead of dragging all the way down, you can delete the ‘9’ from “Deal!A2:G9” and the pivot builder will automatically take care of the rest.
Now describe the pivot table you want to build in the text box. Let’s view our deal revenue and number of deals by lead source and by month.
Input “Summarize deal revenue and count of deal revenue by lead source, pivot by month.”
Click ‘Build.’

Click ‘Insert’ -> ‘New Sheet,’ and your pivot table (GPT Pivot!A1) will automatically populate in a new sheet.

Now, you can see the deal revenue and the count of deal revenue in your table.

Note: The Pivot Builder saves your prompt history if you want to use it later.
And there you have it! Now you can easily perform a lead source analysis with your HubSpot data directly in Google Sheets!
Master Lead Source Analyses with Your HubSpot Data using Google Sheets + Coefficient
Coefficient makes it easy for anyone to use their HubSpot data to perform any analysis directly in Google Sheets, saving time and the headache of combining multiple CSV extracts.
Ready to take your HubSpot reporting to the next level? Check out Coefficient (for free) to start performing your lead source analysis today.


