Jira is a powerful project management tool for bug tracking, but it can sometimes pose challenges when multiple stakeholders are involved, particularly in terms of access, communication, and time management.
Fortunately, there are ways to streamline Jira bug tracking and provide visibility to all relevant stakeholders in Google Sheets!
In this blog, we’ll explore how Google Sheets, Jira, and AI can quickly provide insights into bug resolution times and identify areas for improvement.
Let’s get started!
Step-by-Step Guide: Track Jira Bugs in Google Sheets
Coefficient is a Google Sheets extension that connects business software like Jira to Google Sheets, allowing you to analyze live data straight in your spreadsheet. And the best part? It’s completely free!
By syncing live Jira data into Google Sheets using Coefficient, you can keep all your stakeholders informed with live reports, automated alerts, triggers, and more – all without the need for them to access Jira directly.
To reap these benefits, let’s quickly install Coefficient.
First, open Google Sheets. Click Extensions on the menu bar and select ‘Add-ons’ -> ‘Get add-ons.’
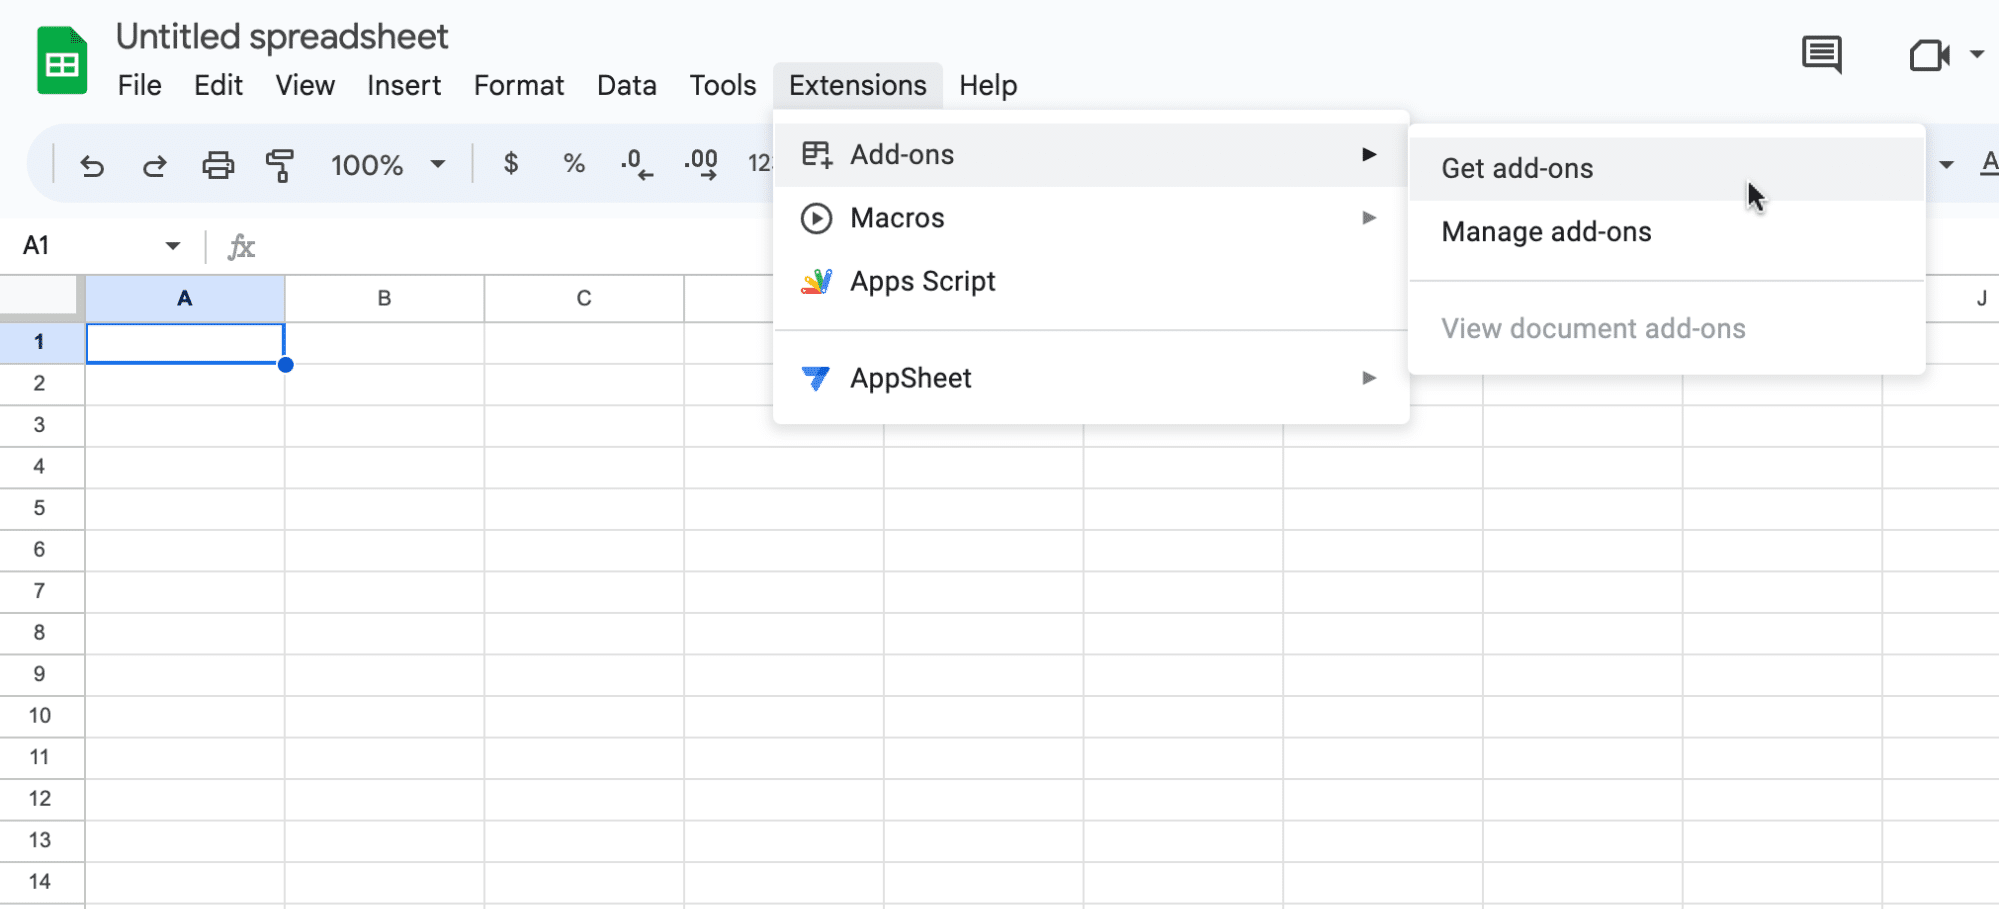
Search for “Coefficient” in the Google Workspace Marketplace search bar, and select the Coefficient app.

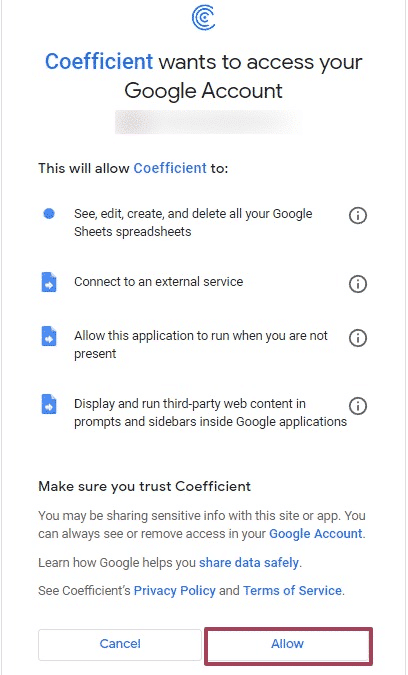
Toto proceed, you’ll need to grant Coefficient access to your Google account.
Select ‘Allow.’
After the installation is complete, go back to your spreadsheet menu and click on Extensions -> Coefficient -> Launch.
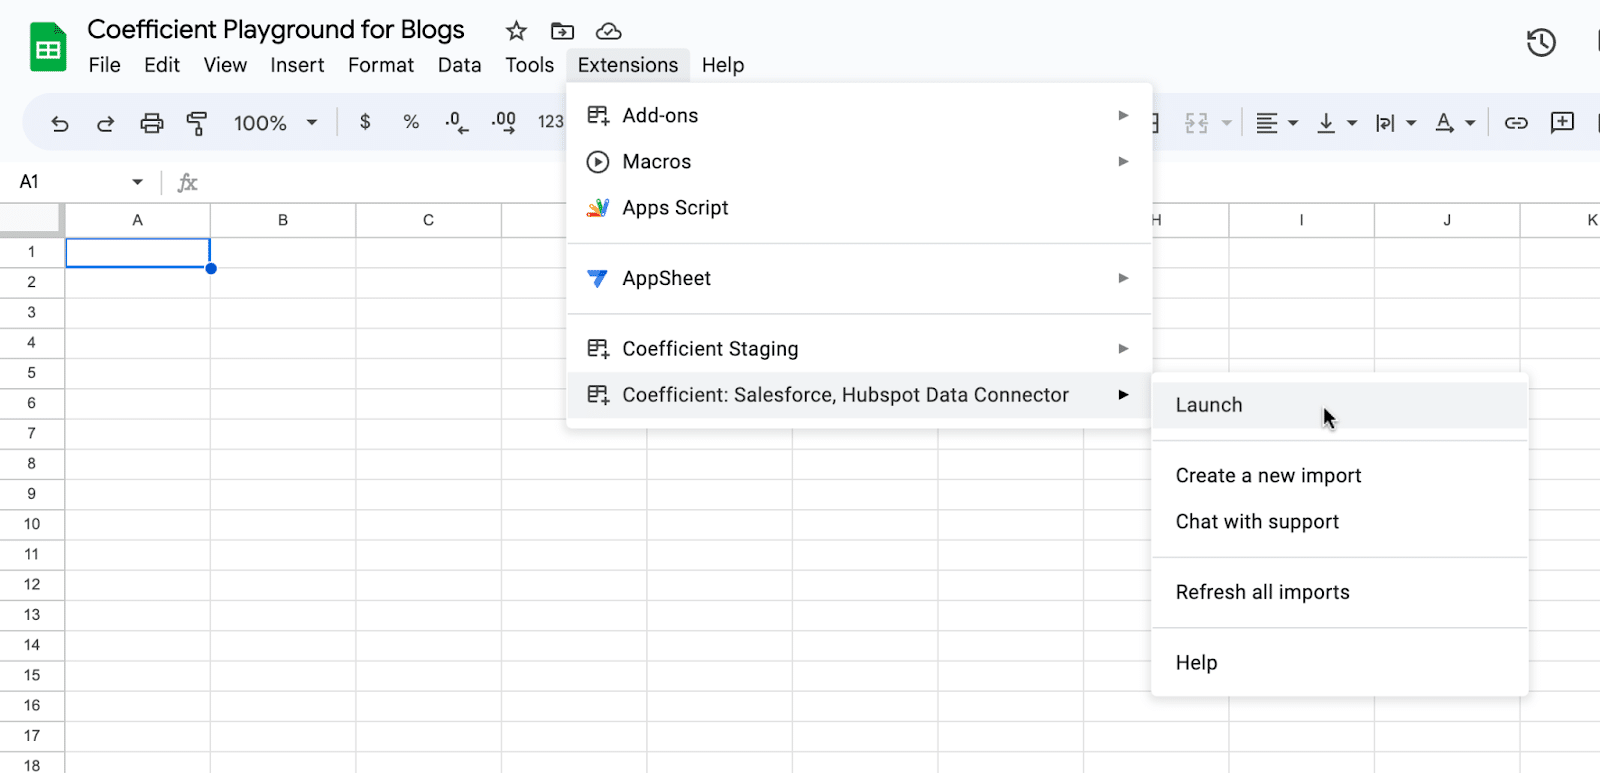
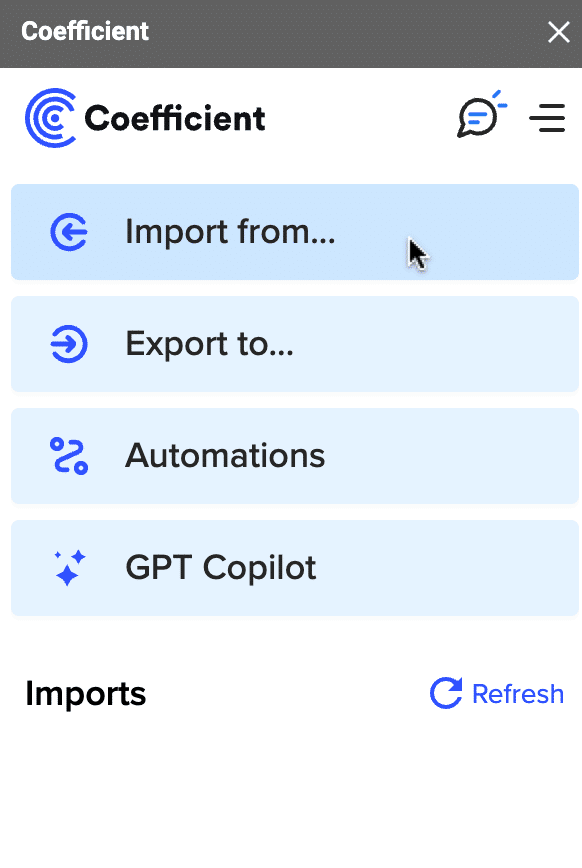
Coefficient will launch as a sidebar in your spreadsheet. Next, you’ll connect Coefficient to Jira.
Click ‘Import from…’ on the Coefficient sidebar menu.
Scroll down until you see the Jira connector and click ‘Connect.’

Now, you’re ready to import your data.
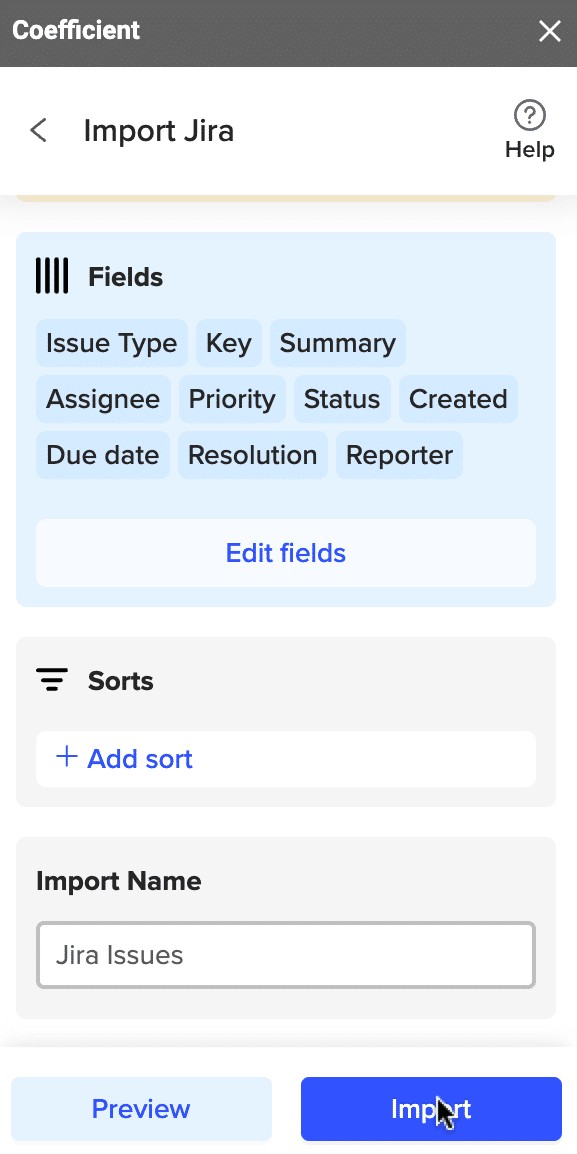
In this example, click ‘New Jira Issues.’ Select your fields and click ‘Import’ to import the data.
The Import will create a new tab of your selected data. Coefficient data imports can be refreshed manually by clicking the ‘Refresh’ button in Row 1, or automatically by selecting the daily, weekly or monthly refresh schedule.
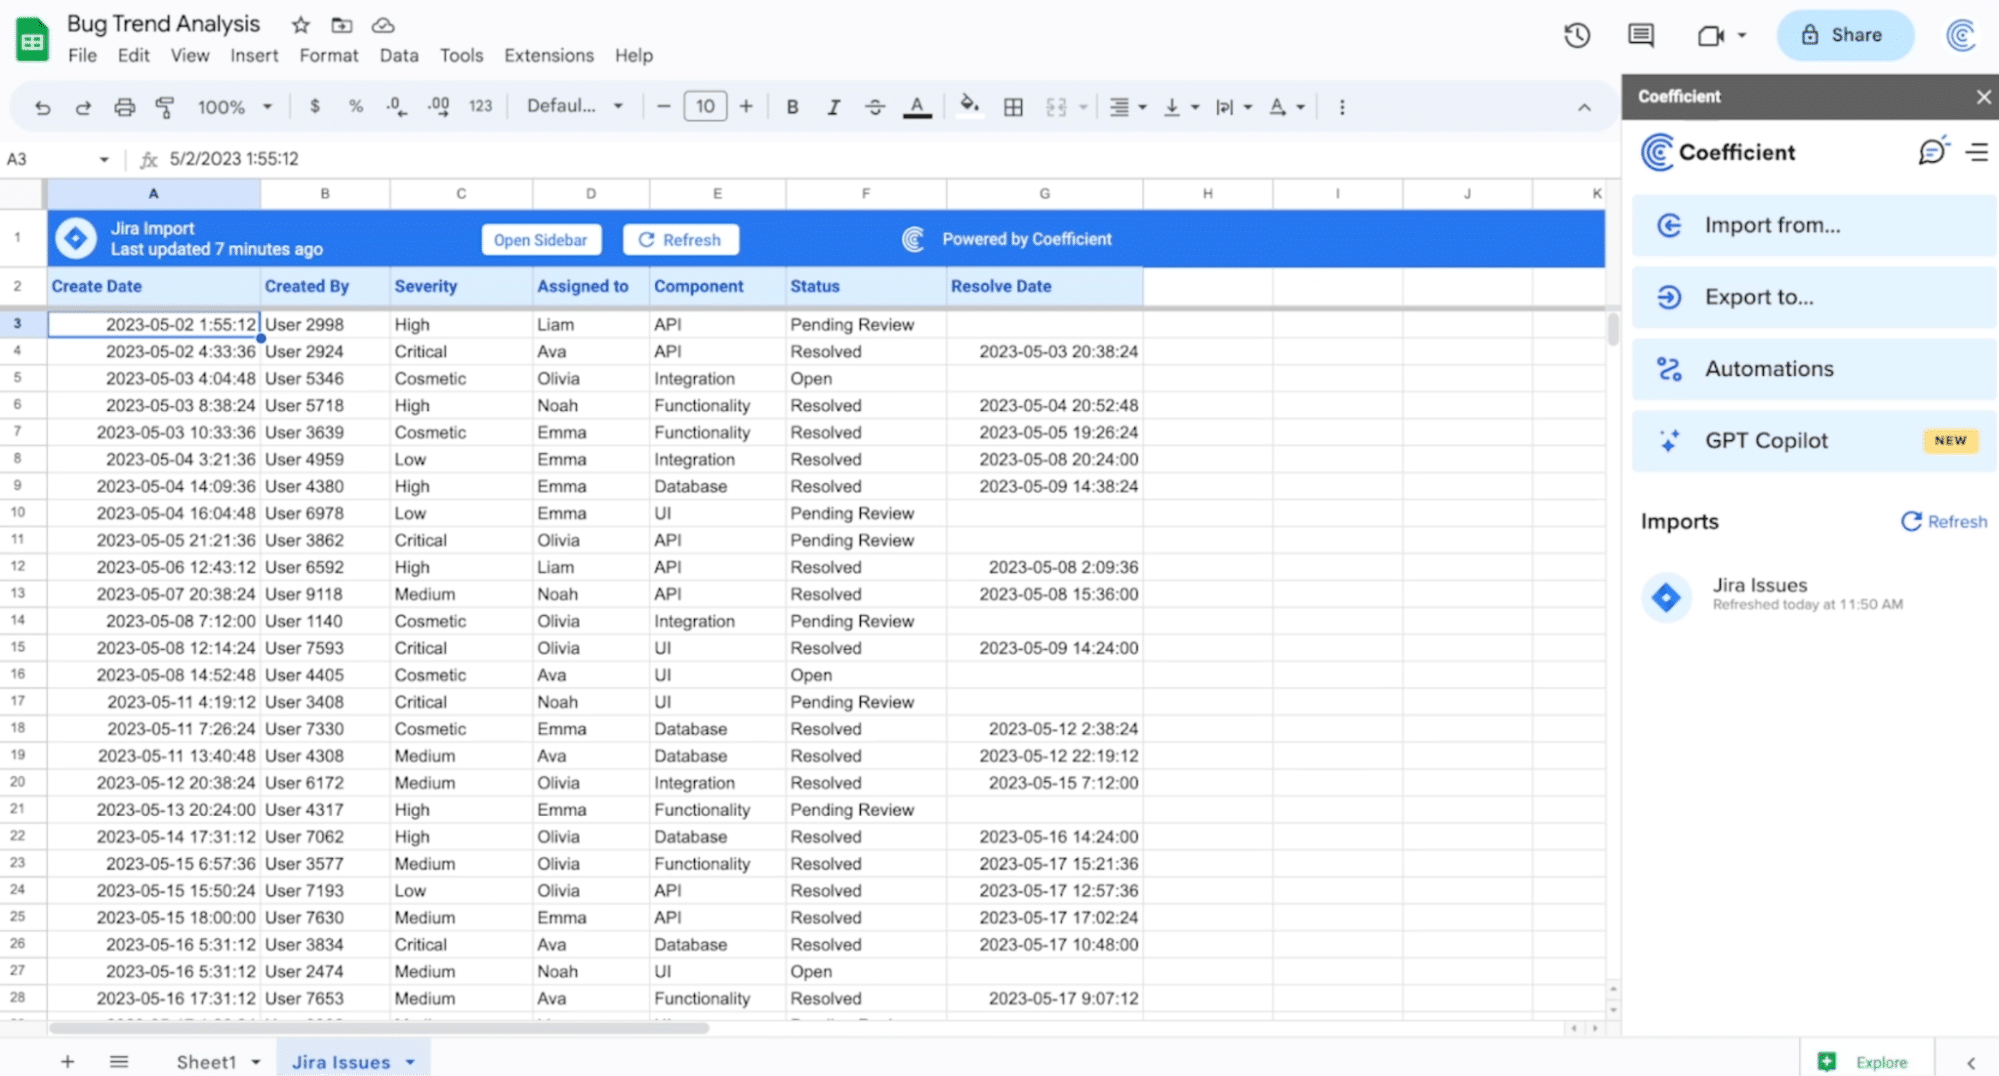
Now, let’s calculate ticket resolution time by using AI to create a formula to find the difference in days between the ‘Create Date‘ and ‘Resolve Dates.’
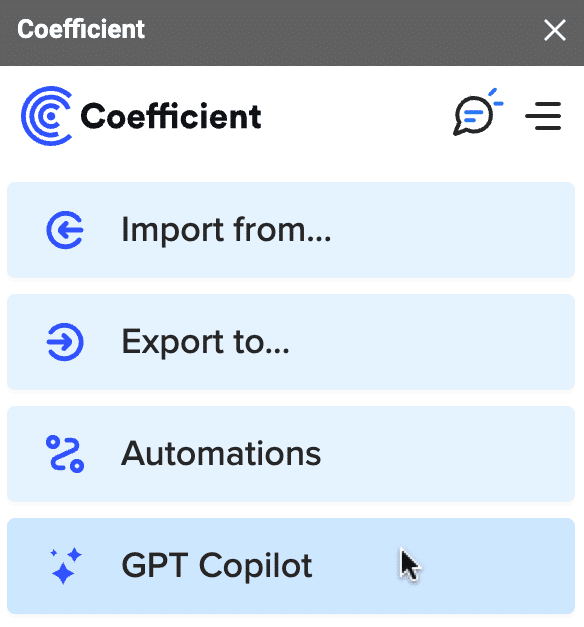
Navigate back to the main Coefficient menu and select ‘GPT Copilot.’

Stop exporting data manually. Sync data from your business systems into Google Sheets or Excel with Coefficient and set it on a refresh schedule.

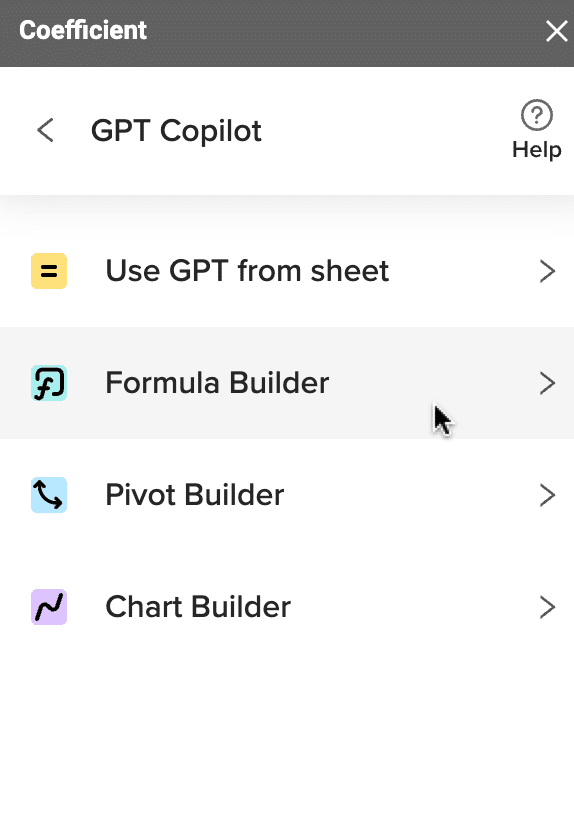
Click ‘Formula Builder.’
Describe the formula you want to build: “Calculate the time from create data (column a) to resolve date (column g) if error, leave blank. Start in row 3.”
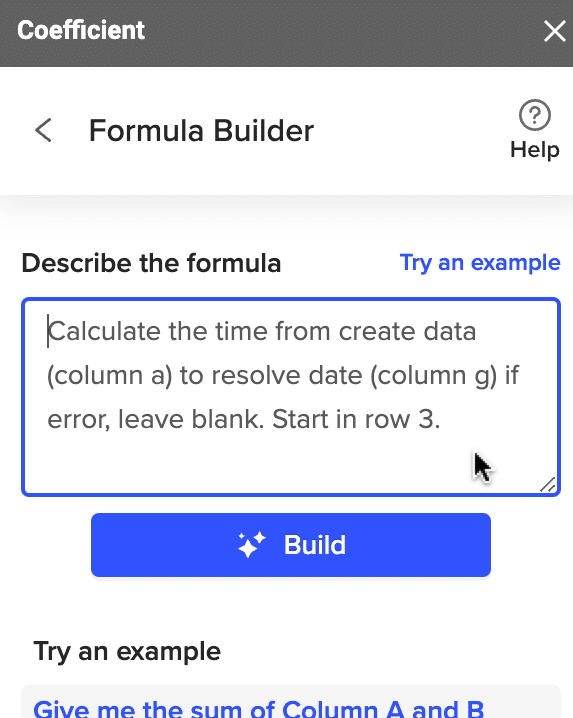
Click the ‘Build’ button, and Formula Builder will provide the perfect-fit formula based on your simple text instructions.
Copy your formula and paste it into Column H, ‘Time for Resolution.’
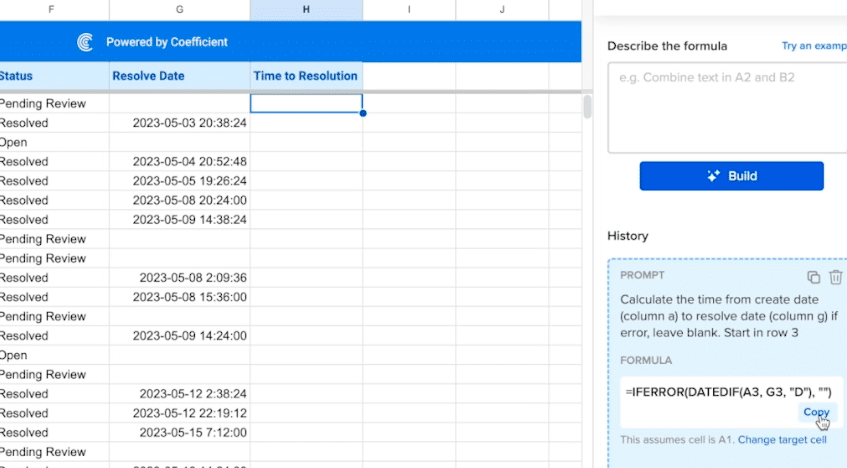
Then, drag the formula down the column to apply it to each cell.
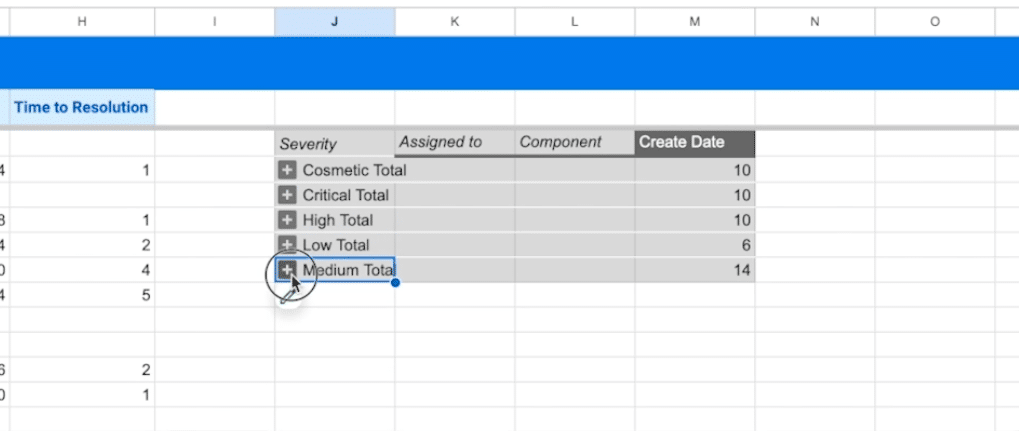
Now, let’s simplify analysis. Use AI to create a pivot table to visualize the quantity of bugs by severity, assignee, and component.
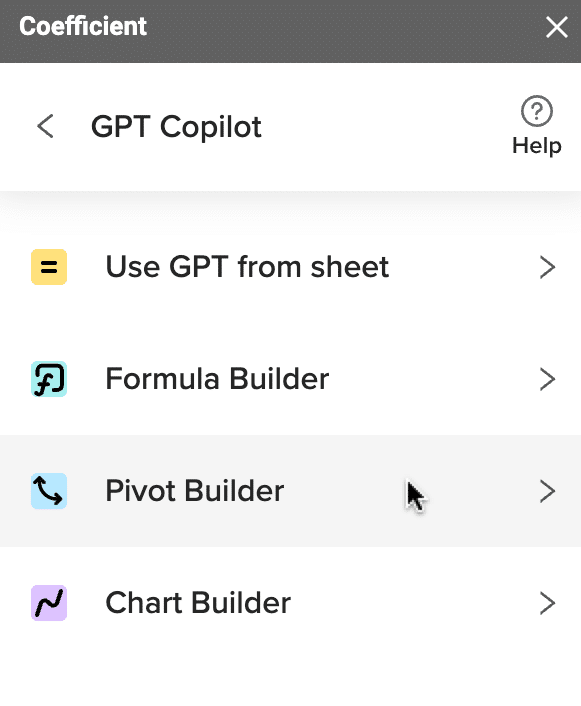
Return to the GPT Copilot menu. This time, you’ll select ‘Pivot Builder.’
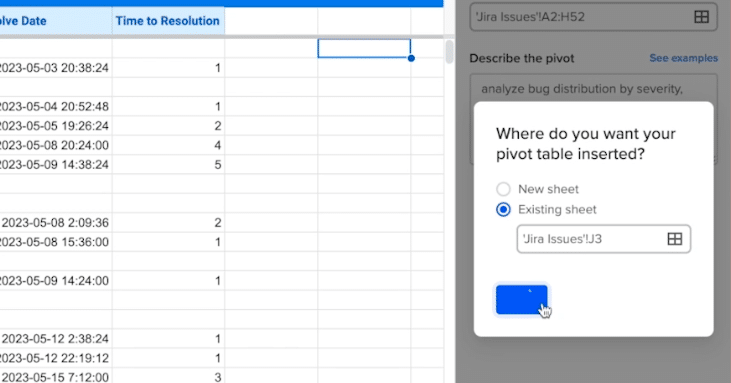
Select the Data range.

Then describe the pivot you wish to build: “analyze bug distribution by severity, assigned to, and component.”
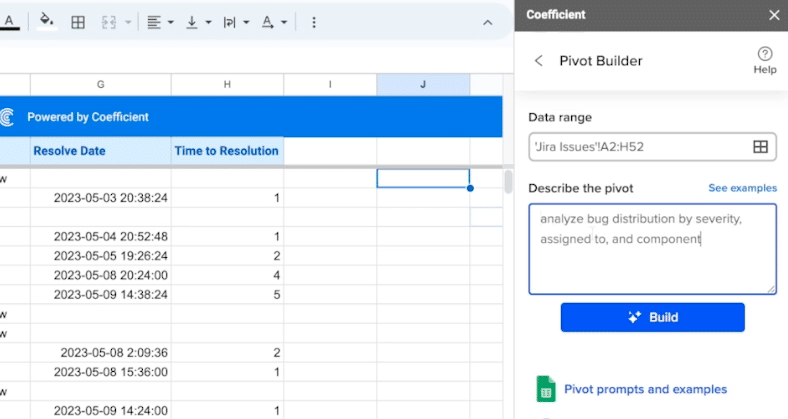
Click ‘Build’ and choose to insert your pivot table into a blank cell in the existing sheet.
And now you have a comprehensive overview of your bugs you can easily navigate through!
Track Jira Bugs Directly in Google Sheets with Coefficient
Coefficient makes Jira bug tracking in Google Sheets easier than ever by combining AI’s power with your live Jira data.
Install Coefficient today to see how easily it can streamline your Google Sheets analyses and workflows.

