Accounts receivable aging reports are an essential tool for businesses to evaluate their cash flow and the collectibility of outstanding invoices.
Aging reports can be generated using Excel, a popular platform among business owners and accountants. This Excel tutorial will guide you through the process.
Let’s get started!
Step-by-Step Guide: Accounts Receivable Aging Report in Excel
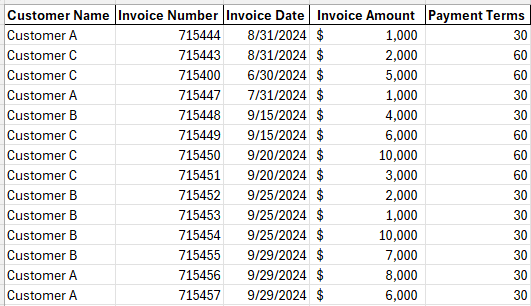
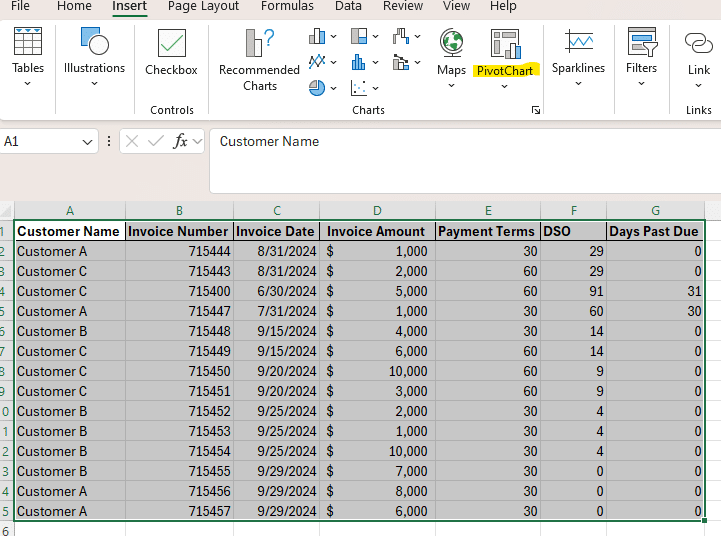
In order to produce an AR aging report in Excel, you must first have a dataset with all of the relevant attributes that go into the report. These typically include:
- Customer name – This can either be the actual customer name or a unique identifier used in your accounting software.
- Invoice number – This is the unique identifier for each invoice that was issued to a customer. Typically customers will reference a specific invoice number with any follow-up or clarification questions.
- Invoice date – This is the date that you issued the customer their invoice and will determine at what date the aging of that particular invoice starts.
- Invoice amount – What was the dollar amount of the invoice you sent to your customer.
- Payment terms – This is the agreed-upon payment terms you have with your customer. Typically, these are net 30, 60, or 90 days from the invoice date. Payment terms will determine whether an invoice is past-due.
Step 1: Set Up Your Environment
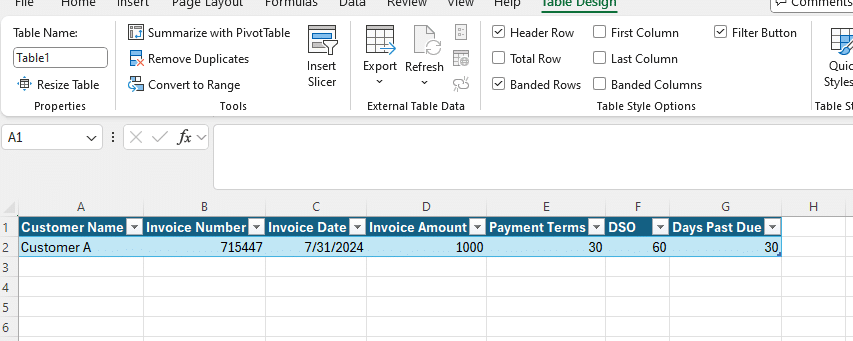
Set up your Excel file with your customer name, invoice number, invoice date, invoice amount, and payment terms that you can reference to build out your AR aging report.
Typically there will be a standard report you can pull with this information out of your accounting or invoicing system.
Step 2: Create a Formula to Calculate Number of Days Outstanding
Set-up your worksheet to calculate days sales outstanding (DSO).
Days sales outstanding calculates the number of days that an invoice has been outstanding. The Excel formula for days sales outstanding would be: = TODAY() – Invoice Date.
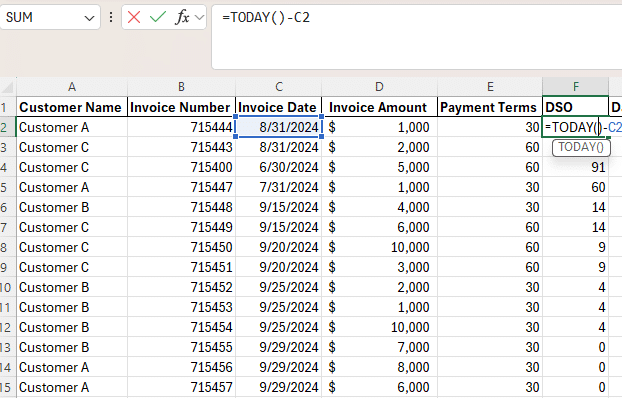
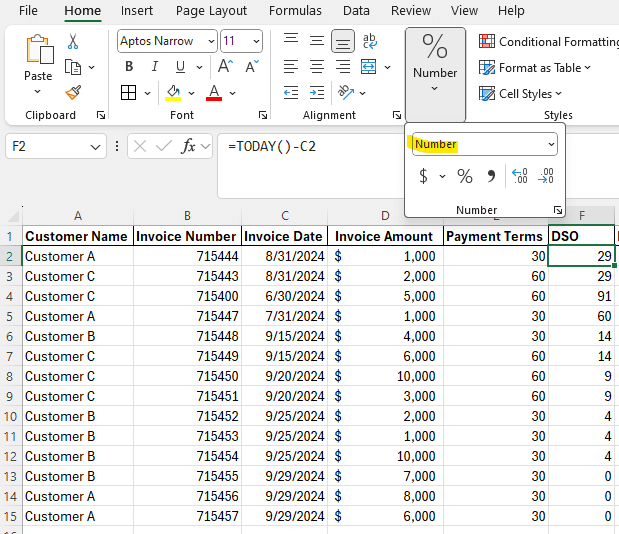
Your Excel file may default to format your formula as a date, you will want to change the formatting on the column to a number in order to see the number of days the invoice has been outstanding.
Step 3: Create a Formula to Calculate Days Past Due
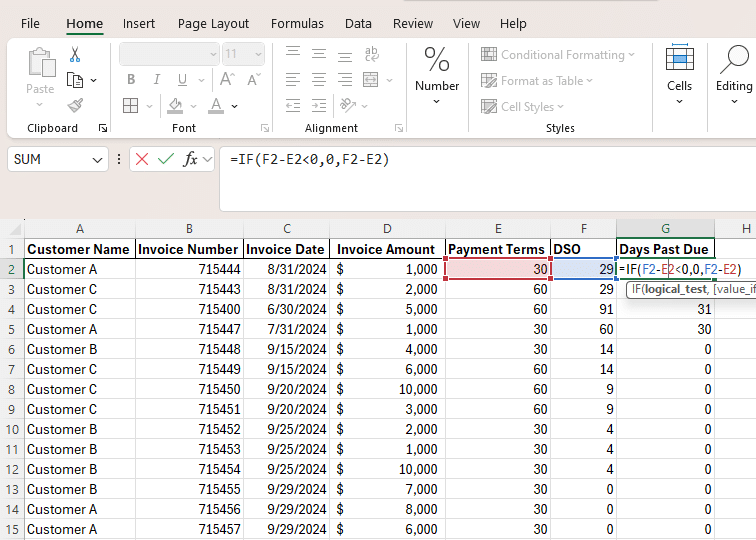
After you’ve calculated the days sales outstanding in your file you will want to calculate how many days an invoice is past due. In order to do this you will take your days sales outstanding and subtract your payment terms.
The formula to do this would be: =if(DSO – Payment Terms < 0, 0, DSO – Payment Terms).
This calculation will allow you to see not only how many days the invoice has been outstanding, but if it is actually past due based on the contractually agreed upon payment terms with your customer.
Step 4: Create a Pivot Table
After you’ve calculated the days sales outstanding and days past due you will need to create a pivot table in Excel.
This will allow you to summarize your aging report by customer and make it easier to analyze.
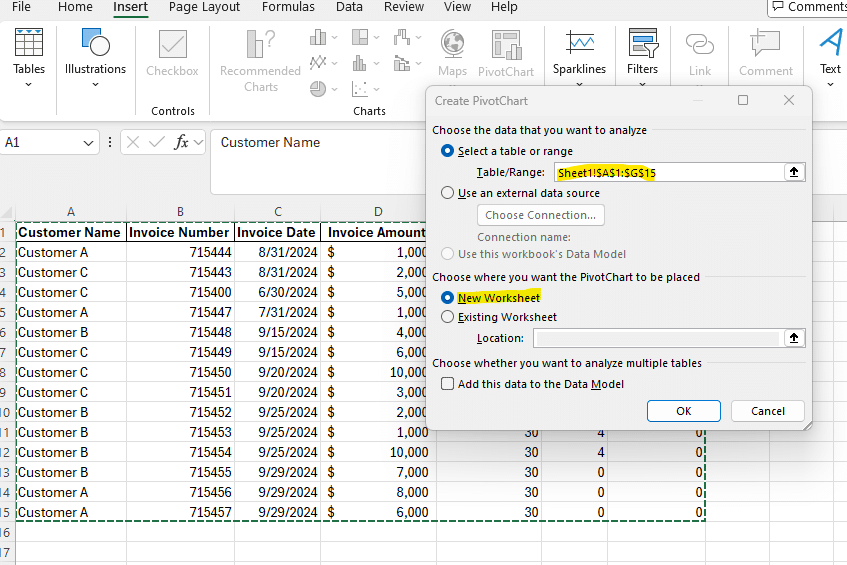
In order to create a pivot table you first need to highlight the area in Excel that you would like to pull into your pivot table. Depending on the version of Excel you have, you will then select either PivotChart or PivotTable from the Insert tab.
After you’ve selected PivotChart you will see the prompt below. This prompt outlines the data that will pull into your pivot table.
You will want to verify it is capturing all of the data from your AR aging data and select New Worksheet.
Step 5: Format Pivot Table
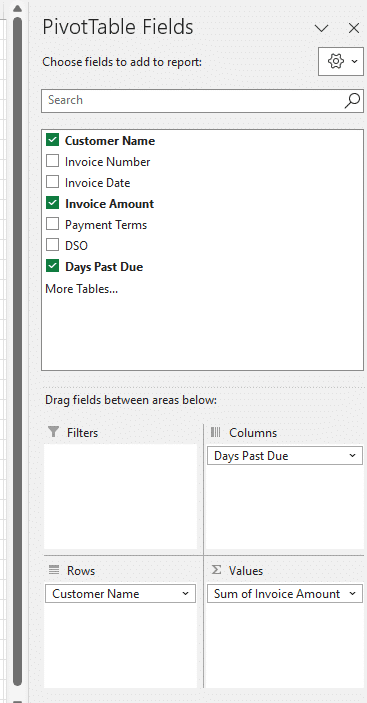
After you’ve created your pivot table on a new worksheet you need to pull in the relevant data to summarize in the table. In this case you would want to summarize the dollar amount of invoices you have by days sales outstanding and days past due to by customer.
In order to this you need to select the customer name as a row, invoice amount as values, and days past due as a column.
Step 6: Verify Outstanding AR Amount
Once the pivot table has been created you should cross-reference your original AR report to make sure the total outstanding invoices matches the total pulling into our pivot table. If these two do not match then an invoice was missed when you created the pivot table.

Stop exporting data manually. Sync data from your business systems into Google Sheets or Excel with Coefficient and set it on a refresh schedule.
Get Started
To troubleshoot this you should go back to step 4 and ensure that you selected all of the invoices when creating the pivot table.
Step 7: Analyze Results
Once you’ve verified the total outstanding AR is correct in your pivot table you can analyze the results.
In this pivot table anything under column B, labeled 0, is not past due. The customers would be considered current on these invoices and would not require further follow-up. Customer B is current with all outstanding invoices, so they are in good standing as of the current AR aging report.
Both Customer A and Customer C have outstanding invoices that are considered past due and would require follow-up with the customer.
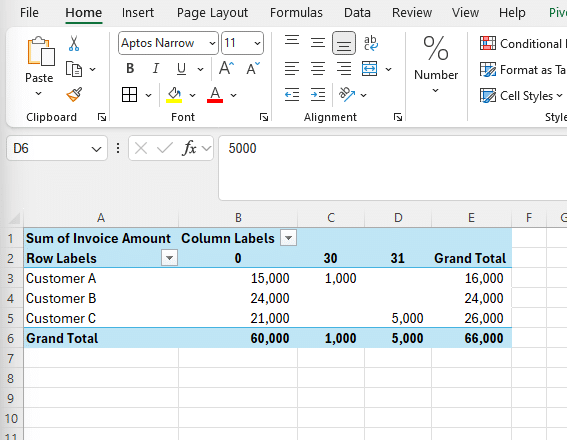
In order to see the specific invoice(s) that is past due in this pivot table you can double click on the value of that particular aging bucket.
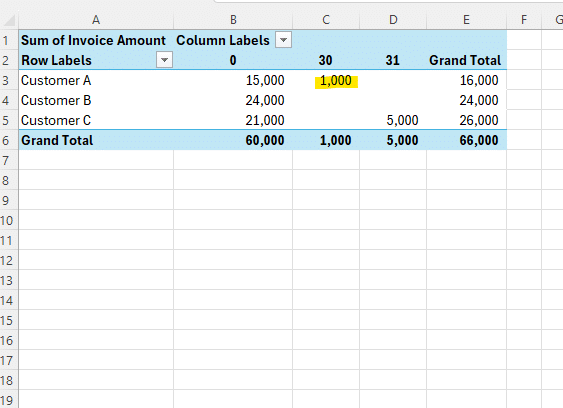
Once I double clock on the 1,000 in the 30 days past due bucket it will take me to a separate Excel sheet that lists the invoice(s) that make up that balance.
Use Cases for AR Aging Reports
Account Receivable aging reports help determine the current status of all outstanding invoices to customers. They are also valuable for:
- Determining why cash flow from operations may be lower or higher than you expected based on when customers are paying.
- Evaluating which customers you need to follow-up with to get past due invoices paid.
- Assessing which customers may be financially stressed and are consistently paying late. This may drive your business to no longer sell to a customer based on the financial viability of their business.
Creating and analyzing AR aging reports is a critical tool businesses need to use to make informed decisions about cash flow, customer base, business and capital planning, and pricing.
Improve Your AR Aging Report with Live Data
AR aging reports in Excel are a powerful tool for business planning and financial modeling. By following this guide, you can make informed decisions about pricing, cash flow, and your customer base
Ready to take your data analysis to the next level?
Try Coefficient to seamlessly integrate your Excel with live data from various business systems, enabling real-time break-even analysis and more advanced financial modeling.


