Mastering the ‘Group by’ SQL clause in Google Sheets is essential for anyone looking to analyze and summarize large datasets efficiently. By grouping rows based on common values, ‘Group by’ allows you to quickly gain valuable insights from your data.
In this step-by-step tutorial, you’ll learn how to use the ‘Group by’ clause to take your Google Sheets data analysis skills to the next level.
Understanding the ‘Group by’ Clause
The Google Sheets Query function operates similarly to SQL by executing structured queries on dataset ranges. It allows users to SELECT columns, apply GROUP BY clauses to aggregate data, and filter with the WHERE clause.
The basic syntax for using ‘Group by’ in Google Sheets is:
=QUERY(data_range, “SELECT columns GROUP BY grouping_columns”, [headers])
Step-by-Step Tutorial: Using ‘Group by’ in Google Sheets
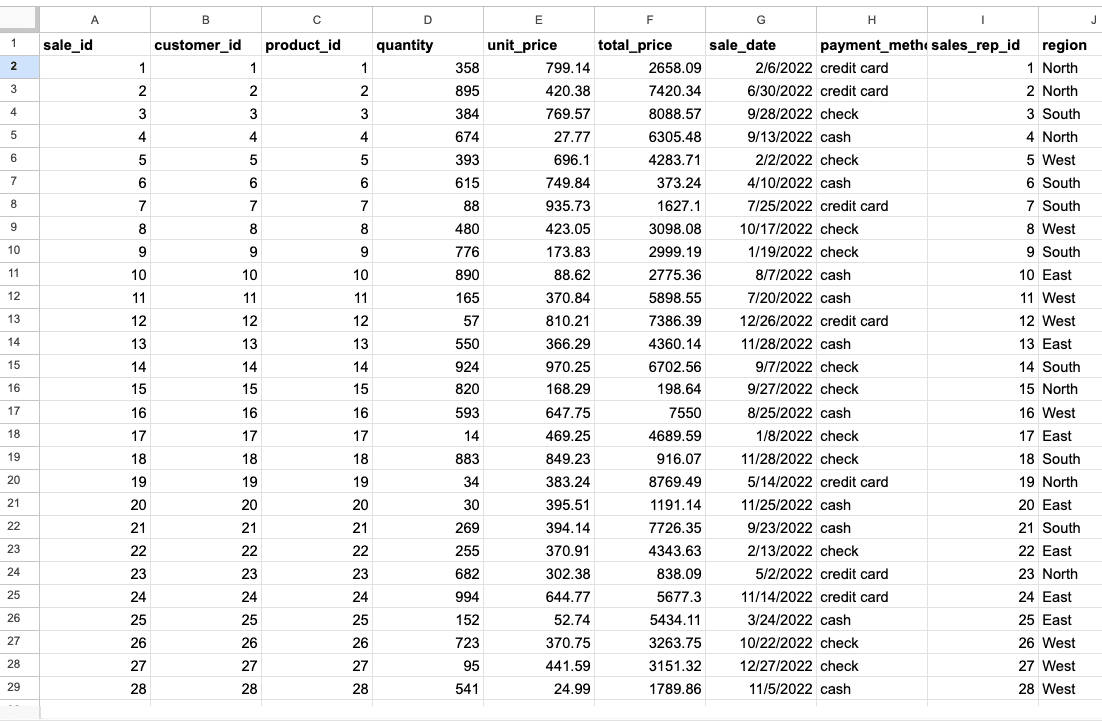
Step 1. Set up your data range
Select the entire dataset you want to analyze, including headers. Give your data range a name using the “Data range” box in the top left corner of the sheet for easier reference in the QUERY function.
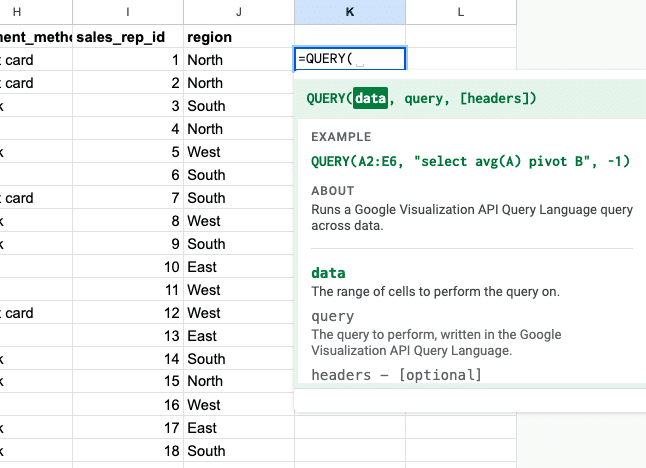
Step 2. Write the QUERY function with ‘Group by’
In a new cell, type =QUERY( and select your named data range or enter the range manually (e.g., A1:D100). Add a comma, followed by the query in double quotes.
Step 3. Select columns and specify grouping columns
Inside the query, use SELECT to choose the columns you want to include in your output. Then, add GROUP BY followed by the column(s) you want to group your data by.
Example: “SELECT Region, SUM(Sales) GROUP BY Region”
Step 4. Add aggregate functions
To perform calculations on the grouped data, include aggregate functions like SUM, COUNT, AVG, MIN, or MAX in the SELECT portion of your query.
Example: “SELECT Region, COUNT(OrderID), AVG(Sales) GROUP BY Region”
Step 5. Handle headers and format results
If your data has headers, add a third argument to the QUERY function to specify the number of header rows (usually 1).

Supercharge your spreadsheets with GPT-powered AI tools for building formulas, charts, pivots, SQL and more. Simple prompts for automatic generation.

Example: =QUERY(data_range, “SELECT Region, SUM(Sales) GROUP BY Region”, 1)
Format the output of your QUERY function as needed, such as applying number formats or adding charts.
Advanced Tips and Tricks
Once you’ve mastered the basics of ‘Group by’, try these advanced techniques to take your data analysis further:
- Combine ‘Group by’ with other SQL clauses like WHERE and ORDER BY to filter and sort your results. Example: “SELECT Region, SUM(Sales) WHERE Year = 2022 GROUP BY Region ORDER BY SUM(Sales) DESC”
- Use aliases for column names to create more readable output. Example: “SELECT Region, SUM(Sales) AS TotalSales GROUP BY Region”
- Nest ‘Group by’ queries to perform complex, multi-level analyses. Example: “SELECT Category, SubCategory, SUM(Sales) GROUP BY Category, SubCategory”
Master ‘Group by’ in Google Sheets to Enhance Your Data Analysis
By following this step-by-step tutorial, you’re now equipped to use the ‘Group by’ SQL clause in Google Sheets to summarize and analyze your data more effectively. Mastering this powerful tool will save you time and provide valuable insights for data-driven decision-making.
To take your data analysis capabilities even further, consider Coefficient.
Coefficient seamlessly connects your Google Sheets with your company’s data sources, enabling you to import, refresh, and analyze data without any coding required.


