The ability to make a table in google sheets is one of the best features to help you organize and analyze your data more effectively. In this article, we will explore how to make a table in Google Sheets, step by step.
How to Make a Data Table in Google Sheets
To create a data table in Google Sheets:
- Open Google Sheets and create a new spreadsheet.
- In the first row, enter the column headers for your data table.
- Enter the data for each row in the corresponding columns.
- Highlight the data you want to include in your table.
Once you have created your data table, you can customize it by changing the font, cell colors, and other formatting options. You can also sort and filter your data to make it easier to analyze.
Update – Simpler and effective way to create Tables
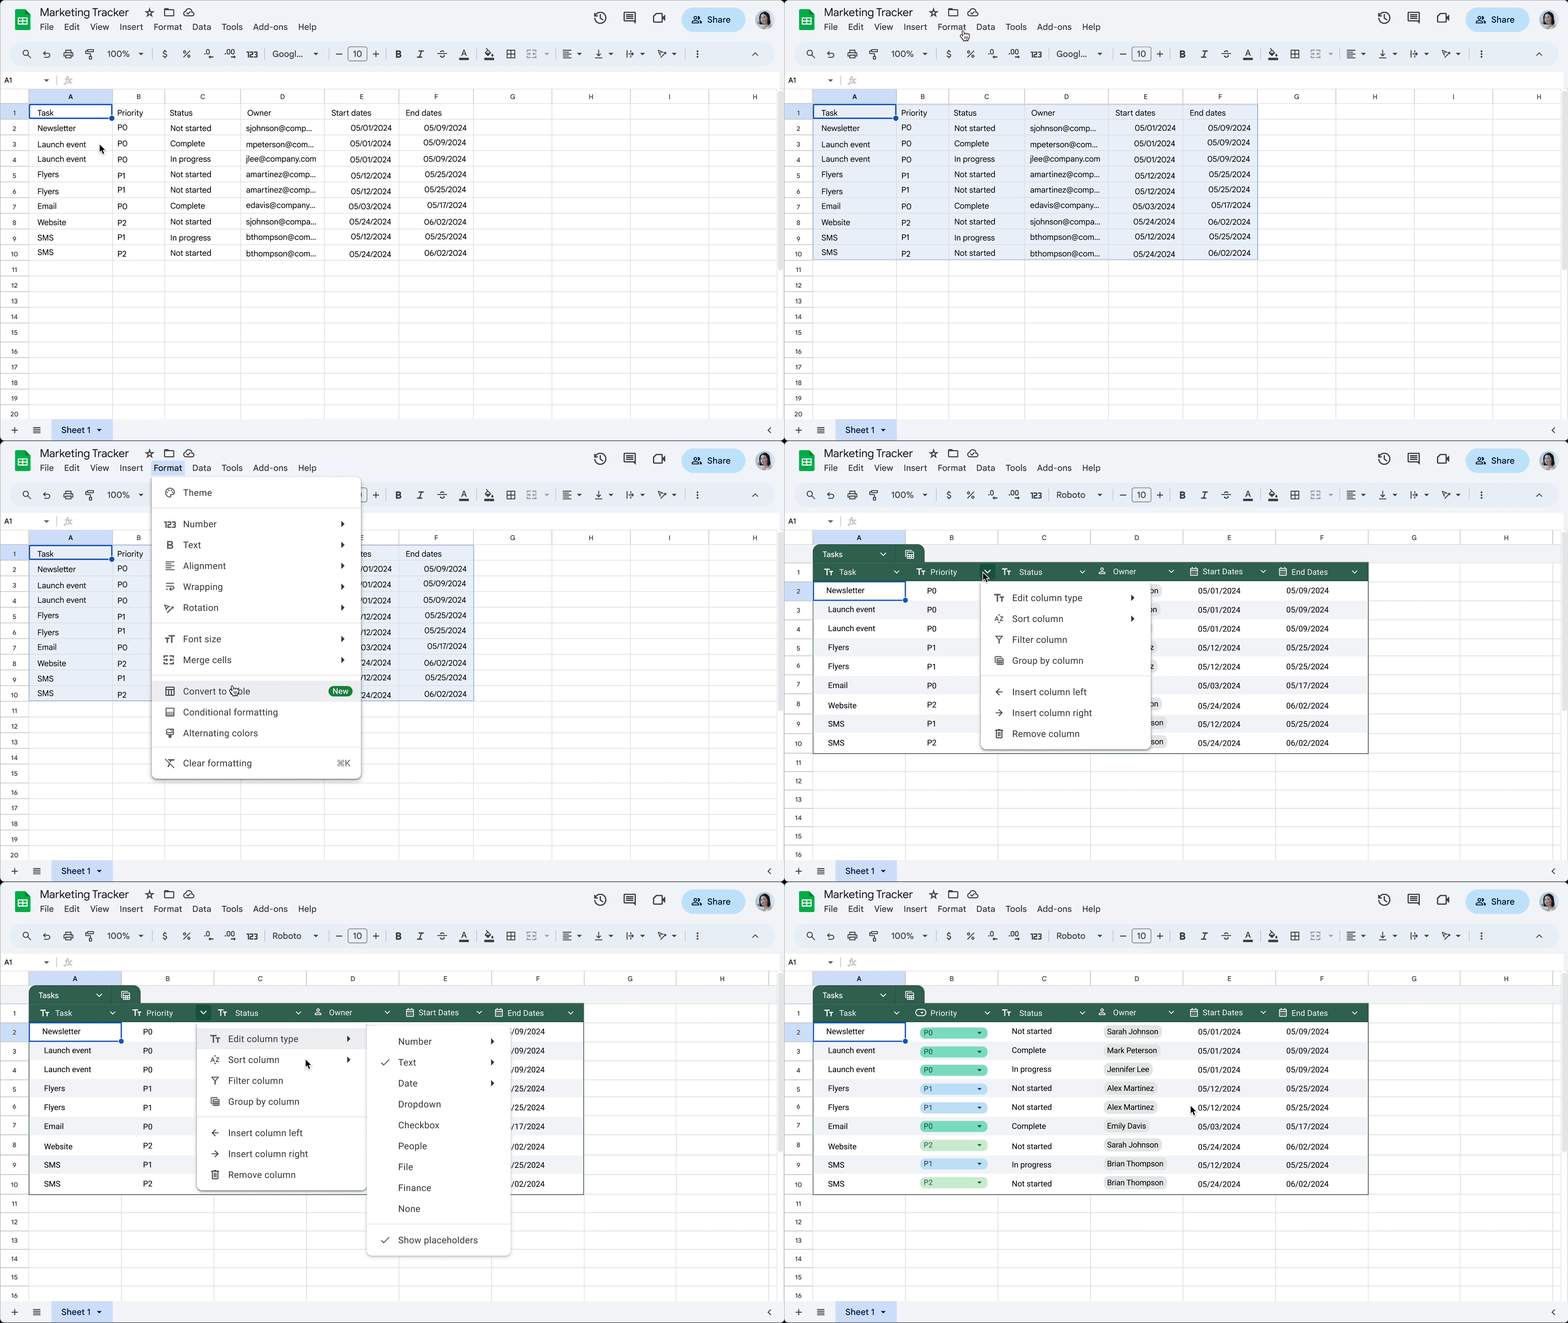
Starting May 2024, Google has announced simple and easy ways to create tables on Google Sheets. Simply select the data range and click on “Format” from the Menu Bar and choose “Convert as a Table” option. Or just click Insert on the Menu bar and choose “Table” as an option.
Disclaimer – This feature has just started to rollout and will be available for all users by the end of June 2024.

Adding Data to Your Table
Now that you have created and formatted your table, it’s time to add data to it. Here are some tips for adding data to your table:
- Use clear and descriptive column headers to make it easy to understand what each column represents.
- Make sure that your data is organized in a consistent way so that it is easy to sort and filter.
- Use formulas to automatically calculate values based on other cells in your table.
- Use data validation to ensure that data entered into your table meets certain criteria.
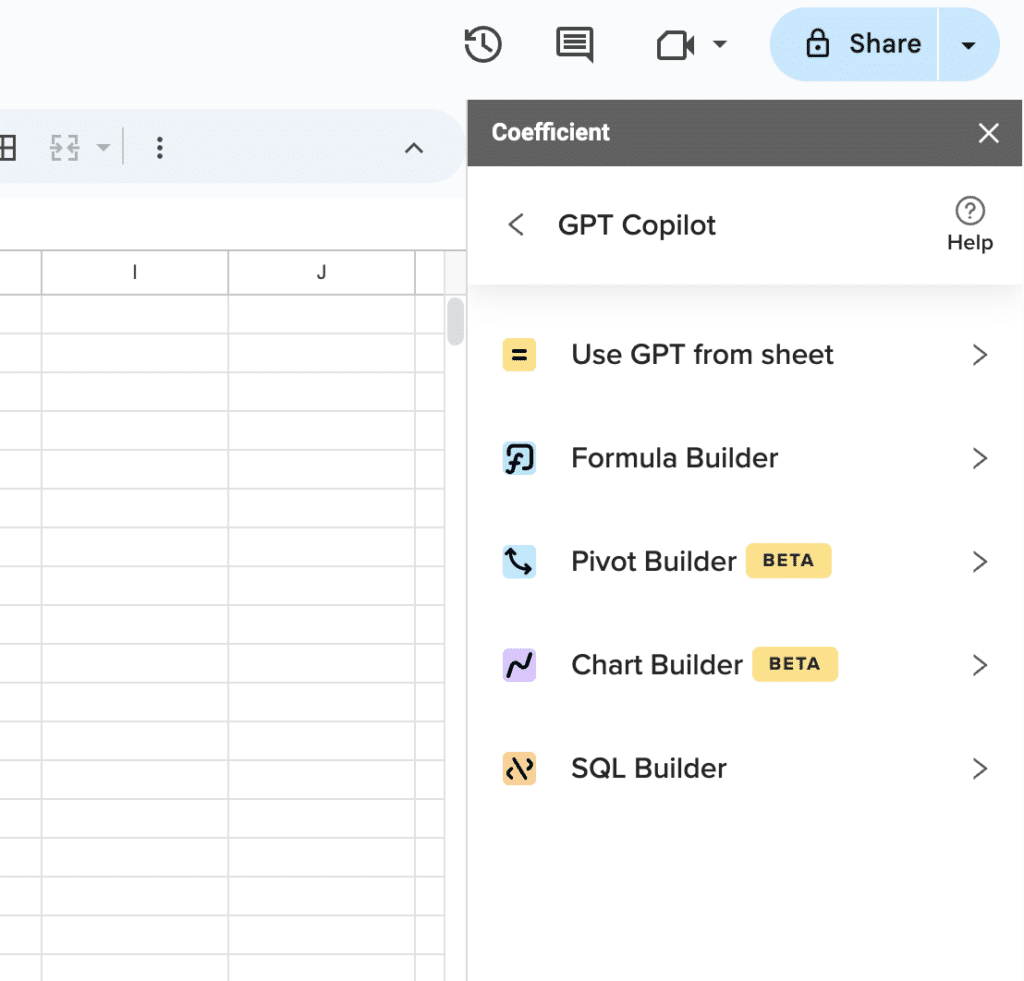
Pro tip: If you’re pulling data from another system and copy-pasting or manually importing your data, you can 10x the speed of your data workflows with free data connectors, using a Google Sheets extension like Coefficient.

Supercharge your spreadsheets with GPT-powered AI tools for building formulas, charts, pivots, SQL and more. Simple prompts for automatic generation.

Coefficient offers data connectors for CRMs like Salesforce and HubSpot, marketing analytics platforms like GA4, Google Search Console and ads platforms, databases/data warehouses like Snowflake and PostgreSQL, and many more.
Once you import your data with Coefficient, you’ll have the option to keep your data on a refresh schedule so you’re tables are always live.
Formatting Your Table
Once you have created your table, you may want to format it to make it easier to read and analyze. Here are some tips for formatting your table:
- Use bold or italic text to highlight important information.
- Use different font sizes or colors to differentiate between different types of data.
- Use borders to separate different sections of your table.
- Use conditional formatting to highlight cells that meet certain criteria.
By formatting your table in a clear and consistent way, you can make it easier to read and understand, and you can also make it more visually appealing.
Troubleshooting Common Issues
If you encounter any issues while creating your data table in Google Sheets, here are some common solutions:
- If you are having trouble sorting or filtering your data, make sure you have selected the correct range of cells and that your data is formatted as a table.
By following these steps and troubleshooting tips, you can create a professional-looking data table in Google Sheets to help you organize and analyze your data.


