Grouping columns in Google Sheets can transform your data management. It’s simple yet powerful. In this guide, you’ll learn how to do it step-by-step.
You’ll see how it makes data clearer and your work more efficient.
Let’s dive in!
Grouping Columns in Google Sheets
In Google Sheets, efficiently organizing data can be achieved through grouping columns. This feature allows users to concisely present information by collapsing and expanding sets of columns as required.
Executing Group Columns
To group columns in Google Sheets, users simply right-click on the column header of the desired range and select “Group columns” from the menu. This action can also be accomplished with a keyboard shortcut, enhancing the workflow speed. Here is a step-by-step process:
- Select the columns to be grouped by clicking on the first column header and dragging across to the last.
- Right-click on one of the selected column headers.
- Choose “Group columns [column range]” from the context menu.
- The grouping is now visible as a bracket above the group with a ‘-‘ (minus) button to collapse the group.
Grouping Multiple Columns:
- Select multiple columns by holding the Shift key and clicking on the corresponding column headers.
- Right-click and choose “Group columns”.
Using Keyboard Shortcuts:
- To group, press Alt + Shift + Arrow Right (Windows) or Option + Shift + Arrow Right (Mac).
- To ungroup, press Alt + Shift + Arrow Left (Windows) or Option + Shift + Arrow Left (Mac).
Understanding Grouping Options
Once columns are grouped, users have the ability to expand or collapse the group with a single click on the ‘+’ (plus) or ‘-‘ (minus) button. This is especially useful in managing large data sets, allowing for a cleaner view when focusing on specific details.
Changing the Grouping Interface:
- Move the +/- button to the top or bottom of the group bracket by single-clicking on it.
- View more column actions through the right-click context menu to customize the grouping behavior further.
Additionally, one can group columns at multiple levels, creating a hierarchical view of the data. However, it’s important to note that Google Sheets also allows the grouping of rows in a similar manner, enhancing the capability to organize different data dimensions.
Managing Grouped Columns
In Google Sheets, mastering the grouping feature is essential for clean and effective data management. It simplifies data analysis and enhances readability by allowing users to manipulate data with ease.

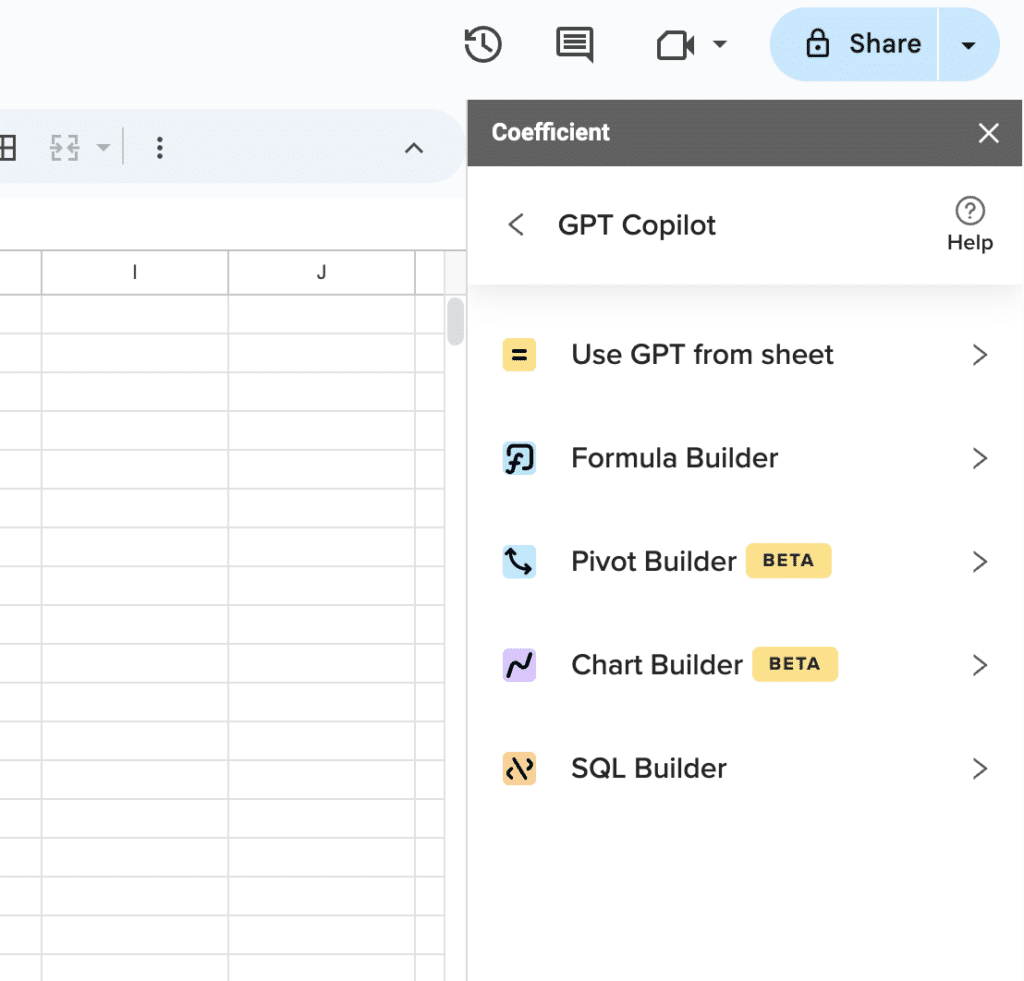
Supercharge your spreadsheets with GPT-powered AI tools for building formulas, charts, pivots, SQL and more. Simple prompts for automatic generation.

Expanding and Collapsing Groups
Expanding and collapsing groups in Google Sheets can greatly improve the visibility of data. Users can quickly collapse columns to hide rows or subgroups, minimizing information overload. This is especially useful in complex datasets with multiple layers of grouped data.
To expand a group, one simply clicks on the plus sign (‘+’) beside the collapsed group. To collapse, you click the minus sign (‘-‘), streamline the outline of data displayed.
Ungrouping Columns and Rows
To ungroup rows or columns, users have the option to remove group settings from their sheet. This action can be performed by right-clicking the group header and selecting the ‘Ungroup’ option, reversing the grouping action.
It’s possible to both ungroup individual sections or all ungroup rows and columns simultaneously, helping users keep their data views up-to-date and tidy.
Conclusion
Grouping columns in Google Sheets is easy and effective. It’s a game-changer for managing complex data, especially in B2B SaaS companies. Try it and see how it streamlines your work.
Ready to take your data management to the next level? Install Coefficient for even more powerful features. Get started here.


