
Google Sheets is a powerful tool that can help users perform various calculations for a wide range of applications. One of the most common calculations performed in Google Sheets is finding the mean of a set of data.
To find the mean in Google Sheets, users have several options. One of the easiest ways is to use the built-in AVERAGE function. This function calculates the mean of a range of cells and returns the result in the cell where the formula is entered.
Whether you’re analyzing sales data, academic scores, or survey results, understanding how to find the mean helps you quickly assess your data’s central tendency. This blog will show you how.
Understanding the Concept of Mean
Definition of Mean
The mean, a key statistical measure, represents the arithmetic average of a set of numbers. It’s essential for data analysis, providing a snapshot of your dataset’s typical value.
This is particularly useful in identifying outliers and comparing data sets, like evaluating average employee salaries against industry standards.
Importance of Mean in Data Analysis
The mean is an essential tool in data analysis as it provides a measure of central tendency, representing the typical value within the dataset. It is often used to summarize a large dataset and to make comparisons between different datasets.
For example, if a company wants to compare the salaries of its employees with the industry average, it can calculate the mean salary of its employees and compare it with the mean salary of the industry.
Moreover, the mean is often used to identify outliers in a dataset. An outlier is a value that is significantly different from the other values in the dataset. By calculating the mean, it is easier to identify outliers as they will have a significant impact on the value of the mean.
Finding Mean in Google Sheets
Now, let’s explore the process of finding the mean in Google Sheets, step by step.
Entering Data in Google Sheets
Before finding the mean, you need to enter the data in Google Sheets. To do this, follow these steps:
- Open a new or existing Google Sheet.
- Select the cell where you want to enter the data.
- Type in the data, separating each value with a comma or pressing enter after each value.
- Repeat the process for all the data values.
Note: In this example, we are starting with the data set below.

Using the Average Function
The quickest and easiest way to calculate the mean of a dataset in Google Sheets is to use the AVERAGE function. Follow these steps to use the AVERAGE function:
1. Click on the cell where you want to display the mean.

2. Type =AVERAGE( in the cell.

Supercharge your spreadsheets with GPT-powered AI tools for building formulas, charts, pivots, SQL and more. Simple prompts for automatic generation.


3. Select the range of cells that contain the data you want to average.
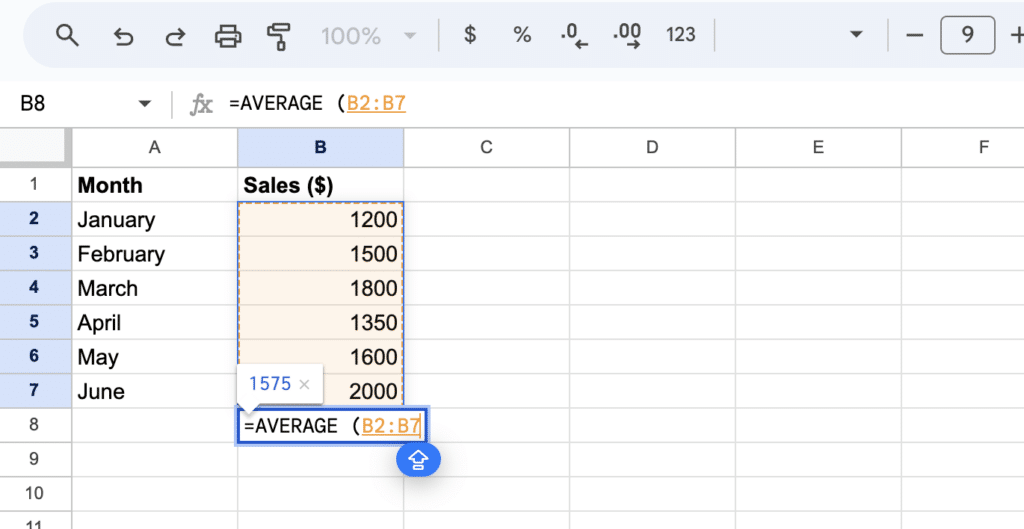
4. Type ) to close the function.

5. Press enter to calculate the mean.

Interpreting the Results
After finding the mean, it’s important to interpret the results correctly. The mean represents the average value of the data set and provides a measure of central tendency.
If the data set is normally distributed, the mean is a good representation of the typical value within the dataset. However, if the data set is skewed, the mean may not be a good representation of the typical value.
Conclusion
Calculating the mean in Google Sheets is straightforward and provides valuable insights into your data. For more advanced data analysis, consider integrating Coefficient with Google Sheets.
Coefficient seamlessly connects Google Sheets to your databases and CRMs, automating data updates and eliminating manual input errors.
Install Coefficient for free today to try it with your business data!


