Scatter plots are invaluable for business analysts, revealing insights into relationships between different business metrics. Google Sheets offers a straightforward way to create these plots.
This guide will walk you through creating a scatter plot, using a relatable business operations example: correlating marketing spend with sales revenue.
Understanding Scatter Plots
Basics of Scatter Plots
A scatter plot is a type of graphical representation that displays data points on a two-dimensional graph. Each point represents an observation of two variables, one on the horizontal axis (X) and the other on the vertical axis (Y).
Scatter plots help recognize and understand patterns, trends, and correlations between the two variables, making them a useful tool for data analysis.
Scatter Plots vs Other Charts
Scatter plots have some key differentiators from other types of charts:
- Pattern Recognition: Scatter plots are particularly useful for identifying patterns, trends, or outliers in data. This is in contrast to other charts like bar or line graphs, which primarily depict changes or trends over time.
- Correlation Assessment: One of the main advantages of scatter plots is their ability to display the relationship between two variables. This may not be easily discernible in other chart types, such as pie charts or bar graphs.
- Multiple Levels of Data: Scatter plots can also display multiple levels of data with different shapes, sizes, or colors, offering a comprehensive view of complex datasets, whereas other chart types may only depict a single layer of information.
How to Create Scatter Plots in Google Sheets
Setting up Data
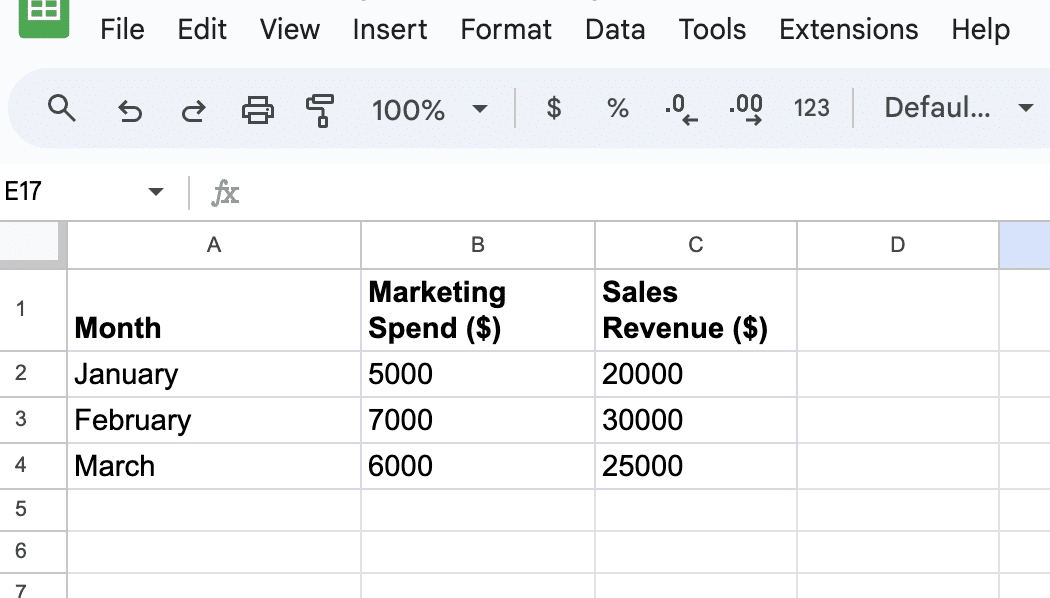
Before creating a scatter plot in Google Sheets, ensure that your data is properly formatted. Scatter plots require two columns of data, one representing the x-axis and the other representing the y-axis.
For example, consider the table below, which depicts how marketing investments impact sales.
Inserting a Scatter Plot
To insert a scatter plot into your spreadsheet, follow these steps:
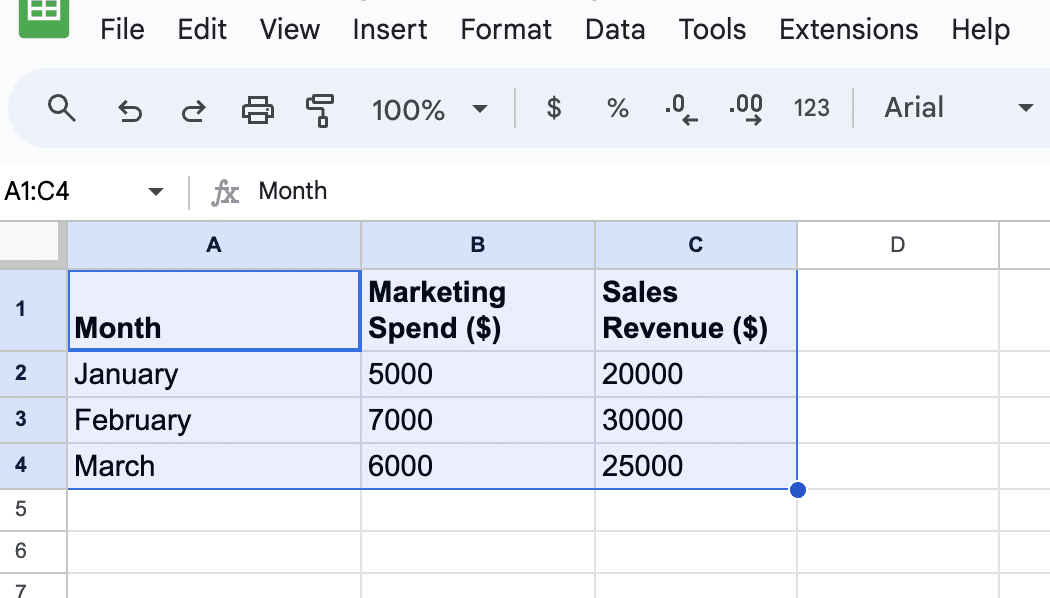
- Highlight both columns of your data, including the header row.
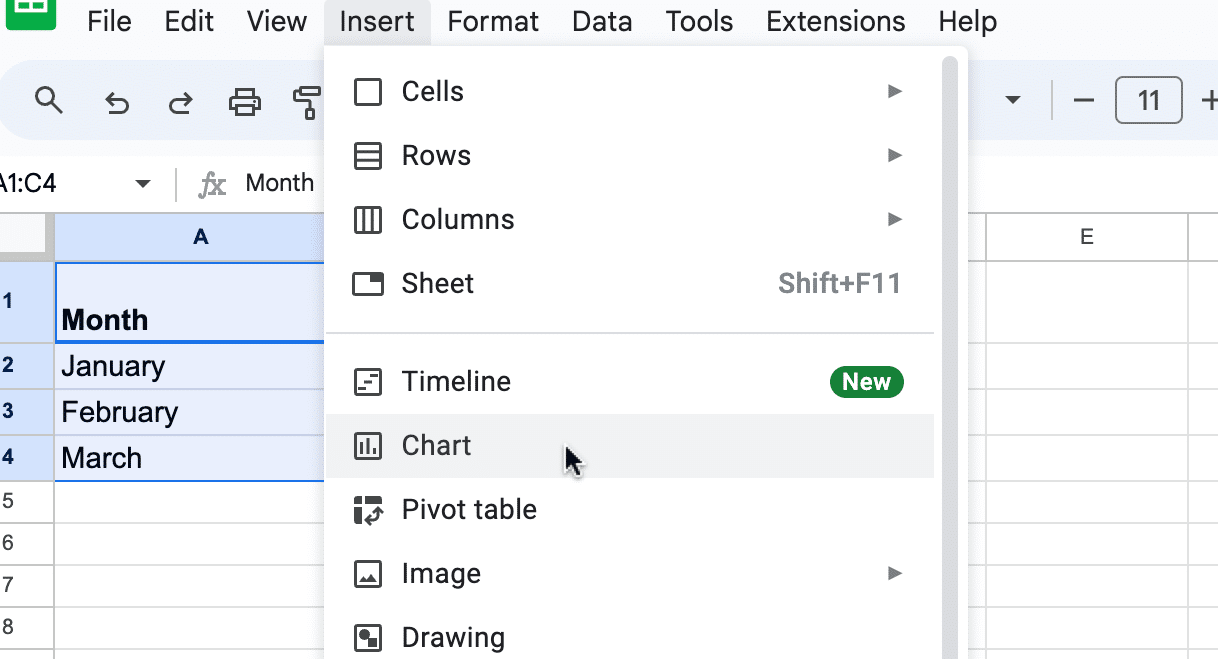
Click the Insert menu at the top left of the window.
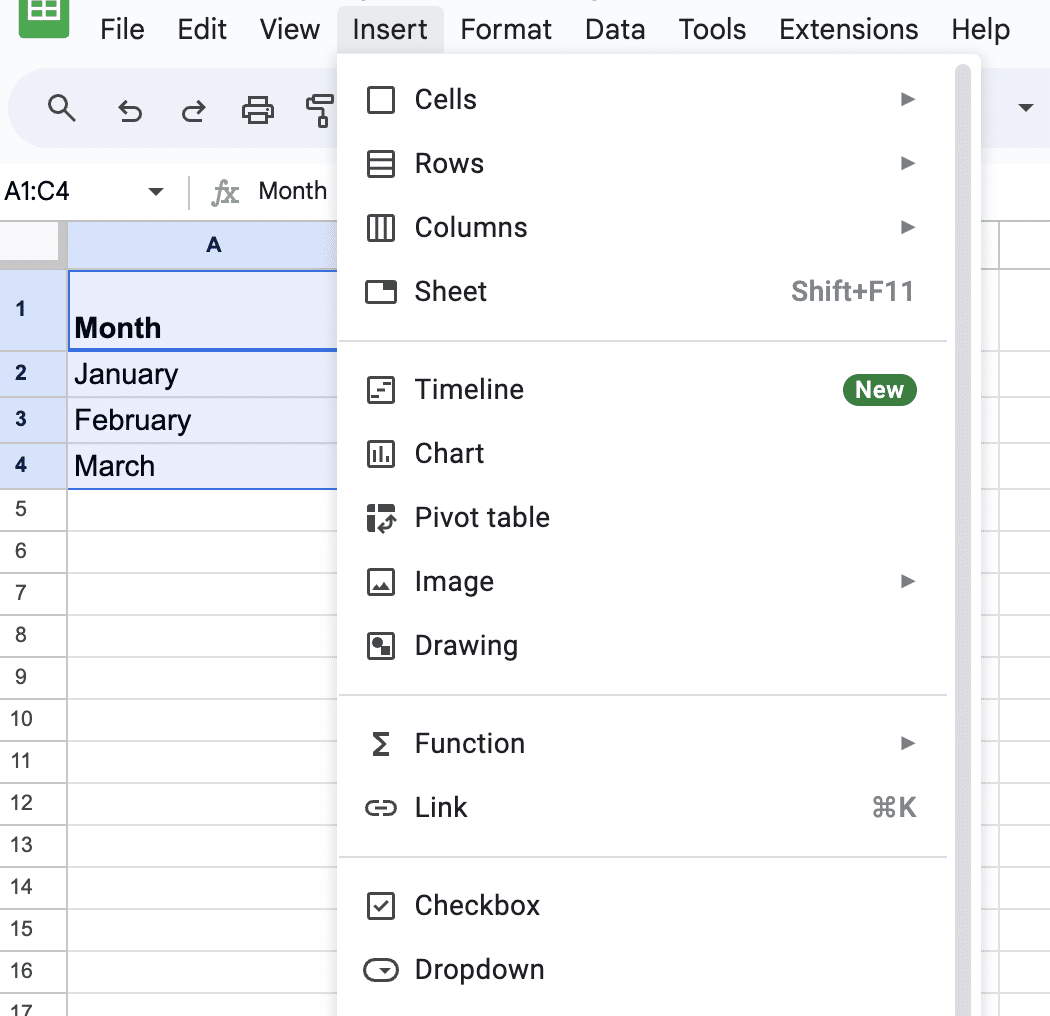
Select Chart from the drop-down list.
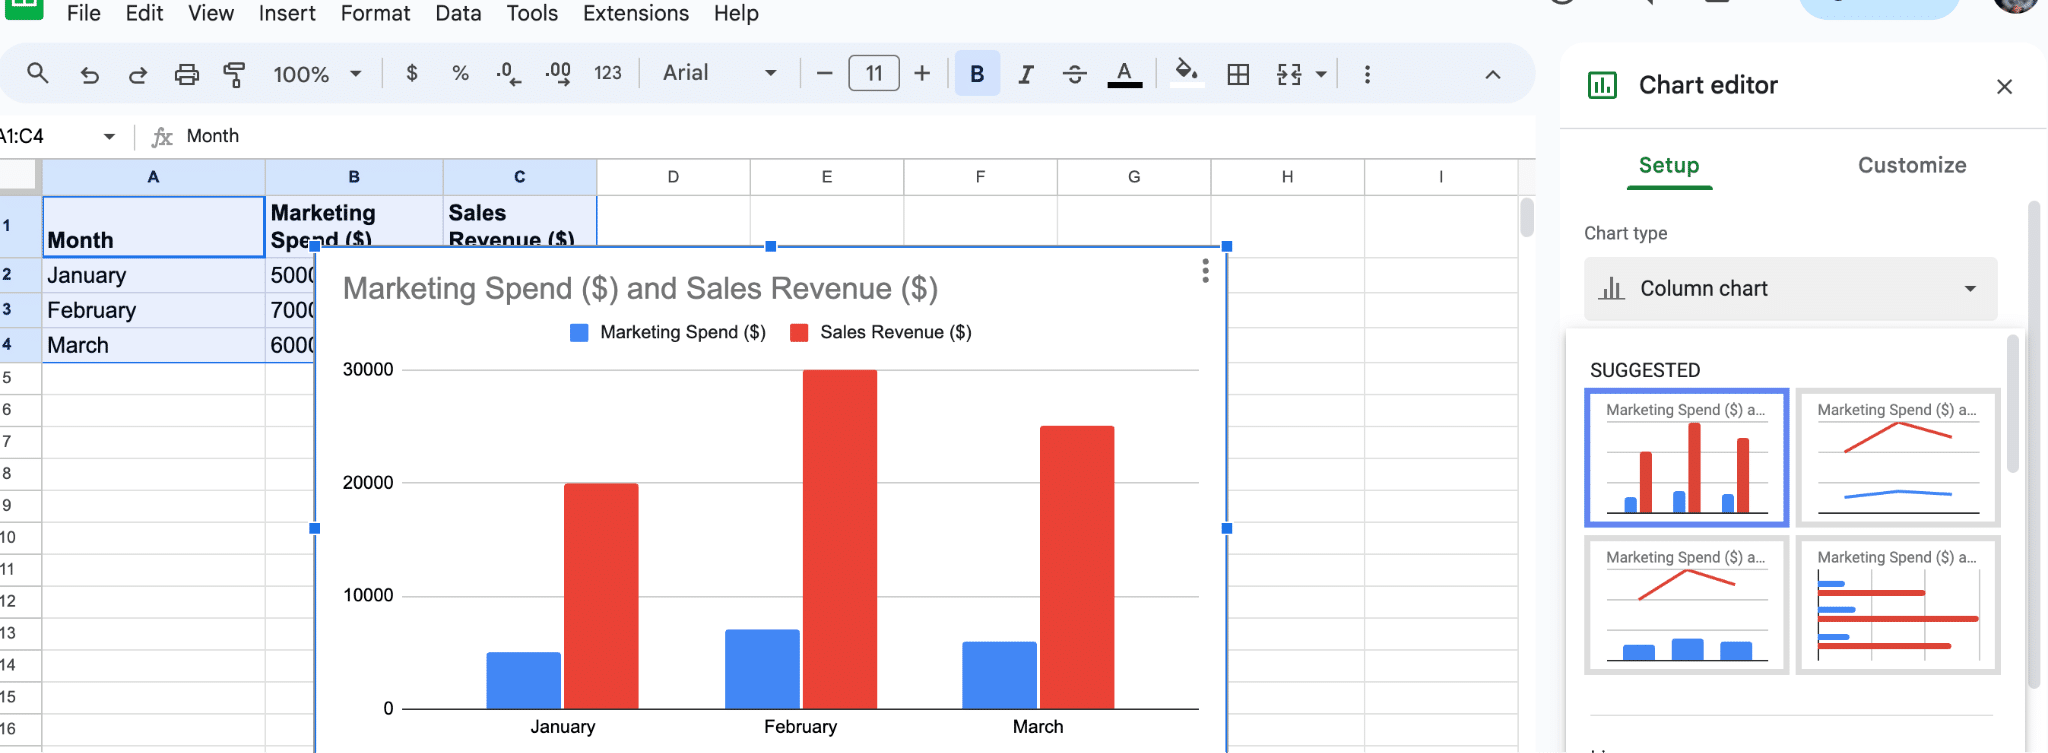
Initially, Google Sheets might display a different type of chart, like a bar chart.

Supercharge your spreadsheets with GPT-powered AI tools for building formulas, charts, pivots, SQL and more. Simple prompts for automatic generation.

To change this, follow these steps:
- In the Chart editor panel that appears on the right side of the screen, click the Chart type dropdown.
Choose Scatter chart from the list of options.
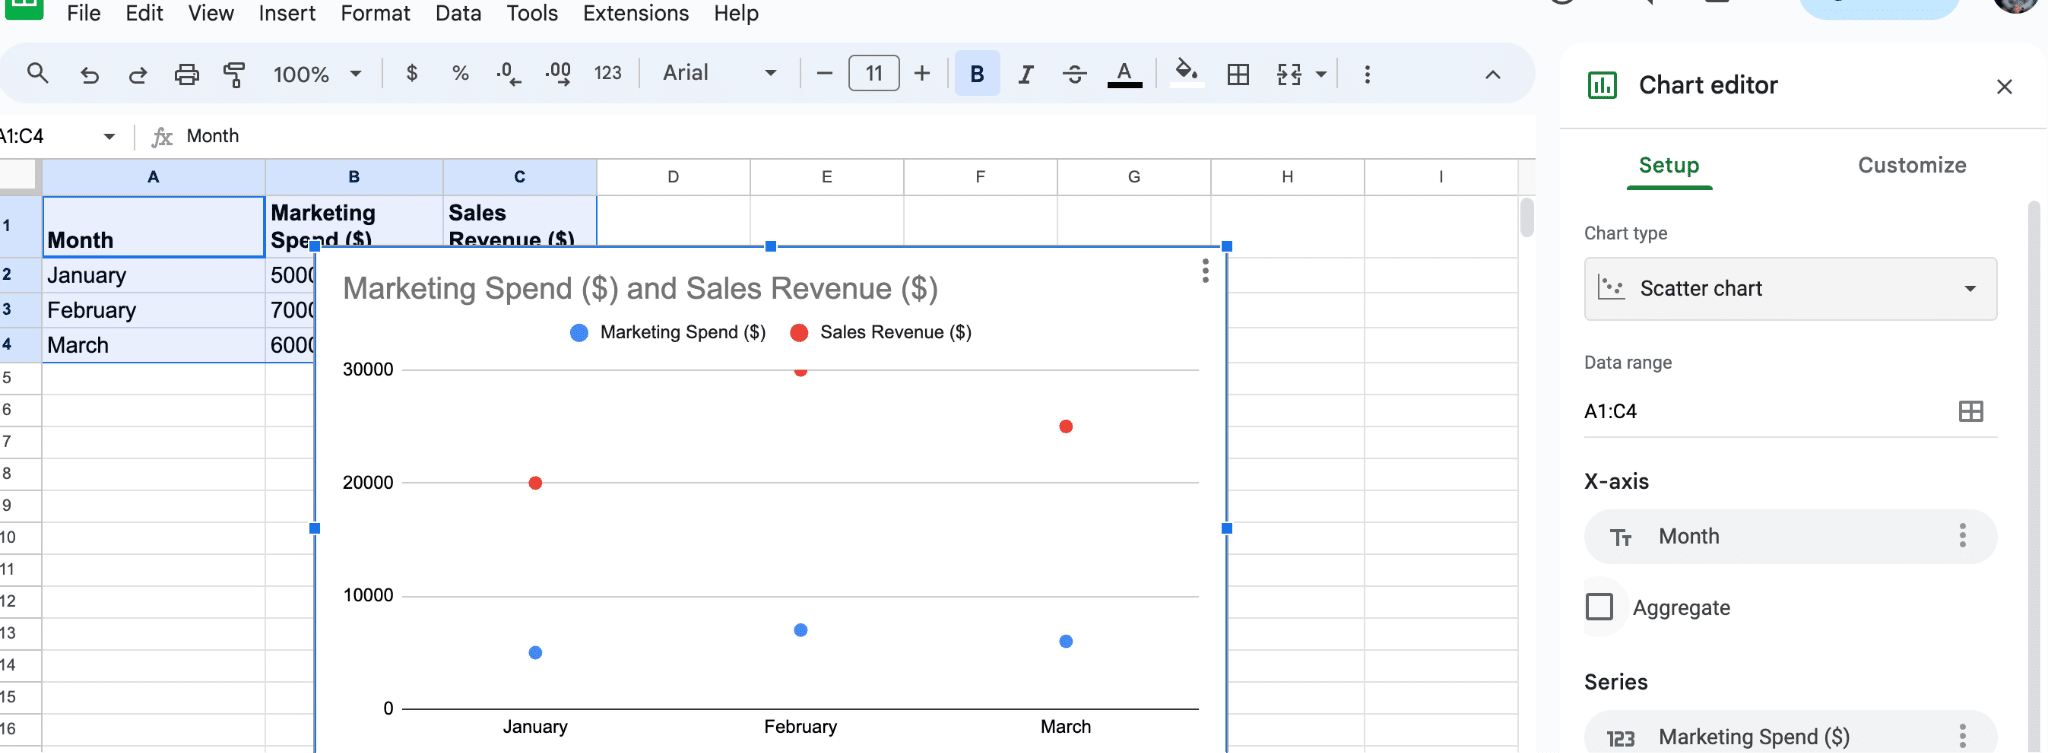
Now, your scatter plot should appear on the sheet, displaying the data points according to the values you provided.
Customizing the Scatter Plot
You can customize your scatter plot to provide additional insights and clarity.
The Chart editor panel offers several options to modify the appearance and functionality of your scatter plot:
- Customize → Chart style: Change the plot’s background color, font, and overall appearance.
- Customize → Chart & axis titles: Edit the chart title, axis titles, and their respective styles (size, format, and color).
- Customize → Series: Modify the point shape, size, and color for each data series.
Conclusion
Scatter plots in Google Sheets are powerful tools for business analysis. By following these steps, you can create meaningful visualizations to inform your business strategies.
Enhance your Google Sheets with Coefficient for real-time business data integration.


