Calculating variance is an essential statistical function that allows users to measure the spread or dispersion within a dataset. Variance indicates how much the individual data points differ from the average value.
In Google Sheets, the process of calculating variance is simplified by built-in functions that can evaluate both a sample and an entire population’s variance.
Understanding Variance in Google Sheets
Variance is a fundamental statistical function that measures the dispersion of a data set around its mean value. In Google Sheets, understanding and calculating variance can be pivotal for any statistical analysis.
Concept of Variance
Variance quantifies how much a data set diverges from the average value. It is calculated by taking the average of the squared differences from the Mean. In a sheet, each element of the dataset contributes to the overall variance, providing insights into the dataset’s spread out.
Difference Between Sample and Population Variance
In statistics, there are two types of variance: sample variance and population variance. Sample variance ((s^2)) is used when analyzing a subset of the total dataset (sample), whereas population variance ((\sigma^2)) is used when evaluating the entire dataset (population). Google Sheets offers functions to calculate both, allowing users to compare variability within different scopes of their data.
Relation Between Standard Deviation and Variance
Standard deviation is the square root of variance and provides a measure of variability in the same units as the data. While variance squares the units of data, standard deviation provides a more tangible measure of dispersion, making it simpler to interpret the variability within a dataset.
Relevance of Mean and Average Value
The relevance of the mean, or the average value, lies in its role as the reference point for calculating variance. In a data set within Google Sheets, the mean is the sum of all values divided by their count. Variance then measures how each value in the data set deviates from this average, forming the foundation of many other statistical analyses designed to assess the consistency and predictability of data distributions.
Step-by-Step Variance Calculation
Calculating variance in Google Sheets allows users to measure the spread of numeric values around the mean within a data set. It’s crucial to distinguish between the variance of a sample and the entire population, as each requires a different function in Google Sheets.
Using the VAR or VAR.S Function
When working with a sample of data points, the VAR or VAR.S function is suitable for determining sample variance. The syntax requires specifying the range or array of numbers as arguments. For example:

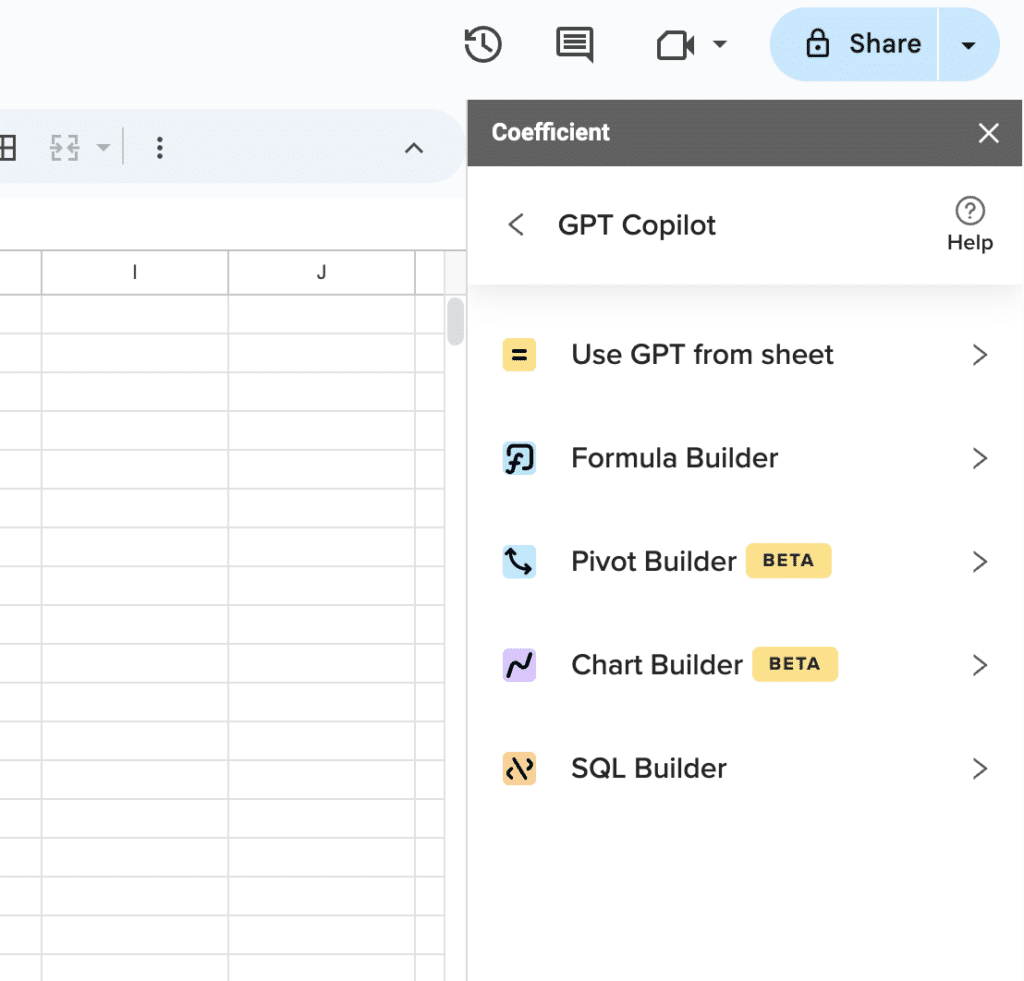
Supercharge your spreadsheets with GPT-powered AI tools for building formulas, charts, pivots, SQL and more. Simple prompts for automatic generation.

- Enter =VAR.S(range) into a cell.
- Replace range with actual cell references, such as A1:A10.
- Press Enter to view the variance of the sample data.
Using the VARP or VAR.P Function
To calculate the variance for the entire population, one should use the VARP or VAR.P function. This formula takes the same arguments as VAR.S. Here is how it’s applied:
- Type =VAR.P(range) in a cell of the spreadsheet.
- Substitute range with the relevant cells, like B1:B20.
- Hit Enter to obtain the population variance.
Manual Variance Calculation Method
A manual approach may be used for an in-depth understanding of the deviation calculation:
- Calculate the mean by using =AVERAGE(number1, [number2], …).
- For each number in the data set, subtract the mean and square the result.
- Average the squared differences by using =AVERAGE(result1, [result2], …).
- Insert these formulas within your sheet manually, referencing the correct cells.
Conclusion
Mastering variance in Google Sheets is easy and essential for data analysis in B2B SaaS companies. Use these simple steps to enhance your statistical skills.
Ready to streamline your data workflow? Install Coefficient for seamless data integration in Google Sheets.


