Google Sheets makes calculating the Internal Rate of Return (IRR) straightforward. In this guide, you’ll learn how to use the IRR formula, essential for any financial analysis.
Whether you’re evaluating investments or comparing project returns, this skill is invaluable, especially for business operations teams in B2B SaaS companies.
Understanding IRR
Definition of IRR
IRR stands for Internal Rate of Return. It is a financial metric that measures the profitability of an investment. In simpler terms, IRR is the rate at which an investment breaks even.
Importance of IRR in Financial Analysis
IRR is an important metric in financial analysis because it helps investors determine the profitability of an investment. A higher IRR indicates a more profitable investment, while a lower IRR indicates a less profitable investment.
In addition, IRR is also used in capital budgeting to evaluate the potential return on investment for a project. By comparing the IRR of different projects, companies can determine which projects are worth investing in and which ones should be avoided.
Overall, understanding IRR is crucial for investors and financial analysts to make informed decisions about their investments. In the next section, we will discuss how to calculate IRR in Google Sheets.
Calculating IRR in Google Sheets
Calculating the internal rate of return (IRR) is an important tool for evaluating the profitability of an investment. Google Sheets provides a built-in IRR function that makes it easy to calculate this metric.
In this section, we will outline the steps required to calculate IRR in Google Sheets.
Preparing the Cash Flow Data
Before using the IRR function, it is necessary to prepare the cash flow data. This data should include all the incoming and outgoing payments related to the investment.
The range of cells containing this data must include at least one positive value (income) and one negative value (payment). It is important to ensure that the values are in the correct order of cash flow.
One way to prepare the cash flow data is to create a table with columns for the date, description, cash in, and cash out. This table can then be used to calculate the net cash flow for each period.
Once the net cash flow has been calculated, it can be entered into the IRR function.
Using the IRR Function
The IRR function in Google Sheets has a simple syntax. The function takes two arguments: the range of cells containing the cash flow data and an optional estimate for the expected IRR. The syntax for the IRR function is as follows:

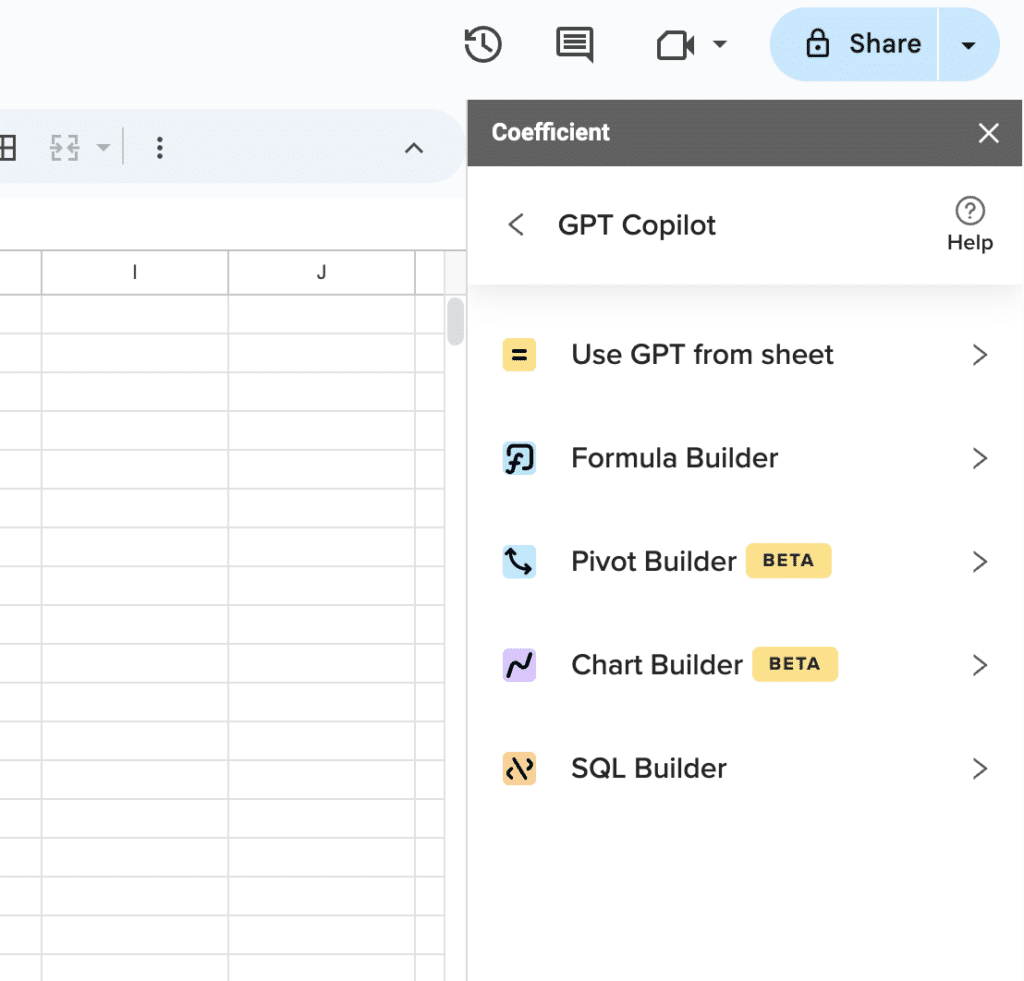
Supercharge your spreadsheets with GPT-powered AI tools for building formulas, charts, pivots, SQL and more. Simple prompts for automatic generation.

=IRR(cashflow_values, [rate_guess])
The cashflow_values argument is the range of cells that contain the outgoing and incoming payments relating to the return of investment. The rate_guess argument is an estimate for the expected IRR. This parameter is optional.
Analyzing the Results
Once the IRR function has been used to calculate the internal rate of return, it is important to analyze the results.
A positive IRR indicates that the investment is profitable, while a negative IRR indicates that the investment is not profitable. The higher the IRR, the more profitable the investment.
It is also important to consider other factors when analyzing the results of the IRR calculation.
For example, the IRR does not take into account the time value of money or the risk associated with the investment. Therefore, it is important to use the IRR in conjunction with other financial metrics to evaluate the investment.
Conclusion
With these simple steps, calculating IRR in Google Sheets is quick and efficient. It’s a skill that enhances your financial analysis, aiding in better investment decisions.
Ready to take your Google Sheets skills further? Check out Coefficient for advanced data integration and analysis tools.


