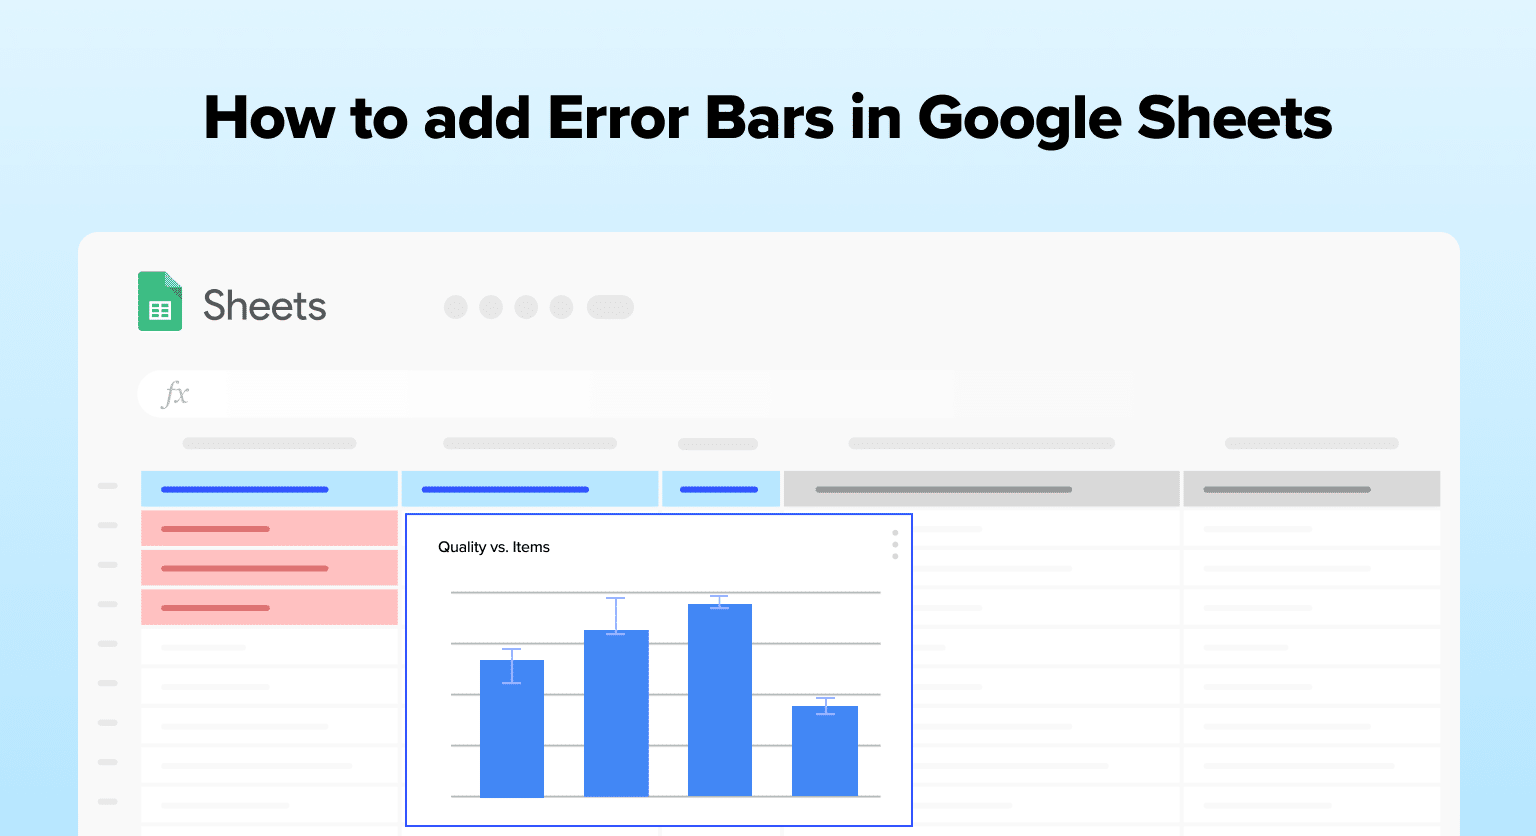
Understanding the uncertainty in your data is critical for precise data analysis. Google Sheets simplifies this process by providing straightforward tools to add error bars to your charts.
In this guide, you’ll learn how to insert error bars to represent data variability and customize them to convey a more accurate picture of your data’s reliability.
Understanding Error Bars
Error bars are graphical representations of the variability of data and are used to indicate the error or uncertainties of reported measurements. They are a useful tool for understanding the accuracy and precision of data points in a chart.
Purpose of Error Bars
The main purpose of error bars is to show the amount of uncertainty or variability in the data.
They are used to display the range of values that the data could have taken, given the measurement error. Error bars can also be used to compare different sets of data and to determine whether the differences between them are statistically significant.
Types of Error Bars
Several types of error bars can be added to a chart in Google Sheets.
Standard Error Bars
Standard error bars are the most commonly used type of error bars. They are based on the standard deviation of the data and show the amount of variability in the data around the mean.
Confidence Interval Bars
Confidence interval bars are similar to standard error bars, but they are based on the confidence interval of the data. They show the range of values that the data could have taken, given the measurement error and the sample size.
Standard Deviation Bars
Standard deviation bars show the amount of variability in the data around the mean, similar to standard error bars. However, they are based on the actual standard deviation of the data rather than an estimate of it.
Custom Error Bars
Custom error bars allow users to specify their own values for the error bars, rather than using the built-in options. This can be useful for displaying specific types of data or for creating custom charts.
Adding Error Bars in Google Sheets
Google Sheets is a powerful tool for data analysis and visualization. One of the key features of Google Sheets is the ability to add error bars to charts. Error bars can help to show the variability of data and provide context for the results.
Preparation of Data
Before adding error bars to a chart in Google Sheets, it is important to ensure that the data is properly formatted. The data should be organized in columns or rows, with each column or row representing a different variable.
In the example below, a company is tracking the average number of units sold over a week. The error bars could represent the standard deviation, indicating the variability in units sold each day.

Inserting Chart
To add error bars to a chart in Google Sheets, first select the data that you want to use for the chart.

Then, click on the “Insert” menu and select “Chart.”

This will bring up the chart editor, where you can select the type of chart that you want to create.

Supercharge your spreadsheets with GPT-powered AI tools for building formulas, charts, pivots, SQL and more. Simple prompts for automatic generation.


Add Error Bars with Custom Values
Once you have created your chart, you can customize the error bars to show the variability of your data.
To do this, click on the chart to select it, then click on the “Customize” tab in the chart editor.

Scroll down to “Series” and select it.

Look for “Error bars” and click the box.

Select “Standard Deviation” from the drop-down under “Type.”

Use the data from the “Standard Deviation” column to display error bars.

Adjust the color and style of the error bars as needed.
Conclusion
Adding error bars to a chart in Google Sheets is a simple and effective way to show the variability of your data.
By properly preparing your data, inserting a chart, and customizing the error bars, you can create a clear and informative visualization that will help to convey the results of your analysis.
For more advanced data analytics with your business data, consider exploring Coefficient!


