
Struggling to analyze data spread across rows in Google Sheets? HLOOKUP is the solution you need.
This guide dives into the HLOOKUP function, making horizontal data lookups straightforward and efficient. You’ll quickly learn how to use this tool, streamlining your data analysis and saving valuable time.
Understanding the Mode Function in Google Sheets
When working with datasets in Google Sheets, identifying the most frequent value is a common statistical task. The MODE function serves this purpose, providing insights into the measures of central tendency of a given set of data.
Exploring the Definition of Mode
In the context of Google Sheets, the mode refers to the value that appears most frequently within a dataset. The application of the MODE function can reveal the most often occurring data point, which is an essential piece of information for statistical analysis.
To invoke this function, one would use the following syntax: =MODE(value1, value2,…) where the values represent the dataset being analyzed.
Differences Between Mode.Mult and Mode.Sngl Functions
Google Sheets offers two variations of the MODE function: MODE.MULT and MODE.SNGL.
- MODE.MULT: This function is designed to return all of the most frequently occurring values in a dataset. It should be used when multiple modes exist and one needs to list all modes present. For example, the syntax =MODE.MULT(range) would output an array of the mode values.
- MODE.SNGL: In contrast, MODE.SNGL will identify a single most frequently occurring value. When multiple modes exist, MODE.SNGL will only return the first mode encountered. This function is used with the syntax =MODE.SNGL(range).
Understanding the appropriate application between MODE.MULT and MODE.SNGL is key to accurately capturing the frequently occurring value or values in the dataset and depends on whether one seeks a single answer or all possible modes.
Applying Mode Functions to Analyze Data
The MODE function in Google Sheets serves as a powerful tool to pinpoint the most frequently occurring number in a dataset, a capability essential for statistical analysis and insights.
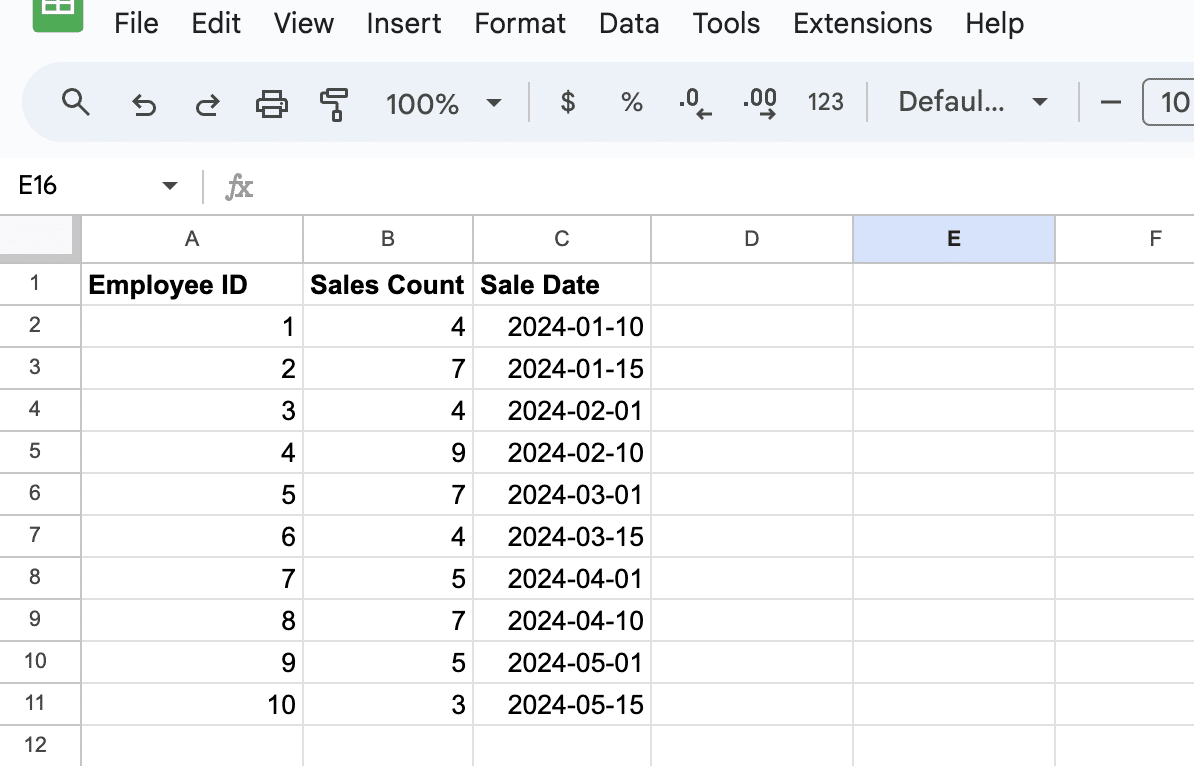
To illustrate how the MODE function works, let’s consider a sample dataset that includes sales information: “Employee ID,” “Sales Count,” and “Sale Date.”
Step-by-Step Guide to Using Mode Functions
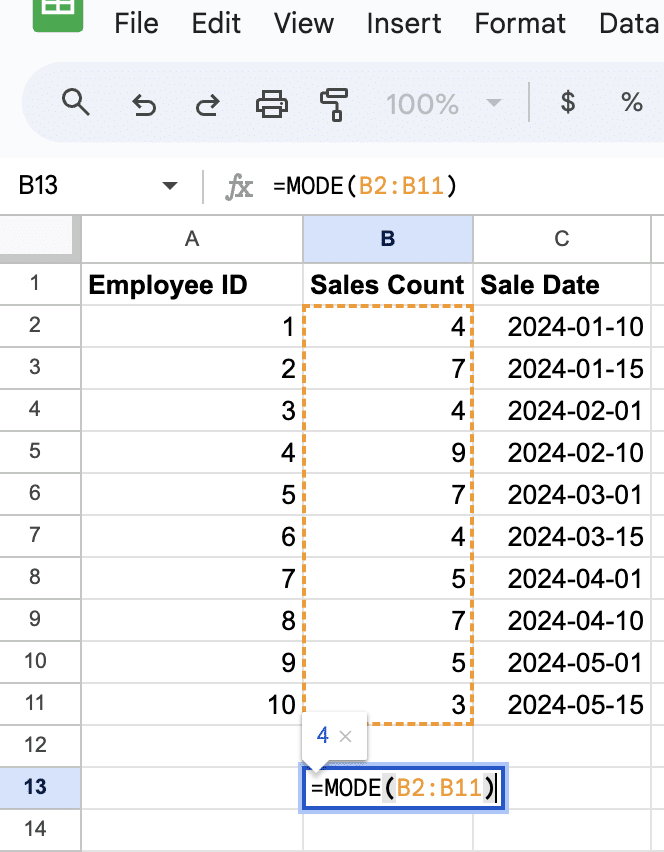
MODE for “Sales Count”: To find the most common sales count, we use =MODE(B2:B11). This formula sifts through the “Sales Count” column to identify the number that appears most frequently.

Supercharge your spreadsheets with GPT-powered AI tools for building formulas, charts, pivots, SQL and more. Simple prompts for automatic generation.

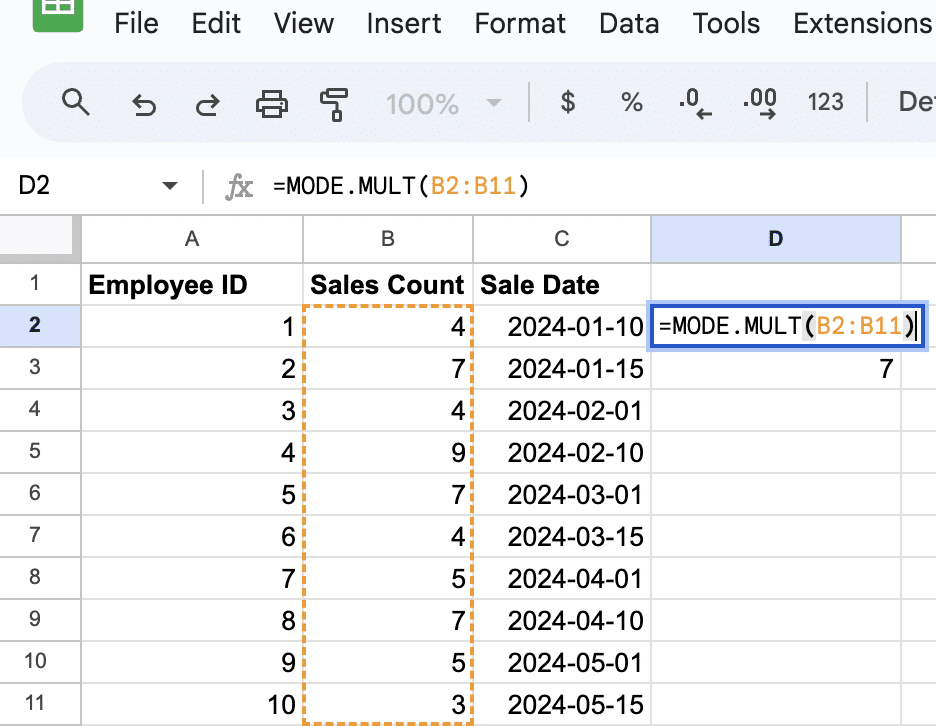
MODE.MULT for “Sales Count”: When multiple sales counts tie for the most common, =MODE.MULT(B2:B11) helps list all such values, providing a comprehensive view of common sales figures.
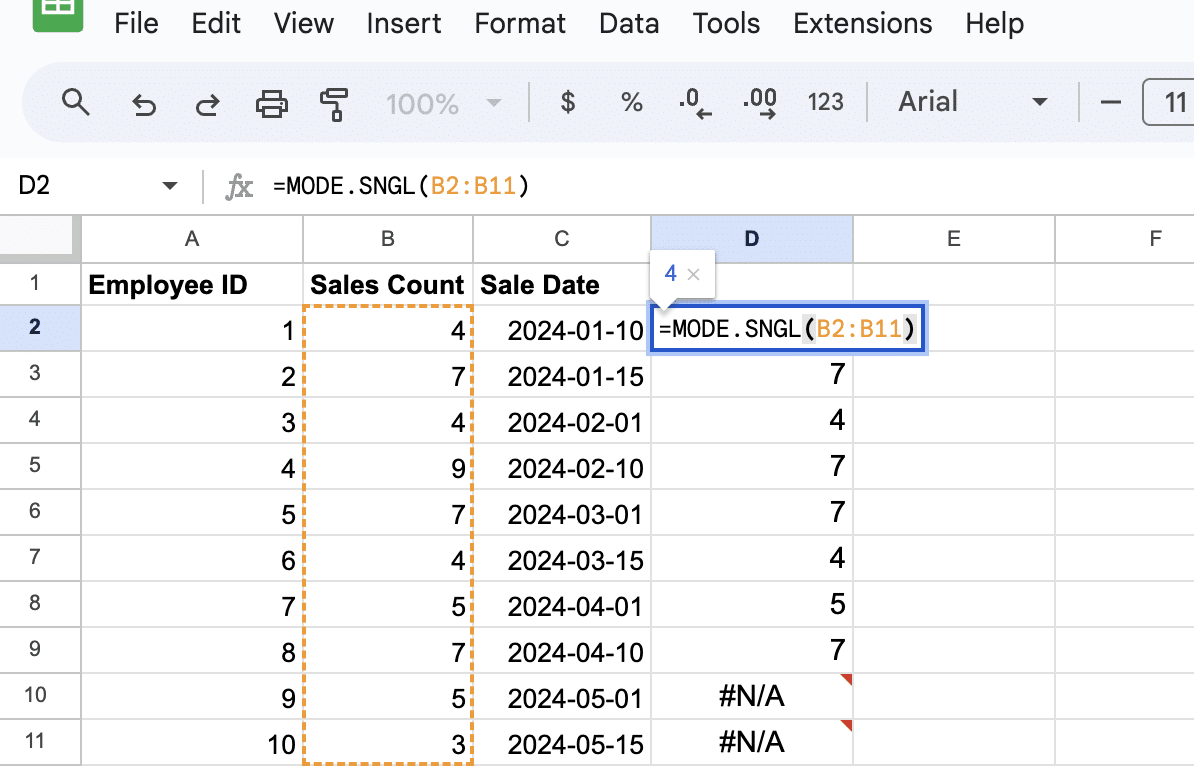
MODE.SNGL for “Sales Count”: If you prefer to identify just the first most common sales count encountered, =MODE.SNGL(B2:B11) is the function to use, simplifying the analysis when a single mode is sufficient.
Working with Numerical and Date Data Types
Google Sheets interprets dates as numbers, so you can use MODE functions with date values just as you would with numerical data. For instance, =MODE(C2:C11) identifies the most common sale date.
Conclusion
Mastering the MODE function in Google Sheets enhances your data analysis, allowing for efficient trend identification.
Ready to elevate your data management skills further? Explore Coefficient for seamless data integration and advanced reporting solutions.


