
Variance is a fundamental concept in statistics that helps us understand how data points spread out from their average. Whether you’re a student, researcher, or professional working with data, knowing how to calculate and interpret variance is crucial. This guide will walk you through the process, providing clear explanations, practical examples, and useful tools to make variance calculation a breeze.
Types of Variance Functions in Google Sheets
Google Sheets offers two main variance functions:
Population Variance: VAR.P()
Use VAR.P() when you have data for an entire population. The syntax is:
=VAR.P(number1, [number2, …])
Sample Variance: VAR.S()
Use VAR.S() when working with a sample of a larger population. The syntax is:
=VAR.S(number1, [number2, …])
Calculating Variance in Google Sheets: Step-by-Step Guide
Let’s walk through the process of calculating variance using Google Sheets functions.
Step 1: Prepare Your Data
First, enter your data into a Google Sheets column. For example:
| A | B |
| Data | |
| 10 | |
| 15 | |
| 20 | |
| 25 | |
| 30 |
Step 2: Use the Built-in Variance Functions
Google Sheets provides easy-to-use functions for both population and sample variance.
Population Variance
To calculate population variance, use the VAR.P() function:
- Click an empty cell (e.g., B1)
- Type =VAR.P(

- Select your data range (e.g., A2:A6)
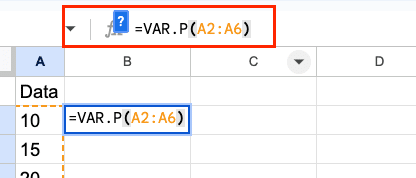
- Close the parenthesis and press Enter
Your formula should look like this:
=VAR.P(A2:A6)
Sample Variance
For sample variance, use the VAR.S() function:
- Click an empty cell (e.g., B2)
- Type =VAR.S(
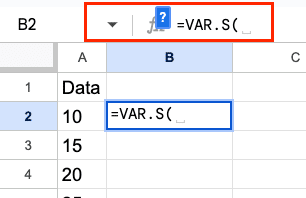
- Select your data range (e.g., A2:A6)
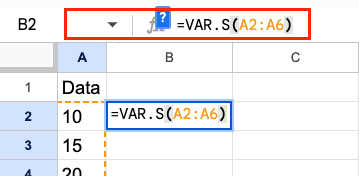
- Close the parenthesis and press Enter

Your formula should look like this:
=VAR.S(A2:A6)
After applying these formulas, your sheet might look like this:
| A | B |
| Data | Variance |
| 10 | 50 (Population) |
| 15 | 62.5 (Sample) |
| 20 | |
| 25 | |
| 30 |
Step 3: Interpret the Results
The results in cells B1 and B2 represent the population and sample variance, respectively. A larger value indicates greater data spread, while a smaller value suggests data points are closer to the mean.
Manual Calculation in Google Sheets
For educational purposes or to understand the process better, you can calculate variance manually in Google Sheets:
- Calculate the mean: In cell C1, enter: =AVERAGE(A2:A6)

- Calculate deviations from the mean: In cell B2, enter: =A2-$C$1 Drag the formula down to B6

- Square the deviations: In cell C2, enter: =B2^2 Drag the formula down to C6

- Sum the squared deviations: In cell D1, enter: =SUM(C2:C6)

- Divide by n or n-1: For population variance (in E1): =D1/COUNT(A2:A6) For sample variance (in E2): =D1/(COUNT(A2:A6)-1)


Your sheet might now look like this:
| A | B | C | D | E |
| Data | Deviation | Squared Dev | Sum | Variance |
| 10 | -10 | 100 | 250 | 50 (Population) |
| 15 | -5 | 25 | 62.5 (Sample) | |
| 20 | 0 | 0 | ||
| 25 | 5 | 25 | ||
| 30 | 10 | 100 |
Practical Examples in Google Sheets
Let’s look at some real-world examples of calculating variance in Google Sheets.
Example 1: Stock Price Volatility
Suppose you’re analyzing the closing prices of a stock over 10 days:
| A | B |
| Date | Closing Price |
| 1-Jun | 100 |
| 2-Jun | 102 |
| 3-Jun | 98 |
| 4-Jun | 103 |
| 5-Jun | 99 |
| 6-Jun | 101 |
| 7-Jun | 97 |
| 8-Jun | 104 |
| 9-Jun | 100 |
| 10-Jun | 102 |
To calculate sample variance: In cell C1, enter: =VAR.S(B2:B11)

To calculate population variance: In cell C2, enter: =VAR.P(B2:B11)

The results should be approximately 4.93 (sample) and 4.44 (population).
Example 2: Manufacturing Quality Control
A factory produces widgets with a target weight of 50 grams. To check consistency, they weigh 12 randomly selected widgets:
| A | B |
| Widget | Weight (g) |
| 1 | 49.8 |
| 2 | 50.2 |
| 3 | 50.0 |
| 4 | 50.1 |
| 5 | 49.9 |
| 6 | 50.3 |
| 7 | 49.7 |
| 8 | 50.2 |
| 9 | 50.0 |
| 10 | 49.8 |
| 11 | 50.1 |
| 12 | 50.0 |
Calculate sample variance: In cell C1, enter: =VAR.S(B2:B13)

The result should be approximately 0.0336, suggesting a consistent manufacturing process.
Advanced Variance Techniques in Google Sheets
Using ARRAYFORMULA for Efficient Calculations
When dealing with large datasets, you can use ARRAYFORMULA to calculate variance for multiple ranges simultaneously:
=ARRAYFORMULA(VAR.S(A1:A100, B1:B100, C1:C100))
This formula calculates the sample variance for each column (A, B, and C) in one go.
Creating a Dynamic Variance Dashboard
You can build a dynamic variance dashboard in Google Sheets:

Stop exporting data manually. Sync data from your business systems into Google Sheets or Excel with Coefficient and set it on a refresh schedule.
Get Started
- Create a dropdown menu for selecting data ranges: In cell A1, go to Data > Data validation and set up a list of options
- Use INDIRECT and INDEX functions to make your variance calculations dynamic: In cell B1, enter: =VAR.S(INDIRECT(A1))
This setup allows you to quickly switch between different data ranges and see the variance update automatically.
Variance Analysis with Pivot Tables
Pivot tables can help analyze variance across multiple dimensions:
- Select your data range
- Go to Insert > Pivot table

- Add relevant fields to rows and columns

- In the Values section, add your numeric field and change the summarize by option to “Variance“

This method allows you to quickly compare variances across different categories or time periods.
Demystifying Variance: What It Is and Why It Matters
Variance is a statistical measure that quantifies the spread of data points around their mean (average). It tells us how much our data deviates from the expected value. In simpler terms, variance helps us understand if our data points are tightly clustered or widely scattered.
The Significance of Variance
Why should we care about variance? Here are a few key reasons:
- Data distribution insights: Variance provides valuable information about how data is distributed, which is crucial for many statistical analyses.
- Risk assessment: In finance, variance helps measure the volatility of investments, aiding in risk management.
- Quality control: Manufacturing processes use variance to monitor product consistency and identify potential issues.
- Research reliability: Scientists use variance to evaluate the reliability of their experimental results.
Variance vs. Standard Deviation: Two Sides of the Same Coin
While variance and standard deviation are closely related, they serve different purposes:
- Variance is expressed in squared units of the original data, making it less intuitive to interpret.
- Standard deviation is the square root of variance, expressed in the same units as the original data, making it easier to understand in practical terms.
Both measures provide information about data spread, but standard deviation is often preferred for its interpretability.
Exploring Types of Variance: Population vs. Sample
Population Variance: The Complete Picture
Population variance applies when you have data for an entire population. It’s used when you have access to every possible data point in a dataset.
Key characteristics:
- Uses the symbol σ² (sigma squared)
- Divides by N (total number of data points)
- Provides a complete picture of data variability
Sample Variance: Making Inferences from a Subset
Sample variance is used when you have a subset of data from a larger population. It’s commonly used in real-world scenarios where collecting data from an entire population is impractical or impossible.
Key characteristics:
- Uses the symbol s²
- Divides by n-1 (number of data points minus one)
- Provides an estimate of population variance
- Accounts for sampling error
Choosing the Right Type: When to Use Each Variance
The choice between population and sample variance depends on your data and research goals:
- Use population variance when you have complete data for a finite population.
- Use sample variance when you’re working with a sample to make inferences about a larger population.
In most real-world scenarios, you’ll likely use sample variance, as it’s rare to have access to an entire population’s data.
Wrapping Up: Key Takeaways and Next Steps
Understanding how to calculate and interpret variance is a valuable skill in data analysis. Here’s a quick recap of what we’ve covered:
- Variance measures the spread of data points around their mean.
- There are two types of variance: population and sample.
- Calculating variance involves five main steps: finding the mean, calculating deviations, squaring deviations, summing squared deviations, and dividing by N or N-1.
- Various tools, from Excel to specialized statistical software, can help simplify variance calculations.
- Variance has important applications in finance, quality control, scientific research, and many other fields.
As you continue to work with data, remember that variance is just one tool in the statistical toolbox. To deepen your understanding of data analysis, consider exploring related concepts like standard deviation, correlation, and regression analysis.
Ready to put your new knowledge into practice? Try calculating the variance of a dataset relevant to your field or interests. The more you work with these concepts, the more comfortable and proficient you’ll become.
For more advanced data analysis tools and techniques, check out Coefficient. Our platform offers powerful solutions to help you extract meaningful insights from your data and make informed decisions.
Meta Title: Master Variance Calculation: Step-by-Step Guide with Examples
Meta Description: Learn how to calculate variance with our comprehensive guide. Understand formulas, see real-world examples, and discover tools to simplify your statistical analysis.


