Introduction (30-50 words): Exporting data from Databricks to Excel or other formats is a common task for data analysts and engineers. This guide will walk you through three efficient methods to export your Databricks data, ensuring you can easily access and analyze your information in your preferred format.
Top 3 Methods to Export Data from Databricks
- Coefficient: Seamlessly sync Databricks data to Google Sheets or Excel for real-time analysis and reporting.
- CSV Export: Manually export Databricks query results to CSV files for flexible data handling.
- Python Libraries: Use Python libraries like pandas and openpyxl to export data directly from Databricks to Excel.
Method 1. Coefficient: Real-Time Data Syncing
Coefficient offers a powerful solution for exporting data from Databricks to Excel or Google Sheets. This method provides real-time data syncing, automated report refreshing, and requires no coding knowledge.
Benefits of using Coefficient:
- Seamless real-time data syncing from Databricks to Google Sheets or Excel
- Automated report refreshing and distribution, saving time and reducing manual errors
- No coding required, making it accessible to users of all technical levels
- Ensures data accuracy with direct connections to Databricks
Step-by-step walkthrough:
Before we begin, make sure you have Coefficient installed in Excel. If you haven’t done so already, download and install the Coefficient add-in.
- Open Excel from your desktop or in Office Online. Click ‘File’ > ‘Get Add-ins’ > ‘More Add-Ins.’
- Type “Coefficient” in the search bar and click ‘Add.’
- Follow the prompts in the pop-up to complete the installation.
- Once finished, you will see a “Coefficient” tab in the top navigation bar. Click ‘Open Sidebar’ to launch Coefficient.
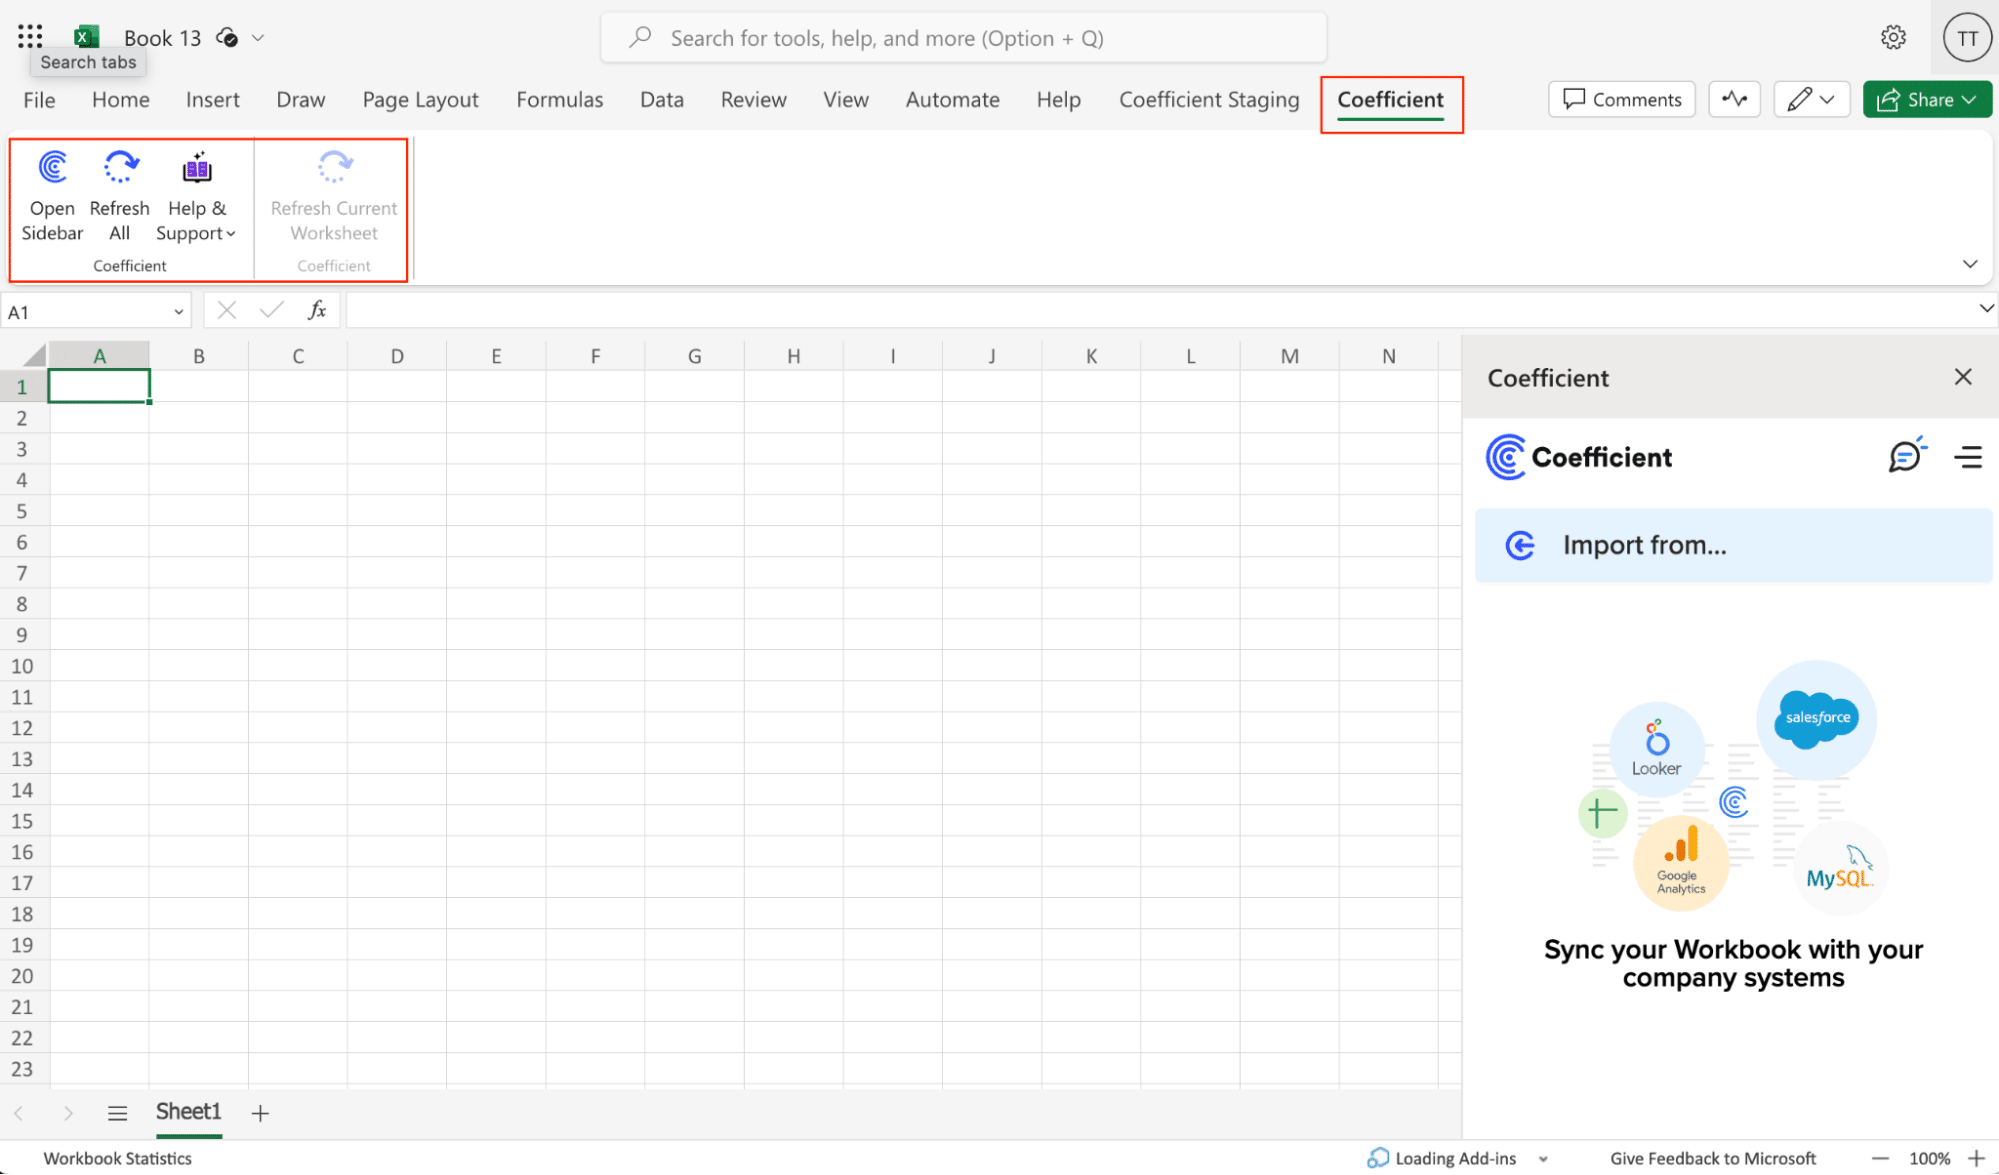
Step 1: Add Databricks as a data source in Coefficient
Click “Import from…” in the menu and choose “Databricks” from the list of available integrations.

Step2. Connect your Databricks account:
You’ll need to provide your Databricks JDBC URL and access token to authenticate the connection. Enter your information and click “Connect” to finalize the Databricks connection.

Note:
- For help obtaining your JDBC URL and Personal Access Token, click here.
- If you need help finding your “JDBC URL,” click here.
- If you need help generating your Personal Access Token, click here.
Step 3: Import Databricks data into Excel
Once connected, return to Databricks from the menu and select “From Tables and Columns.”
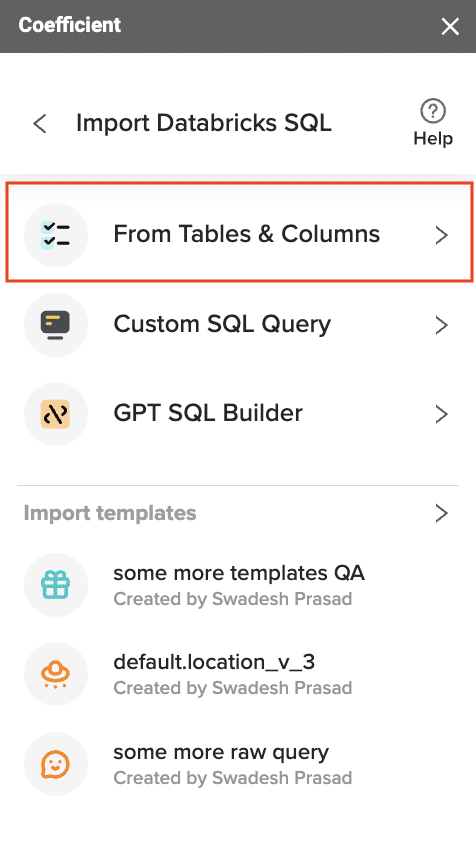
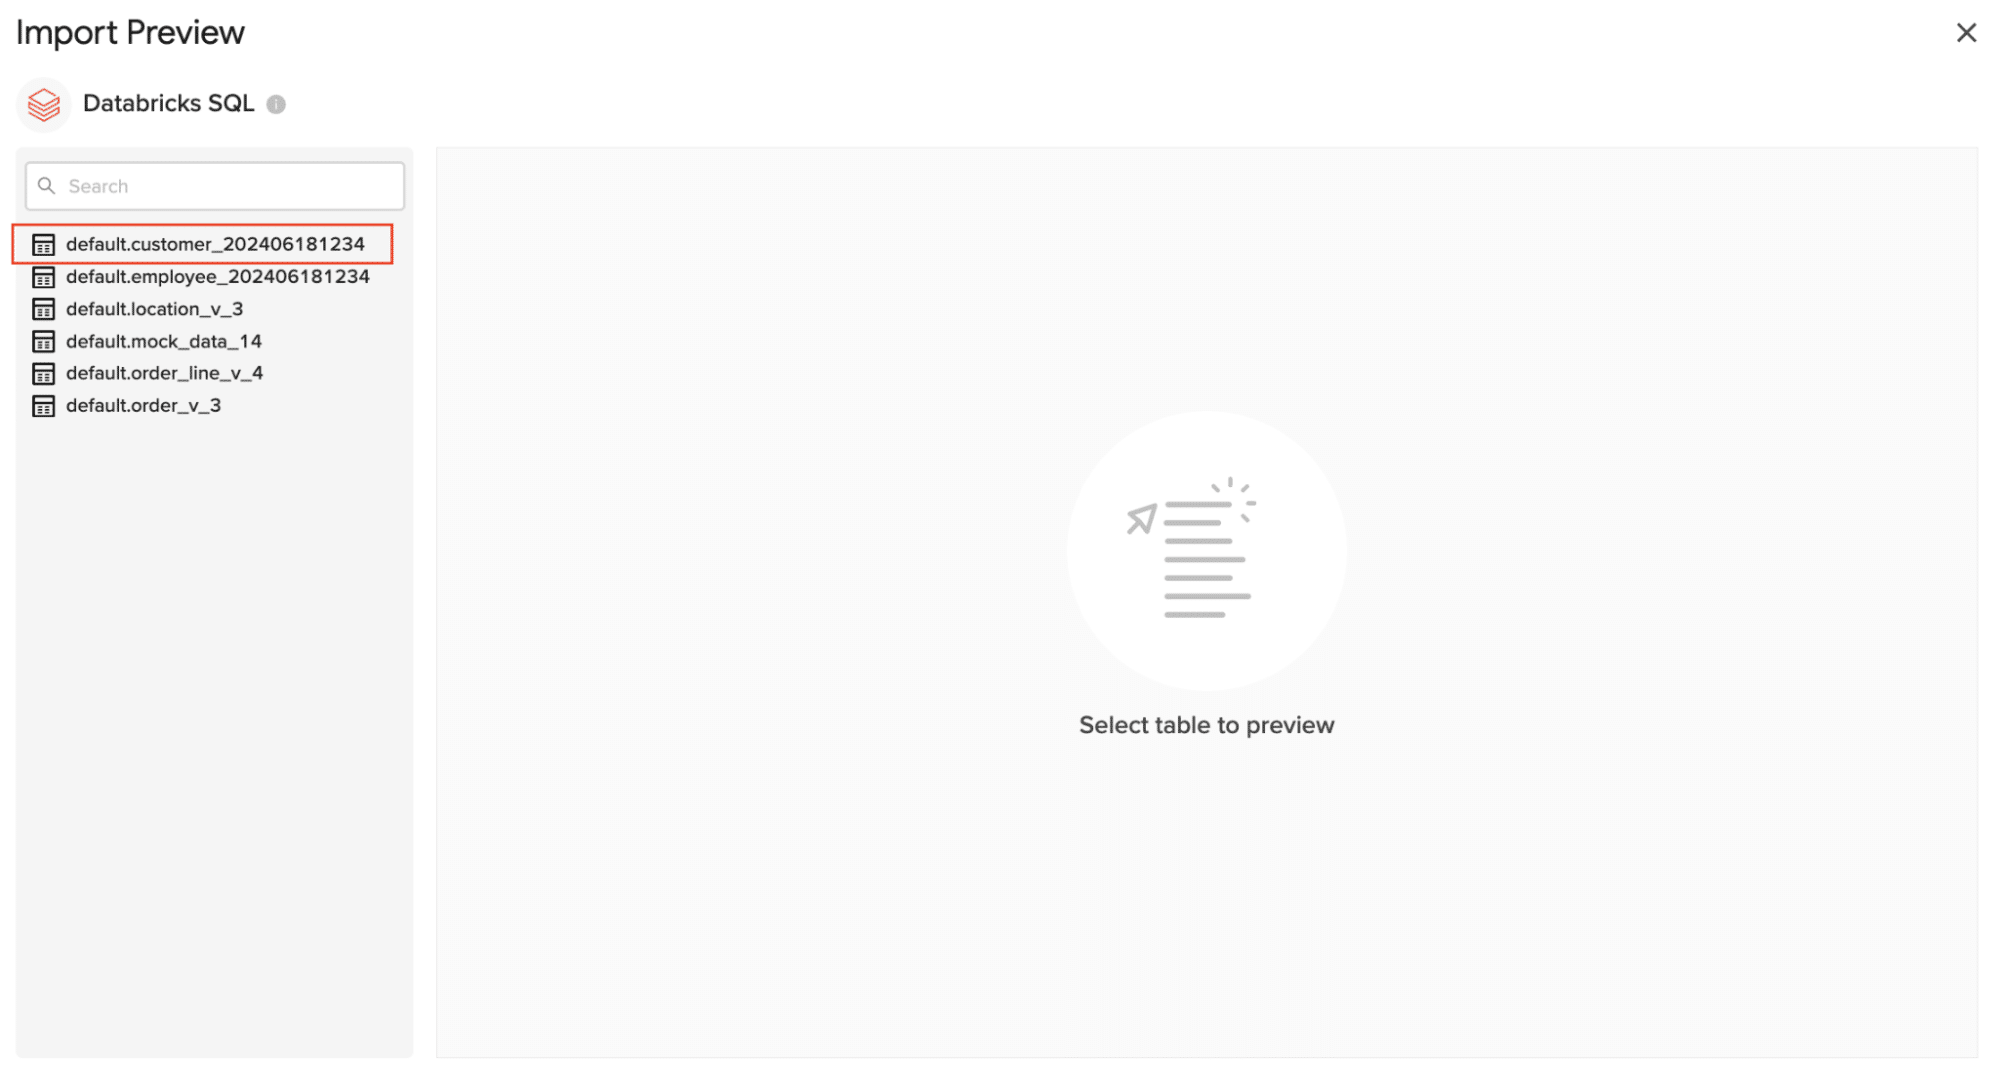
Select the table for your import from the available table schemas.
Once the table is selected, the fields within that table will appear in a list on the left side of the Import Preview window. Select the fields you want to include in your import by checking/unchecking the corresponding boxes.
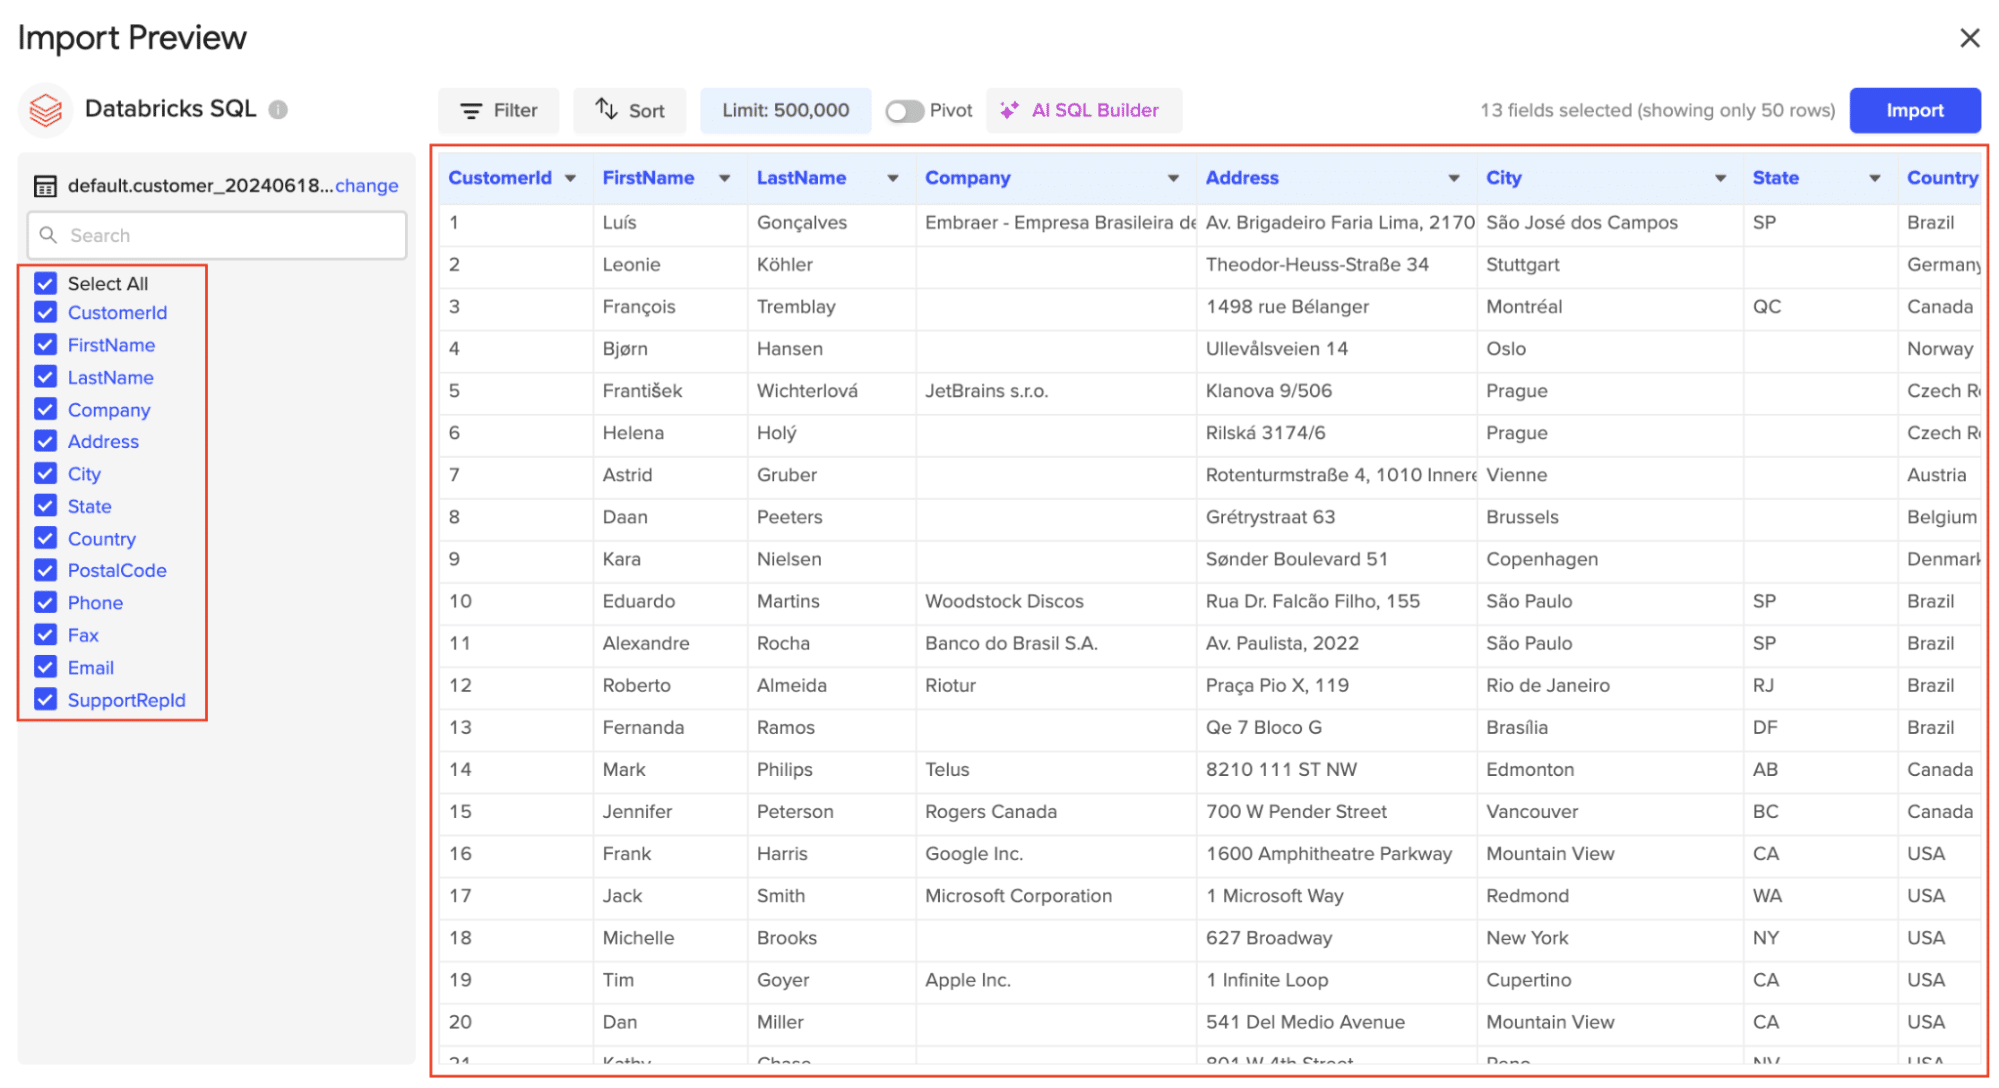
Click “Import” to pull the selected Databricks data into your spreadsheet.
Step 5: Set up auto-refresh for your Databricks data
Configure auto-refresh: Set up an auto-refresh schedule to keep your Databricks data up to date in Excel.
- Click on the Coefficient menu in Excel
- Select “Auto-refresh”
- Choose your preferred refresh frequency (hourly, daily, or weekly)
- Set a specific time for the refresh to occur

Method 2. CSV Export: Manual Data Transfer
The CSV export method is a straightforward approach to exporting data from Databricks. While it requires manual intervention, it offers flexibility in data handling and is suitable for one-time or infrequent exports.
Step-by-step walkthrough:
Step 1: Open your Databricks SQL workspace.
- Log in to your Databricks account and navigate to the SQL workspace.
- Ensure you have the necessary permissions to access and query the desired data.
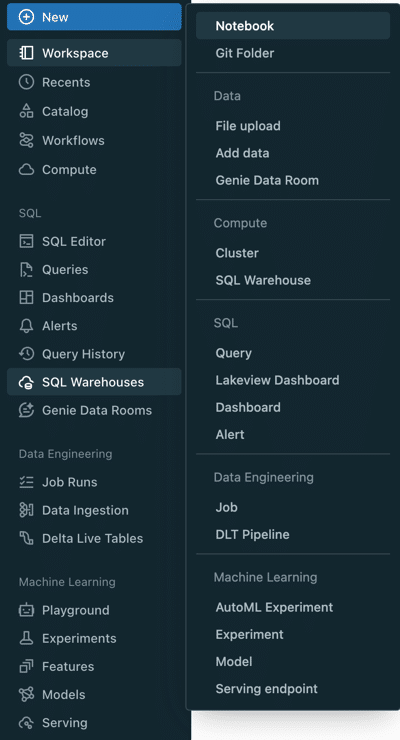
Step 2: Write and run your SQL query.
- In the query editor, compose your SQL query to retrieve the data you want to export.
- Double-check your query for accuracy and completeness.
Step 3: Uncheck the “LIMIT 1000” option to retrieve all results.
- By default, Databricks limits query results to 1000 rows.
- Locate the “LIMIT 1000” checkbox near the query editor and uncheck it to retrieve all matching rows.
Step 4: Click the download button and select CSV format.
- After running the query, look for a download button or icon in the results pane.
- Click on the download option and choose “CSV” as the export format.
Step 5: Save the file to your desired location.
- Choose a location on your local machine or network drive to save the CSV file.
- Give the file a descriptive name that includes the date or version for easy reference.
While the CSV export method is straightforward, it does have some disadvantages:
- It can be time-consuming for large or frequent exports, requiring manual intervention each time.
- There’s a potential for human error in data handling, especially when dealing with large datasets.
- This method lacks real-time data updates, providing only a snapshot of the data at the time of export.
Method 3. Python
For users comfortable with Python, using libraries like pandas and openpyxl offers a programmatic approach to exporting data from Databricks to Excel. This method provides flexibility and automation possibilities for more advanced users.
Step-by-step walkthrough:
Step 1: Import necessary libraries.
- Ensure you have pandas and openpyxl installed in your Python environment.
- Import the required libraries at the beginning of your script.
Step 2: Connect to your Databricks instance.
- Use the appropriate connection method for your Databricks setup (e.g., JDBC, REST API).
- Authenticate your connection using your Databricks credentials.
Step 3: Query your data into a Spark DataFrame.
- Write your SQL query to retrieve the desired data.
- Execute the query and store the results in a Spark DataFrame.
Step 4: Convert Spark DataFrame to Pandas DataFrame.
- Use the toPandas() method to convert the Spark DataFrame to a Pandas DataFrame for easier manipulation.
Step 5: Use pandas to_excel() function to export data.

Stop exporting data manually. Sync data from your business systems into Google Sheets or Excel with Coefficient and set it on a refresh schedule.

- Utilize the to_excel() function from pandas to write the data to an Excel file.
- Specify the output file path and any additional formatting options.
Here’s an example code snippet demonstrating this process:
import pandas as pd
from pyspark.sql import SparkSession
# Create SparkSession
spark = SparkSession.builder.appName(“DatabricksExport”).getOrCreate()
# Query data
df = spark.sql(“YOUR SQL QUERY HERE”)
# Convert to Pandas DataFrame
pandas_df = df.toPandas()
# Export to Excel
pandas_df.to_excel(“output.xlsx”, index=False)
Disadvantages of Using Python Libraries:
- Requires Python programming knowledge, which may not be suitable for all users
- Additional setup and maintenance of Python environments and libraries needed
- Potential for script errors or breakages if Databricks or library APIs change
Streamline Your Databricks Data Exports with Coefficient
Exporting data from Databricks doesn’t have to be a complex process. While manual CSV exports and Python libraries offer viable solutions, Coefficient provides a seamless, real-time integration that saves time and reduces errors. By connecting Databricks directly to your spreadsheets, you can ensure your data is always up-to-date and ready for analysis.
Ready to simplify your data workflow and ensure seamless data exports from Databricks to Excel? Get started with Coefficient today and experience the power of automated data syncing for yourself.
Frequently Asked Questions
How do I export results from Databricks to Excel?
You can export Databricks results to Excel using Coefficient for real-time syncing, manually downloading CSV files and opening them in Excel, or using Python libraries like pandas to create Excel files directly from Databricks.
How do I pull data from Databricks in Excel?
The easiest way to pull data from Databricks into Excel is by using Coefficient. It allows you to connect your Databricks account directly to Excel, enabling real-time data syncing and automated report updates.
How do I export files from Databricks?
To export files from Databricks, you can use the Databricks UI to export notebooks, use SQL queries to export data as CSV, or leverage tools like Coefficient to automate the export process to spreadsheets.
How do I export cell output from Databricks?
You can export cell output from Databricks by clicking the downward-pointing arrow next to the tab title and selecting the download option. For a more streamlined approach, consider using Coefficient to automatically sync cell outputs to your preferred spreadsheet application.

