Are you struggling to calculate and interpret z-scores in Excel? This comprehensive guide will walk you through the entire process, from basic concepts to advanced techniques. By the end, you’ll be confidently using z-scores for statistical analysis and data interpretation in your Excel projects.
Step-by-Step Guide: How to Find the Z-Score in Excel
Before calculating z-scores, you need to set up your Excel worksheet properly.
Setting up your data
- Open a new Excel worksheet.
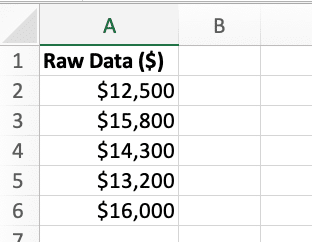
- Enter your raw data in column A, starting from cell A2.
- Label cell A1 as “Raw Data” to identify the column.
Calculating mean and standard deviation
To calculate z-scores, you need to know the mean and standard deviation of your dataset.
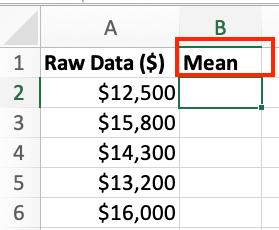
- In cell B1, enter “Mean”.
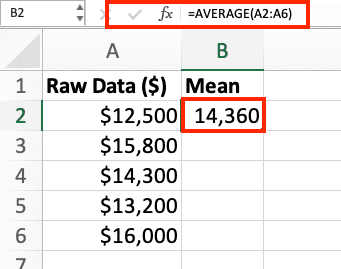
- In cell B2, use the AVERAGE function to calculate the mean:
Copy
=AVERAGE(A2:A100)
(Adjust the range to match your data)
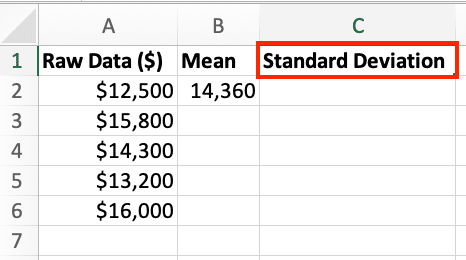
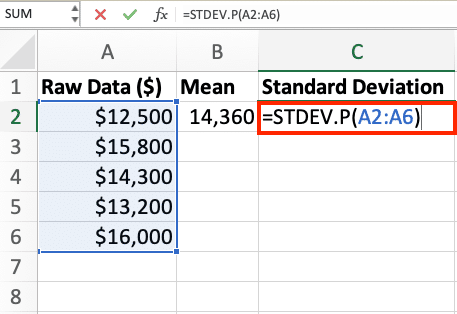
- In cell C1, enter “Standard Deviation”.
- In cell C2, use the STDEV.P function to calculate the population standard deviation:
Copy
=STDEV.P(A2:A100)
(Use STDEV.S for sample standard deviation if appropriate)
Creating columns for z-score calculation
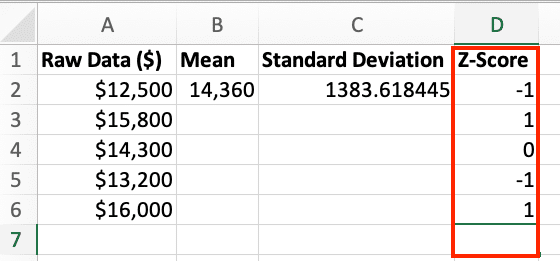
- In cell D1, enter “Z-Score”.
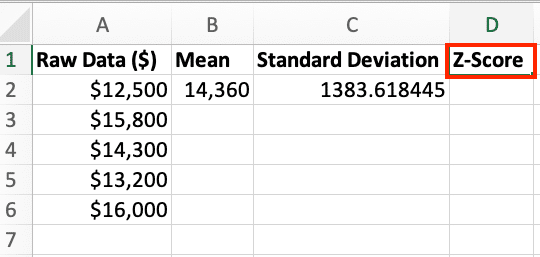
- You’ll use column D to calculate the z-scores for each data point.
Step-by-Step Guide: Calculating Z-Scores in Excel
Using the basic z-score formula
To calculate z-scores manually using the formula:
- In cell D2, enter the following formula:
Copy
=(A2-$B$2)/$C$2
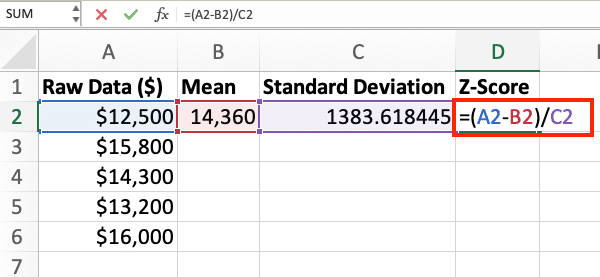
- Press Enter. This calculates the z-score for the first data point.
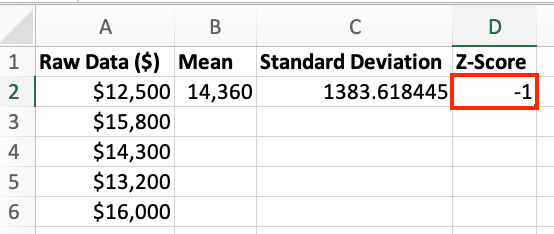
- Edit the formula above for each column of the raw data to calculate the z-score
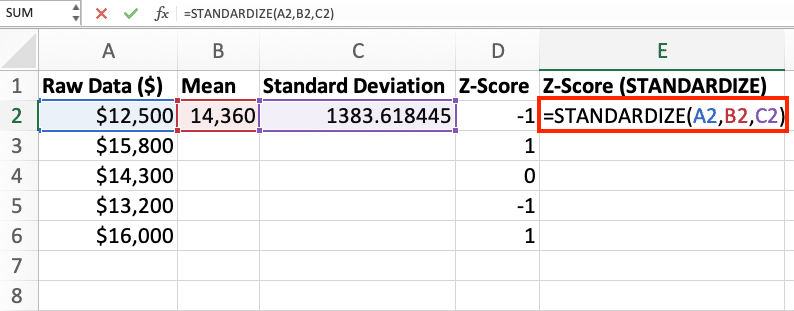
Implementing the STANDARDIZE function
Excel provides a built-in function for calculating z-scores:
- In cell E1, enter “Z-Score (STANDARDIZE)”.
- In cell E2, use the STANDARDIZE function:
Copy
=STANDARDIZE(A2,$B$2,$C$2)
- Edit the formula above for each column of the raw data to calculate the z-score
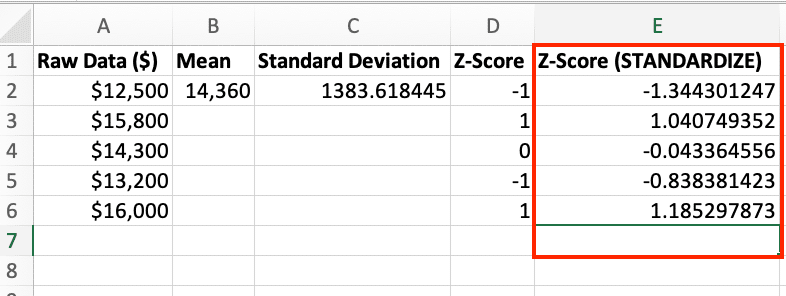
The STANDARDIZE function automatically calculates z-scores using the same formula we used manually.
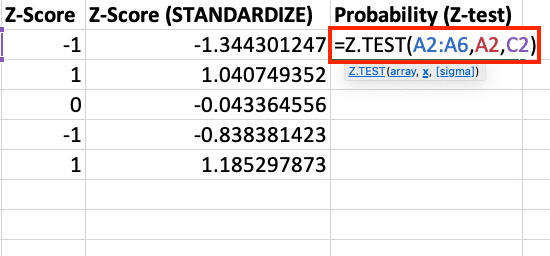
Utilizing the Z.TEST function for probability
The Z.TEST function calculates the probability that a value from the dataset is greater than a specified z-score:
- In cell F1, enter “Probability (Z.TEST)”.
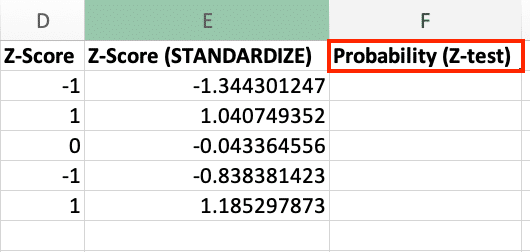
- In cell F2, use the Z.TEST function:
Copy
=Z.TEST(A2:A100,A2,$C$2)
- Edit the formula above for each column of the raw data to calculate the z-score
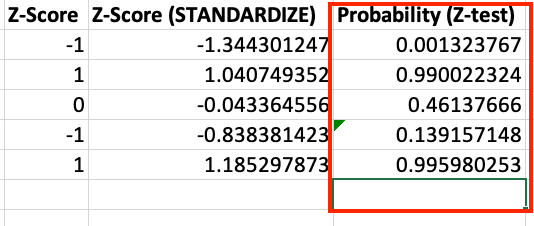
This calculates the probability of observing a value greater than each data point in your dataset.
Advanced Z-Score Techniques in Excel
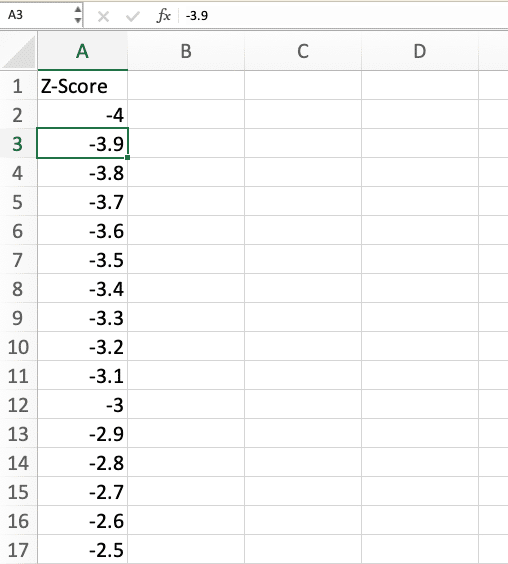
Creating a z-score table
A z-score table shows the probability of a z-score occurring in a standard normal distribution:
- In a new worksheet, create a column of z-scores from -4 to 4 in increments of 0.1.
- In the adjacent column, use the NORM.S.DIST function to calculate the cumulative probability:
Copy
=NORM.S.DIST(A2,TRUE)
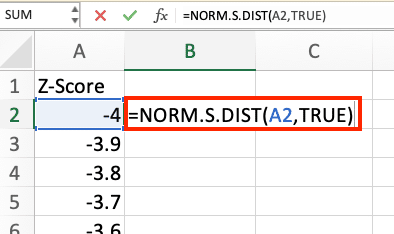
- Apply this formula to the entire column.
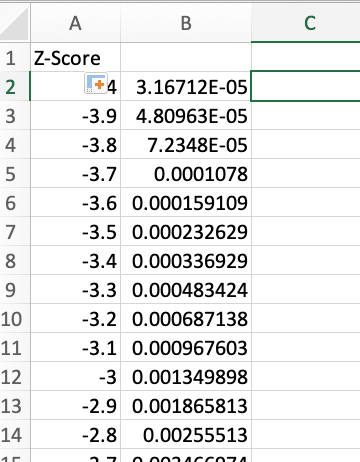
This table allows you to look up probabilities for specific z-scores quickly.
Converting z-scores to percentiles
To convert z-scores to percentiles:
- In a new column, enter the formula:
Copy
=NORM.S.DIST(D2,TRUE)

- Apply this formula to all z-scores in your dataset.
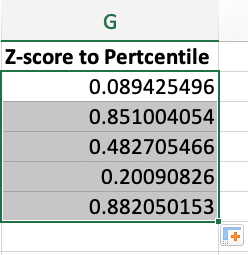
The result represents the percentage of values that fall below each data point in a standard normal distribution.
Calculating inverse z-scores
To find the raw score associated with a given z-score:

Stop exporting data manually. Sync data from your business systems into Google Sheets or Excel with Coefficient and set it on a refresh schedule.
Get Started
- In a new column, use the NORM.INV function:
Copy
=NORM.INV(F2,$B$2,$C$2)
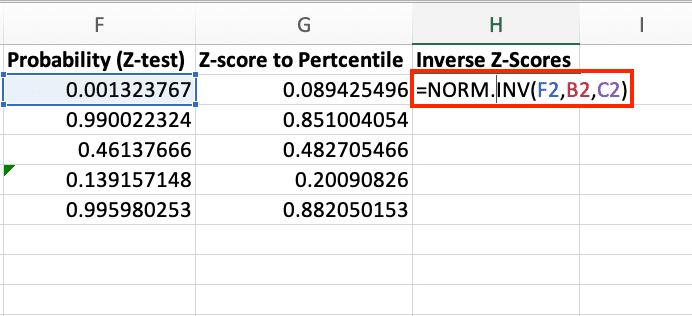
- This formula calculates the raw score that corresponds to the probability calculated by Z.TEST.
Understanding Z-Scores: The Basics
What is a z-score?
A z-score, also known as a standard score, is a statistical measure that quantifies how many standard deviations an individual data point is from the mean of a dataset. It allows you to compare values from different datasets or distributions by standardizing them to a common scale.
Why are z-scores important?
Z-scores are crucial in statistical analysis for several reasons:
- Standardization: They convert values from any normal distribution into a standard normal distribution, making it easier to compare data from different sources.
- Outlier detection: Z-scores help identify unusual or extreme values in a dataset.
- Probability calculation: They allow you to determine the likelihood of a particular value occurring in a dataset.
- Performance comparison: Z-scores enable you to compare relative standings across different datasets.
The z-score formula explained
The formula for calculating a z-score is:
Copy
z = (x – μ) / σ
Where:
- z is the z-score
- x is the individual data point
- μ (mu) is the mean of the population
- σ (sigma) is the standard deviation of the population
This formula essentially measures how far a data point is from the mean in terms of standard deviations.
Beyond Z-Scores: Connecting Excel to Live Data
Excel provides tools for statistical analyses like z-scores, but businesses often need to work with data from multiple systems. Coefficient connects over 50 business systems directly to your spreadsheets. This allows you to sync live data, create real-time reports, and automate data updates in Excel. To see how this can improve your data analysis, check out Coefficient.


