
Excel’s What-If Analysis tools help you explore different outcomes by varying key inputs in your calculations. Whether you’re forecasting sales, planning budgets, or analyzing investment returns, these tools let you test multiple scenarios without manually changing your spreadsheet data. Let’s explore how to use Data Tables, Scenario Manager, and Goal Seek to make better-informed business decisions.
How to Use Data Tables for What-If Analysis in Excel
Data Tables allow you to see how different input values affect your formulas’ results. You can create both one-variable and two-variable analyses.
Creating a One-Variable Data Table
- Set up your base calculation:
Initial Investment: $10,000
Annual Return Rate: 8%
Years: 5
Future Value Formula: =FV(B2,B3,0,-B1)

- Create your data table structure:
- Enter your input values in column A, starting at A2
- your result formula in B1
- Select the entire range including inputs and formula
- Access Data Table:
Data > What-If Analysis > Data Table

- Configure settings:

- For Column input cell: Select your variable cell (return rate)
- Leave Row input cell blank
- Click OK
Example one-variable data table showing investment returns:
|
Return Rate |
Future Value |
|---|---|
|
6% |
$13,382.25 |
|
7% |
$14,025.52 |
|
8% |
$14,693.28 |
|
9% |
$15,386.24 |
Creating a Two-Variable Data Table
- Set up similar to one-variable table but include:
- Row input values across row 1
- Column input values down column A
- Formula in top-left corner
- Select entire range and create Data Table:
- Set Column input cell (first variable)
- Set Row input cell (second variable)
Example two-variable data table showing investment returns with different time periods:
|
Return/Years |
5 Years |
10 Years |
15 Years |
|---|---|---|---|
|
6% |
$13,382 |
$17,908 |
$23,966 |
|
8% |
$14,693 |
$21,589 |
$31,721 |
|
10% |
$16,105 |
$25,937 |
$41,772 |
Creating Scenarios with Excel’s Scenario Manager
Scenario Manager helps you save and switch between different sets of input values.
Setting Up Scenarios
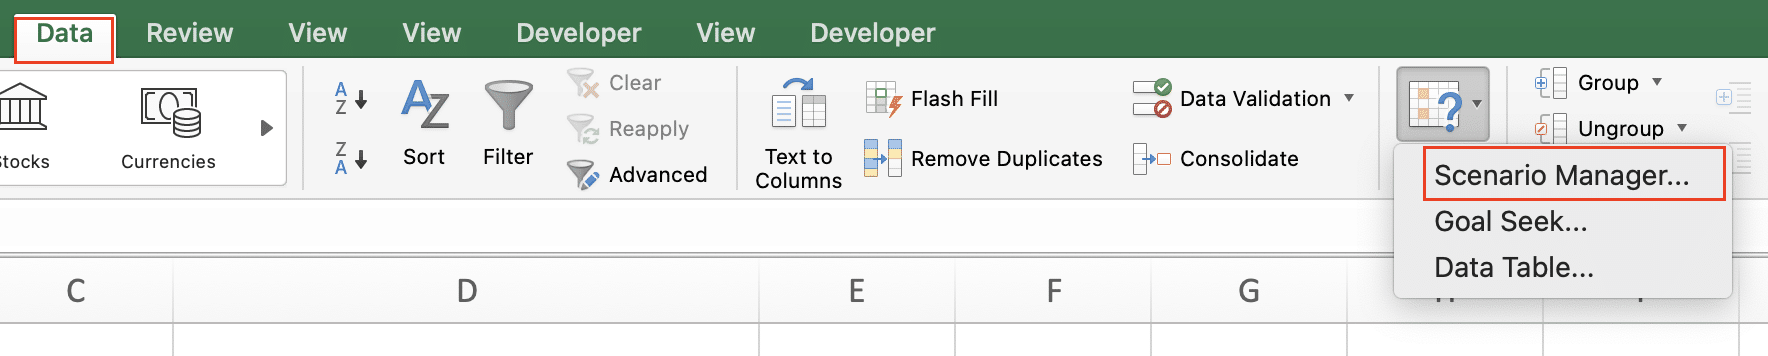
- Access Scenario Manager:
Data > What-If Analysis > Scenario Manager
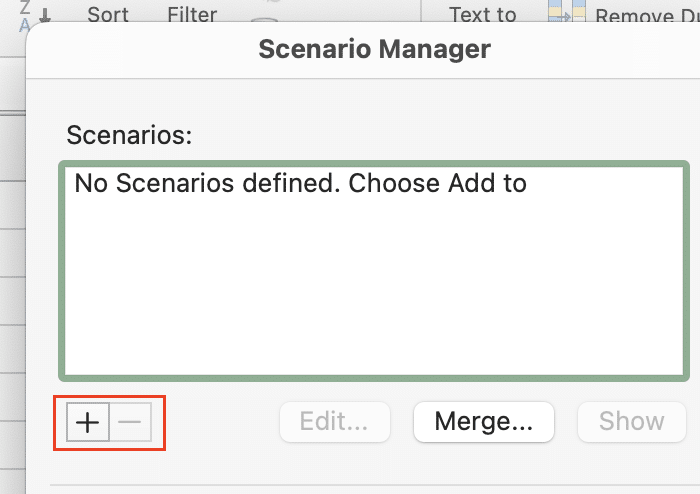
- Create a new scenario:
Click ‘Add’
Name: Best Case

Changing cells: Select input cells
Enter values
Click OK
- Example scenario set for sales forecast:
|
Scenario |
Growth Rate |
Marketing Cost |
Units Sold |
|---|---|---|---|
|
Best Case |
15% |
$50,000 |
10,000 |
|
Base Case |
10% |
$40,000 |
8,000 |
|
Worst Case |
5% |
$30,000 |
6,000 |
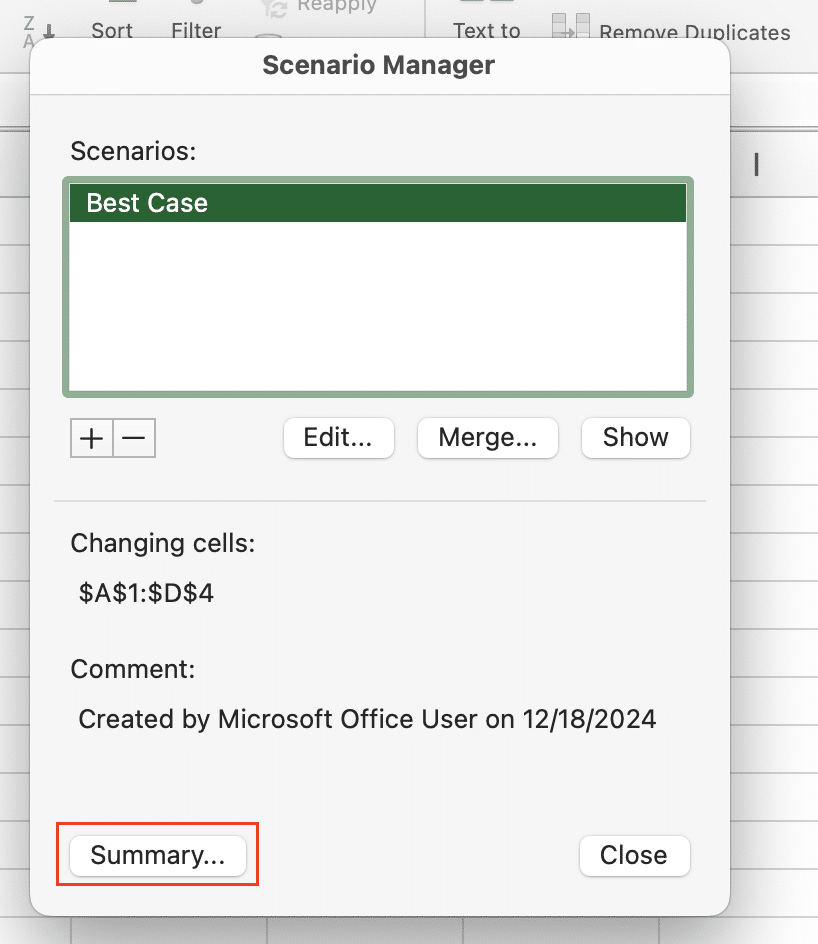
- Generate summary:
Click ‘Summary’

Stop exporting data manually. Sync data from your business systems into Google Sheets or Excel with Coefficient and set it on a refresh schedule.
Get Started
Select ‘Scenario summary‘
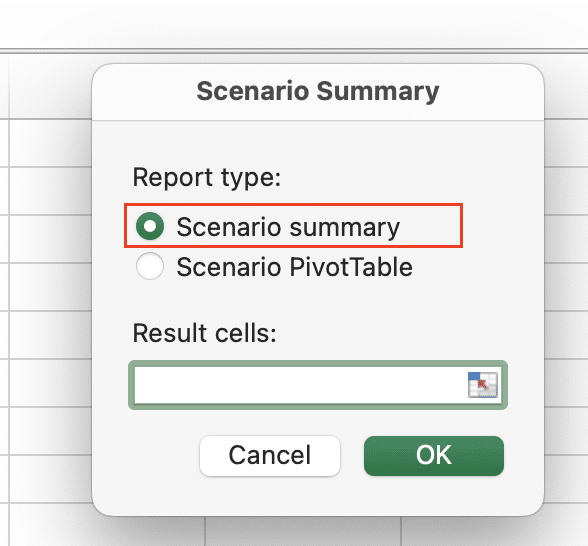
Choose result cells
Click OK
Using Goal Seek for Target-Based Analysis
Goal Seek helps you find the input value needed to achieve a specific target result.
Goal Seek Example: Loan Payment
- Set up loan calculation:
Loan Amount: $200,000
Annual Rate: [To find]
Term (years): 30
Monthly Payment: =$B$1*B2/12/(1-(1+B2/12)^(-B3*12))
Target Payment: $1,200
- Access Goal Seek:
Data > What-If Analysis > Goal Seek

- Configure settings:
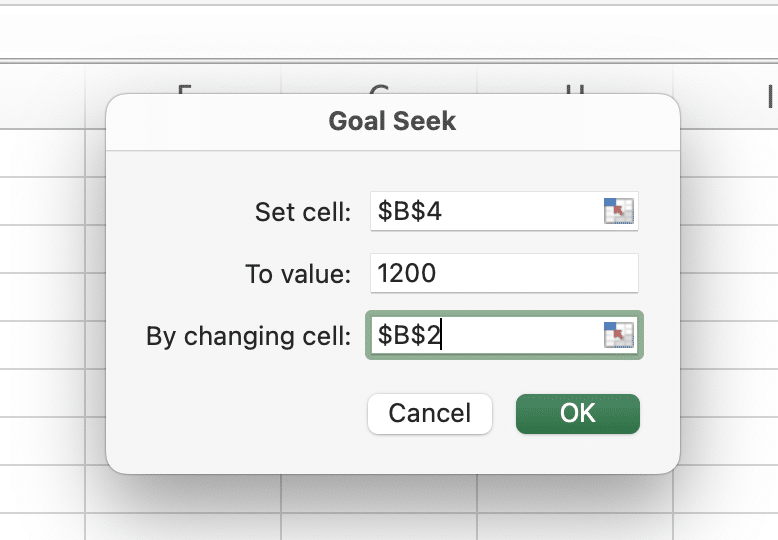
- Set cell: Monthly payment cell
- To value: 1200
- By changing cell: Annual rate cell
Real-World Applications
Sales Forecasting Example
Base Revenue: $100,000
Growth Scenarios:
– Conservative: 5%
– Moderate: 8%
– Aggressive: 12%
Formula: =B1*(1+B2)^A3
Investment Returns Analysis
Initial Investment: $50,000
Time Periods: 10, 15, 20 years
Return Rates: 6%, 8%, 10%
Formula: =FV(rate,nper,0,-pv)
Essential What-If Analysis Formulas
Key functions for scenario planning:
|
Function |
Purpose |
Example |
|---|---|---|
|
NPV |
Net Present Value |
=NPV(0.1,B2:B6) |
|
IRR |
Internal Rate of Return |
=IRR(B1:B5) |
|
PMT |
Loan Payments |
=PMT(rate/12,terms*12,principal) |
|
FV |
Future Value |
=FV(rate,nper,0,-pv) |
Next Steps
What-If Analysis tools in Excel provide powerful ways to model different scenarios and make data-driven decisions. From simple one-variable analyses to complex scenario planning, these tools help you understand how changes in key variables affect your outcomes.
Ready to take your spreadsheet analysis to the next level? Coefficient helps you automate data updates and maintain real-time connections to your business systems, ensuring your What-If analyses always use the most current data. Get started with Coefficient today to transform your Excel experience.


